Research Article: 2021 Vol: 24 Issue: 1S
Implementation of the theory of Planned Behavior as a Predictor of Peoples Intention to Quit Smoking.
B.M.A.S. Anaconda Bangkara, President University
Matnur Syuryadi,President University
Wisnundito Aji Kuncoro, President University
Abstract
People essentially have known the risks of smoking and its consequences. However, some Indonesian people, including those in Cikarang Utara District, Bekasi, Jawa Barat, and its surrounding areas, still practice it. In terms of health, it is hoped that smoking habits will decrease from time to time. The Theory of Planned Behavior (TPB) states that Intention is an important factor in determining behavior. Intention means a person's desire or tendency to act a behavior predisposed by attitudes toward behavior, subjective norms, and perceived behavioral control. The purpose of this research was to contribute to reducing smoking through the application of TPB. This research was a quantitative study that applied a purposive sampling technique, involved 518 respondents, and used Structural Equation Modelling (SEM) and Lisrel 8.80 analysis tool. The results indicated that Attitude has no significant effect on Intention to quit smoking, but Subjective Norms and Perceived Behavioral Control significantly contribute to that.
Keywords
Attitude, Intention to Quit Smoking, Perceived Behavioral Control, Subjective Norms, Theory of Planned Behavior
Introduction
The Covid-19 pandemic that began in 2019 has not been fully controlled until now, though some countries have shown improvements. The European football championship held with the attendance of spectators in the stadium did not necessarily indicate that the pandemic had ended. The Tokyo Olympics, on the other hand, were held without spectators to prevent transmission of the virus. As we all know, Covid-19 causes respiratory problems. A person's lung health will significantly determine his resistance to the virus. Unfortunately, many people still have a bad habit, namely smoking, which affects themselves and those around them. Smoking can cause both long and short-term effects. In terms of short-term effects, smoking can cause unpleasant odors in hair and clothes, reduce oxygen supply to the brain and lungs, and raise blood pressure. In terms of long-term effects, it can lead to death from cardiovascular disease, respiratory tract infections, obstructive lung disease, and cancers in the lungs, mouth, throat, stomach, pancreas, large intestine, kidney, bladder, prostate, cervix, and breast (RI, 2011). The World Health Organization (WHO) estimates that at least by 2019, more than 1.2 billion people did smoking worldwide, mostly in developing countries (Tempo.co, 2019). Cigarette use among adolescents in some countries has also increased and tended to jeopardize the progress of reducing chronic diseases and tobacco-related deaths (Winoto, Cahyo & Indraswari, 2018). Tobacco Control Atlas, reported by The Southeast Asia Tobacco Control Alliance (SEATCA), says that the country with the most smokers in the ASEAN region is Indonesia. The data of the years up to 2014 showed that 65.19 million Indonesian people, representing 34% of the total population of Indonesia, smoked. About 79.8% of the smokers bought cigarettes from small shops or minimarkets, while 17.6% did from supermarkets. In Indonesia, there were 2.5 million shops which are cigarette retailers. This figure did not take into account the roadside cigarette sellers (Alliance, 2014). This cigarette-related issue can be dilemmatic. On the one hand, cigarette industries, especially in developing countries, may increase the countries revenue and provide job opportunities. On the other hand, smoking can cause many, especially health, problems, as mentioned above. However, of course, public health will be a priority. For this reason, efforts to reduce the number of cigarette addicts need to be done. A person's intention to do something is persuaded by his attitude, subjective norms, and perceived behavioral control. Intention serves as an indication of a person's desire before doing something or trying something and how much effort is made before behaving. The stronger the intention of a person towards something, the greater the possibility he will manifest his behavior (Ajzen, 1991; LaMorte, 2019). Intention serves as a strong predictor of behavior. Several studies on people's smoking intention using the Theory of Planned Behavior (TPB), which is commonly applied in the health sector, say that Intention to smoke is a strong predictor for determining smoking behavior. TPB reveals that Intention is a very important factor in determining behavior. A person's desire or inclination to conduct behavior that is persuaded by attitudes towards behavior, subjective norms, and perceived behavioral control is called Intention (Fishbein & Ajzen, 1975). Cigarette production in Indonesia continues to increase due to the high level of market demand from year to year. According to the Ministry of Industry, it increases by around 5% - 7.4 % per year (Kemenperin, 2019). In 2015, it reached 398.6 billion units and rose 5.7% to 421.1 billion in 2016. Based on the prediction, in 2020, it reached 524.2 billion (Ayuningtyas, 2019). The number of young smokers is also known to have increased sharply. In the last decade, it increased by 240% from 9.6% in 2007 to 23.1% in 2018. So, in 11 years, it increased by 240% at the age of 10-14 years. The number of those older than 15-19 also increased by 140% (Dwianto, 2020). According to a survey by the Ministry of Health of Indonesia, Jawa Barat Province has the highest number of smokers in Indonesia. The proportion of smokers to the total population in the province reached 32.7%, consisting of heavy and moderate smokers of 27% and 5.6%, respectively (Kesehatan, 2015). Cikarang Utara District, Bekasi, Jawa Barat Province, has a smoking-related disease rate of 17% (Badan Pusat Statistik Bekasi, 2016). Considering the points described above, this study aimed to identify predictors that will contribute to a person's intention to do something, namely the intention to quit smoking, through the Theory of Planned Behavior, with three independent variables (Attitude, Subjective Norms, and Perceived Behavioral Control) and a dependent variable (Behavioral Intention) adapted from Ajzen (1991). The study would take place in Cikarang Utara District, a part of the Jababeka industrial area with about 2,125 industries. If each of them has 1,000 employees, on average, then the population in this region can reach over 2 million people. Previous studies found that many smokers continued smoking although having intended to quit. Therefore, the factor Intention becomes essential to be taken into account.
Theory of Planned Behavior
The Theory of Planned Behavior (TPB) was previously known as the Theory of Reacted Action (TRA), which described stages in a person's behavior. First of all, assumably, behavior is determined by intention. This intention then explains that attitudes towards behavior and subjective norms will play a role in determining attitudes toward behavior. In the joining stage, it becomes a variable that affects intention based on several principles, such as behavioral beliefs and expectations of those around them. Therefore, a person's behavior is explainable through the level of self-belief. Ajzen (1991) stated that the Theory of Reacted Action (TRA) is expanded and modified to be the Theory of Planned Behavior (TPB) by adding a construct that did not exist in the TRA, namely perceived behavioral control. The TPB shows that human actions are directed by three kinds of beliefs as follows:
1. Behavioral belief is a person's belief to perform a behavior. This theory calls it attitude toward behavior.
2. Normative beliefs are beliefs to meet the normative expectations of someone or others and struggle to conform to these expectations. This theory calls these beliefs subjective norms.
3. Control is a belief about the existence of a strong influence, which can be an obstacle or a helper in carrying out the performance of a behavior. This theory calls it perceived behavioral control.
Intention
Intention means a desire or a plan to do something or particular actual behavior (Yudantara, 2014). It also reflects an impelling cause that regulates whether or not a person performs the behavior. It includes indicators that expose how much and how hard a person is willing to execute the behavior (Okumah et al., 2019). Dharmesta (1998) argued and believed that intention is the central point in the Theory of Planned Behavior (Anggraini, 2018).
Attitude
There are several expert opinions regarding the definition of attitude. According to Ajzen (1988), attitude is a person's tendency to respond to something, in a certain way, whether it is good or bad, in response to something or someone. According to Greaves et al., in Ayob et al., (2017), it can function as a determinant representing a person's common evaluation of a particular behavior. As stated by Anggraini (2018), it is a mode by which someone responds to a stimulus. Meanwhile, as said by Strydom (2018), it is an individual factor, which refers to the person's assessment of a particular behavior and relates to personal recognition and tendencies towards particular behaviors (Shen et al., 2019). All these definitions draw that attitude means the thoughts, tendencies, and feelings of a person to recognize the surrounding environment, and all mentioned above tend to be permanent.
Subjective Norms
According to Fishbein & Ajzen (1975), in general, subjective norms are settled by the following two determinants:
• A person's perception or belief about the expectations of a certain individual or group of him/her that will be a reference for him/her to respond (normative beliefs).
• Individual motivation to meet these expectations (motivation to comply).
Normative beliefs can be formed as a result of an attempt to conclude. For example, if you believe that someone important to you feels happy when you exhibit a particular behavior, you will see that a group of people you consider important to you expects the same behavior.
Perceived Behavioral Control
Perceived Behavioral Control can be described as the perception of a person or individual about the ease or difficulty of carrying out a particular behavior (Ajzen, 1987). Meanwhile, Greaves, et al., (2013) explained that Perceived Behavioral Control is a perception perceived by individuals affected by difficulties in carrying out a particular behavior but have control over the behavior itself. The higher a person's self-confidence in carrying out a particular behavior, the higher the person's intention to do that behavior (Ayob et al., 2017).
Theoretical Framework
The fact says that many people still do smoking while they know well the risks facing themselves and the people around them. Thus, this study aims to determine the predictor factors of the Theory of Planned Behavior to reduce the number of smokers, which, in turn, will contribute to the presence of a cleaner living environment in addition to, of course, building a healthier generation. The Theory of Planned Behavior has three independent variables: Attitude, Subjective Norms, and Perceived Behavioral Control, and one independent variable: Intention. This framework was used by Farah (2019), who examined smokers in Surabaya and focused on the gender aspect. Source: Adapted From Farah (2019)

Figure 1: Theoretical Framework
Hypothesis Development
As can be seen in the theoretical framework above, this study has 3 (three) hypotheses, namely:
H1: Attitude toward Behavior has a significant role in the intention to quit smoking
H2: Subjective Norms has a significant role in the intention to quit smoking
H3: Perceived Behavioral Control a significant role in the intention to quit smoking
Research Methodology
This research applied quantitative methods using Structural Equation Modeling (SEM). Data collection was carried out through offline and online questionnaires. The data collected were analyzed applying LISREL 8.80 software.
Research Design
A Structural Equation Model (SEM) was operated in this research to validate the causality and relationship between all designated variables. Meanwhile, Confirmatory Factor Analysis (CFA) was operated to measure variables, followed by Covariance-Based Structural Equation Modeling (CB-SEM). Essentially, these processes accommodated the contribution of the maximum likelihood procedure to minimize the dissimilarity between the observed and estimated covariance matrices, contrasted with maximizing the variance described (Hair, Gabriel, and Patel 2014).
Population and Sampling Technique
The population in this study was smokers found in the Cikarang Utara District, Bekasi, Jawa Barat. The questionnaires prepared in advance were distributed through purposive sampling. During the distribution of the questionnaires, a sample of 518 people was obtained. According to Ferdinand (2014), sample size ought to be at least four or five times of total questions of variables or items used. Therefore, N=5 × Q (Ferdinand, 2002), where N represents sample size and Q stands for Question (or, in this case, Statement). The number of questions (statements) in the questionnaire that had been tested was 26, thus meeting the requirement. The questionnaires accustomed to collect data were in the form of the 5-point Likert scales to assess the respondents' conformity on the statements given (Sekaran & Bougie, 2016).
Validity Testing
The validity testing functions to measure how well a questionnaire is (Neuman 2014). A questionnaire is deemed as valid if the correlation is more than the r-value. The test was done with the Pearson Product Moment approach. The researchers decided to involve 15 respondents in the pre-test, then df was 13, and the r-value was 0.514 with α: 0.05. Hence, in this particular research, statements with a correlation more than 0.514 were considered valid, while those with a correlation lower than 0.514 were considered as invalid and should be eliminated. The Pearson Product Moment formula is as follows:
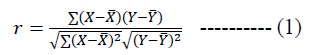
Where X̄=mean of X variable
Ȳ= mean of Y variable
Realibility Testing
Reliability testing aims to test the consistency and stability. Cronbach’s alpha represents the coefficient of reliability. A value less than 0.6 means poor, 0.7 means acceptable, and those over 0,8 mean good (Sekaran & Bougie, 2016). The equation for reliability testing is as follows:
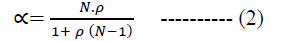
where α: instrument’s reliability coefficient, ρ: average inter-item correlation, and N: number of items.
Measurement Model
The application of Confirmatory Factor Analysis (CFA) is to measure latent variables. Confirmatory Factor Analysis (CFA) of CB-SEM allows all latent constructs to be covariant. Thus, it allows a quantitative assessment of convergent and discriminant validity for every construct (Hair, Gabriel & Patel, 2014). When measuring variables, a researcher must check the model's suitability, validity, and reliability. CR (Construct Reliability) is adequate if it is above 0.6, so is AVE (Average Extracted Variant) if above 0.4 (Fornell & Larcker 1981; Lam, 2012)..
Goodness of Fit Test
Several approaches, such as the absolute fit measure, the parsimony suitability measure, and the incremental fit measure, are applicable for this matter. This study focused on the absolute fit size to get the overall suitability levels for the estimation and the structural models. There are a number of criteria of goodness of fit which the model recommends to fulfill, such as: (Table 1)
| Table 1 Goodness of Fit |
|
|---|---|
| Goodness of fit measure | Threshold |
| CMIN | P ≥ 0.5 (N<250) |
| CMIN/df | ≤ 3 |
| GFI | ≥ 0.90 |
| AGFI | ≥ 0.80 |
| RMR | ≤ 0.1 |
| RMSEA | ≤ 0.08 |
| NFI | ≥ 0.90 |
| CFI | ≥ 0.90 |
| TLI | ≥ 0.90 |
| PGFI | ≥ 0.50 |
| PCFI | ≥ 0.50 |
| PNFI | ≥ 0.50 |
Source: Hair et al., (2010)
Results and Discussion
Discussion of the results of this study begins with the outcomes of a series of tests, as follows.
Validity Testing
The researchers decided to involve a sample of 15 for pre-test with a significance level of 0.05. All statements with a Pearson correlation higher than 0.514 would be considered valid. All invalid statements were eliminated.
| Table 2 Results of Validity Testing |
|||
|---|---|---|---|
| Items | R-table | R-compute value | Result |
| Attitude | |||
| BB1 | 0.514 | 0.900 | VALID |
| BB2 | 0.514 | 0.772 | VALID |
| BB3 | 0.514 | 0.774 | VALID |
| EBB1 | 0.514 | 0.807 | VALID |
| EBB2 | 0.514 | 0.847 | VALID |
| EBB3 | 0.514 | 0.886 | VALID |
| Subjective Norms | |||
| MC1 | 0.514 | 0.829 | VALID |
| MC2 | 0.514 | 0.693 | VALID |
| MC3 | 0.514 | 0.707 | VALID |
| NB1 | 0.514 | 0.741 | VALID |
| NB2 | 0.514 | 0.577 | VALID |
| NB3 | 0.514 | 0.854 | VALID |
| PBC | |||
| CB1 | 0.514 | 0.624 | VALID |
| CB2 | 0.514 | 0.820 | VALID |
| CB3 | 0.514 | 0.026 | Not VALID |
| PC1 | 0.514 | 0.774 | VALID |
| PC2 | 0.514 | 0.807 | VALID |
| PC3 | 0.514 | 0.801 | VALID |
| Intention | |||
| ACT1 | 0.514 | 0.756 | VALID |
| ACT2 | 0.514 | 0.623 | VALID |
| ACT3 | 0.514 | 0.323 | Not VALID |
| CTX1 | 0.514 | 0.897 | VALID |
| CTX2 | 0.514 | 0.806 | VALID |
| CTX3 | 0.514 | 0.849 | VALID |
| TGT1 | 0.514 | 0.899 | VALID |
| TGT2 | 0.514 | 0.845 | VALID |
| TGT3 | 0.514 | 0.906 | VALID |
| TM1 | 0.514 | 0.890 | VALID |
| TM2 | 0.514 | 0.655 | VALID |
| TM3 | 0.514 | 0.678 | VALID |
Source: Research results
From the table above, it can be seen that all indicators of each variable could be said to be valid, except CB3 and ACT3, which had a correlation value below 0.514. Then, CB3 and ACT3 were no longer included in the next process.
Reliability Testing
A questionnaire is reliable if having Cronbach’s Alpha coefficient above 0.8. Table 3 shows that Cronbach’s Alpha coefficient values overall were 0.974. In Table 4, almost all variables had coefficients above 0.8, except just one variable, which had that close to 0.8. It indicates that the questionnaire used was considered reliable. Therefore, the questionnaire was suitable for research.
| Table 3 Reliability Statistics |
|
|---|---|
| Cronbach's Alpha | N of Items |
| 0.974 | 30 |
Source: Research results
The Cronbach's Alpha coefficients for each variable: Attitude, Subjective Norms, Perceived Behavioral Control, and Intention are as follows:
| Table 4 Reliability for Each Variable |
||
|---|---|---|
| Variables | Cronbach’s Alpha | Description |
| Attitude | 0.937 | Excellent |
| Subjective Norm | 0.876 | High Reliability |
| Perceived Behavioral Control | 0.746 | Acceptable |
| Intention | 0.944 | Excellent |
Source: Research results
Thus, based on the reliability testing, it can be concluded that the questionnaire used was reliable to be a research instrument.
Measurement Model Analysis
To determine the indicators (observed variables) for every construct variable and to calculate the construct reliability value, analysis of the measurement model was carried out whose results are:

Figure 2: Standardized Estimate
Source: Research Result

Figure 3: T-Values
Source: Research Result
Factor Validity Test Results
As recommended by Hair (1998), factor loading needs to be more than 0.5 to state that the model used has a good fit, apart from considering the t-value. This t-value must be more than the critical value (>1.96). If the requirements are met, the observed variable is appropriate for use as a latent variable constructor. The analysis of the research construct validity can be seen in Table 5 below.
| Table 5 Results of Measurement of Cconstruct Validity |
||||
|---|---|---|---|---|
| Dimension | Variable | Factor Loading | t-value | Remarks |
| BB1 | Attitude Toward Behavior (ATT) | 0.64 | 15.46 | Accepted |
| BB2 | 0.68 | 16.82 | Accepted | |
| BB3 | 0.75 | 19.13 | Accepted | |
| EBB1 | 0.55 | 12.70 | Accepted | |
| EBB2 | 0.13 | 2.70 | Accepted | |
| EBB3 | 0.62 | 14.76 | Accepted | |
| MC1 | Subjective Norms (SN) | 0.58 | 13.91 | Accepted |
| MC2 | 0.71 | 17.83 | Accepted | |
| MC3 | 0.81 | 21.65 | Accepted | |
| NB1 | 0.74 | 18.90 | Accepted | |
| NB2 | 0.68 | 16.88 | Accepted | |
| NB3 | 0.71 | 18.00 | Accepted | |
| CB1 | Perceived Behavioural Control (PBC) | 0.75 | 19.57 | Accepted |
| CB2 | 0.77 | 20.60 | Accepted | |
| PC1 | 0.78 | 20.86 | Accepted | |
| PC2 | 0.79 | 21.19 | Accepted | |
| PC3 | 0.76 | 20.16 | Accepted | |
| ACT1 | Intention to Quit Smoking (INT) | 0.74 | Accepted | |
| ACT2 | 0.73 | 16.85 | Accepted | |
| CTX1 | 0.82 | 19.16 | Accepted | |
| CTX2 | 0.72 | 16.65 | Accepted | |
| CTX3 | 0.79 | 18.41 | Accepted | |
| TGT1 | 0.86 | 20.37 | Accepted | |
| TGT2 | 0.81 | 18.99 | Accepted | |
| TGT3 | 0.87 | 20.47 | Accepted | |
| TM1 | 0.83 | 19.56 | Accepted | |
| TM2 | 0.72 | 16.81 | Accepted | |
| TM3 | 0.67 | 15.44 | Accepted | |
Source: Research Results
Table 5 above shows that all items in the questionnaire, for each Attitude Toward Behavior (ATT), Subjective Norms (SN), Perceived Behavioral Control (PBC), and Intention to Quit Smoking (INT), can be said to be accepted/valid because all of them have factor loading values of> 0.50, and t-values of> 1.96.
Construct Reliability Testing Results
Model reliability can be tested by construct reliability and variance extracted calculations, with the following formulas:
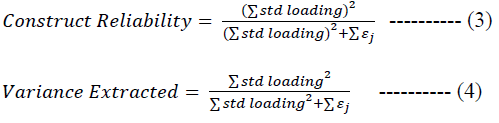
The calculation of Construct Reliability and Variance Extracted can be seen in Table 6 below.
| Table 6 Construct Reliability and Variance Extracted Calculation Results |
|||||||||
|---|---|---|---|---|---|---|---|---|---|
| Variable | Standard Loading | Error | Construct Reliability | Variance Extracted | |||||
| ∑ STd. Loading | (∑ STd. Loading)² | ∑ Error | CR | Standard Loading² | ∑ (Std. Loading)² | VE | |||
| Attitude toward Behavior (ATT) | |||||||||
| BB1 | 0.64 | 0.59 | 3.24 | 10.4976 | 2.21 | 0.83 | 0.41 | 2.12 | 0.5 |
| BB2 | 0.68 | 0.24 | 0.46 | ||||||
| BB3 | 0.75 | 0.20 | 0.56 | ||||||
| EBB1 | 0.55 | 0.62 | 0.30 | ||||||
| EBB3 | 0.62 | 0.56 | 0.38 | ||||||
| Subjective Norm (SN) | |||||||||
| MC1 | 0.58 | 0.66 | 4.23 | 17.8929 | 2.98 | 0.86 | 0.34 | 3.01 | 0.5 |
| MC2 | 0.71 | 0.5 | 0.50 | ||||||
| MC3 | 0.81 | 0.34 | 0.66 | ||||||
| NB1 | 0.74 | 0.45 | 0.55 | ||||||
| NB2 | 0.68 | 0.54 | 0.46 | ||||||
| NB3 | 0.71 | 0.49 | 0.50 | ||||||
| Perceived Behavioral Control (PBC) | |||||||||
| CB1 | 0.75 | 0.44 | 3.85 | 14.8225 | 2.03 | 0.88 | 0.56 | 2.97 | 0.59 |
| CB2 | 0.77 | 0.4 | 0.59 | ||||||
| PC1 | 0.78 | 0.39 | 0.61 | ||||||
| PC2 | 0.79 | 0.38 | 0.62 | ||||||
| PC3 | 0.76 | 0.42 | 0.58 | ||||||
| Intention to Quit Smoking (INT) | |||||||||
| ACT1 | 0.74 | 0.46 | 8.56 | 73.2736 | 4.31 | 0.94 | 0.55 | 6.70 | 0.61 |
| ACT2 | 0.73 | 0.47 | 0.53 | ||||||
| CTX1 | 0.82 | 0.33 | 0.67 | ||||||
| CTX2 | 0.72 | 0.48 | 0.52 | ||||||
| CTX3 | 0.79 | 0.38 | 0.62 | ||||||
| TGT1 | 0.86 | 0.26 | 0.74 | ||||||
| TGT2 | 0.81 | 0.34 | 0.66 | ||||||
| TGT3 | 0.87 | 0.25 | 0.76 | ||||||
| TM1 | 0.83 | 0.31 | 0.69 | ||||||
| TM2 | 0.72 | 0.48 | 0.52 | ||||||
| TM3 | 0.67 | 0.55 | 0.45 | ||||||
Source: Research Results
To be categorized as reliable, the Construct Reliability value must exceed 0.6, while the Variance Extracted value must exceed 0.5 (Hair, 2010). The table above shows that all Construct Reliability values are above 0.6 and all Extracted Variance values are at least 0.5, thus reliable.
Goodness of Fit Testing
The model fit of SEM ought to meet the value of model fit required. Numerous points need to be considered as acceptable, as follows.
| Table 7 Good of Fit Test Result |
|||
|---|---|---|---|
| Group | Indicator | Value | Remarks |
| 1 | Degree of Freedom | 326 | Good fit |
| Chi Square | 1783.01 | ||
| NCP | 1444.84 | ||
| Confidence Interval | 1316.63 ; 1580.53 | ||
| 2 | RMSEA | 0.093 | Marginal fit |
| Confidence Interval | 0.088 ; 0.097 | ||
| P Valu | 0.00 | ||
| 3 | ECVI Model | 3.73 | Good fit |
| ECVI Saturated | 1.57 | ||
| ECVI Independence | 85.32 | ||
| Confidence Interval | 3.49 ; 4.00 | ||
| 4 | AIC Model | 1930.84 | Good fit |
| AIC Saturated | 812.00 | ||
| AIC Independence | 44112.56 | ||
| CAIC Model | 2350.84 | ||
| CAIC Saturated | 2943.49 | ||
| CAIC Independence | 44259.56 | ||
| 5 | NFI | 0.96 | Good fit |
| CFI | 0.97 | ||
| NNFI | 0.96 | ||
| IFI | 0.97 | ||
| RFI | 0.95 | ||
| PNFI | 0.83 | ||
| 6 | Critical N | 113.60 | Marginal fit |
| 7 | Standardized RMR | 0.049 | Good fit |
| GFI | 0.80 | ||
| AGFI | 0.76 | ||
| PGFI | 0.65 | ||
Source: Research Results
Test 1: Chi-Square
From the table above, it can be seen that the Chi-Square value is 1783.01, and the degree of freedom is 326. As a rule, a model is considered good if the chi-square value divided by the degree of freedom is less than 6. In this case, the resulting value is 5.47, showing a good fit value.
Test 2: Root Mean Square Error of Approximation (RMSEA)
RMSEA=0.093, representing marginal fit qualification. (RMSEA <0.10 means marginal fit, RMSEA <0.08 means good fit, RMSEA <0.05 means a close fit, and RMSEA> 0.10 means poor fit).
Test 3: ExpectedCrossValidationIndex(ECVI)
a) The ECVI saturated model (1.57) compares the ECVI model (3.73) with the ECVI independence model (85.32).
b) ECVI saturated model is somewhat smaller than the ECVI model and the ECVI independence model is much smaller than the difference or, in other words, the ECVI saturated approach is the ECVI model than the ECVI independence model, and the 90% confidence interval is 3.49; 4.00, then a good match is obtained (around ECVI models).
Test 4: AkaikeInformationCriterion(AIC and Consistent Akaike InformationCriterion (CAIC)
a) The AIC saturated model (812.00) and the AIC model (1930.84) was compared and the AIC independence model (44112.56). The AIC saturated model is somewhat smaller than the AIC model. Smaller values indicate good compatibility; the difference is much greater than the AIC independence model.
b) The AIC saturated model (812.00) and the AIC model (1930.84) was compared and the AIC independence model (44112.56). The AIC saturated model is somewhat smaller than the AIC model. Smaller values indicate good compatibility; the difference is much greater than the AIC independence model.
Test 5: Fit Index
a) Normed Fit Index (NFI)=0.96 (above 0.90) shows good fit.
b) CFI0=0.97 (above 0.90) shows good fit.
c) Tucker Lewis Index or Non-Normed Fit Index (NNFI)=0.96(> 0.90) (above 0.90) shows good fit.
d) Incremental Fit Index (IFI)=0.97 (above 0.90) shows good fit.
e) Relative Fit Index (RFI)=0.95 (above 0.90) shows good fit.
f) Parsimonious Normed Fit Index (PNFI)=0.83(above 0.6), thus proper to be used for comparison of models, showing good compatibility.
Test 6: Critical N
Critical N (CN)=113.60<200; the model does not represent the size of the data sample or marginal fit.
Test 7: Goodness of Fit
a) Root Mean Square Residual (RMSR) is the average residual value generated from the fitting between the variance and covariance matrices of the model and the variance and covariance matrices of the data sample.
b) Standardized RMR (SRMR)=0.049 indicates good fit (below 0.08 indicates good fit).
c) The goodness of Fit Index (GFI)=0.80 indicates good fit (above 0.70 indicates good fit) and Adjusted Goodness of Fit Index (AGFI)=0.76 indicates good fit.
d) Parsimony Goodness of Fit Index (PGFI)=0.65. Above 0.6, it is used for comparison of models. Therefore, it shows adequate compatibility.
From the analysis in Group 1 to Group 7, almost all tests, including Chi-Square, RMSEA, ECVI, AIC and CAIC, Fit Index, and Goodness of fit, showed a good fit. There was a result in the form of a marginal fit on Critical N. From the results of the analysis above, it can be concluded that the suitability of all models has met the requirements. Furthermore, this research produced a path diagram as follows:

Figure 4: Path Diagram - Standardized Solution
Source: Research Result

Figure 5: T-Value Path Diagram
Source: Research Result
Hypothesis Testing
Based on the results of a series of tests which can be seen from the explanation above, concerning hypothesis testing efforts, the results are as follows
| Table 8 Hypothesis Testing |
||||
|---|---|---|---|---|
| Hypothesis | Hypothesis Statement | T-Value | T-Table Value | Description |
| H1 | Attitude towards Behavior has a significant role in the intention to quit smoking | 0.07 | 0.07<1.96 | Data does not support the hypothesis (H1 rejected) |
| H2 | Subjective Norms has a significant role in the intention to quit smoking | -2.16 | |-2.16|>|-1.96| | Data support the hypothesis (H2 accepted) |
| H3 | Perceived behavioral has a significant role in the intention to quit smoking | 8.26 | 8.26>1.96 | Data support the hypothesis (H3 accepted) |
Source: Research Results
Conclusion
The results of the hypothesis testing show that the variables that contribute to the intention to quit smoking are Subjective Norms and Perceived Behavioral Control.
Sulaiman (detikhealth, 2016) stated that smokers in Indonesia cannot quit smoking because 1) there are many advertisements and promotions related to various cigarette products, 2) they can obtain cigarette products everywhere, including from street vendors, and 3) the price of cigarettes is relatively cheap.
Furthermore, Prof. Prabandari from UGM (kompas.com, 2020) stated that there are at least 7 (seven) factors that make it difficult for smokers to quit smoking, namely 1) Cigarettes or tobacco are addictive, 2) The price of cigarettes is affordable, 3) The No Smoking Zone (NSZ) policy is not optimal yet, 4) Lack of understanding of the risks of smoking, 5) The permissive attitude of people who do not smoke to smokers, and 6) Image about images; people are distracted by its "positive" image, which is strengthened by industry-financed advertisements, sponsorships, and numerous programs, and 7) Not all health professionals have come together to reduce the number of smokers.
Considering the description in the three paragraphs above, variables that turned out to be contributive in this study were Subjective Norms and Perceived Behavioral Control. Smokers do not quit smoking because of the rampant advertising about cigarettes and the lack of understanding of the risks. The results of this research can be used as material for consideration in making various advertisements, notices, posters, both manually and digitally, containing the dangers or risks caused by smoking.
It seems that these kinds of advertisements or posters have been found without significant results. In the descriptive analysis of this study, the respondents' answers, in the scope of the variables Subjective Norms and Perceived Behavioral Control, were:
1. I do care about my parents’ advice to quit smoking (saya sangat mempedulikan nasehat orang tua saya untuk berhenti merokok) (MC2)
2. People who smoke can harm the health of others (Orang yang merokok dapat merugikan kesehatan orang lain) (NB1)
3. The advice of the closest person to quit smoking encouraged my desire to quit smoking (Saran orang terdekat untuk berhenti merokok mendorong keinginan saya untuk berhenti merokok) (CB2).
The facts in the description above bring the researchers to conclude that the respondents in this study were more sensitive to their surroundings or the people around them whom they love. For this reason, if we are going to make an advertisement or poster containing a message to invite smokers to quit smoking, the message should be addressed to family members or close friends of the smokers, not directly addressed to the smokers. What can also be done is to involve family members or close friends in the message to quit smoking.
References
- Adhi, I.S. (2020). 7 reasons why people have difficulty quitting smoking. Kompas.com.
- Ajzen, I. (1991). The theory of planned behavior. In organizational behavior and human decision processes. Amhers, MA.
- Ajzen, I. (1988). Attitude, personality, and behavior. Chicago: Dorsey Press.
- Ajzen, I. (2005). Attitudes, personality, and behavior. New York: Open University Press.
- Ajzen, I. (2015). Consumer Attitudes and Behavior. In the theory of planned behavior applied to food consumption decisions, 121-138. Economia Agraria: Rivista .
- Akhira, R. (2016). Factors affecting intention to not smoking in al Hasra Islamic junior high school Depok students in 2016.
- Alam, S.S., & Sayuti, N.Md. (n.d). Applying the Theory of Planned Behavior (TPB) in halal food purchasing. School of Business Management, Faculty of Economics and Business, National University of Malaysia, Darul Ehsan, Malaysia and Faculty of Business Management, Universiti Teknologi MARA, Darul Ehsan, Malaysia.
- Alliance, S.A. (2014). The ASEAN Tobacco Control Report.
- Anggunia, K.R. (2009). The role of attitudes, subjective norms, and Perceived Behavioral Control (PBC) on intentions to quit smoking in smokers of UIN Syarif Hidayatullah students. Jakarta: Faculty of Psychology, UIN Syarif Hidayatullah.
- Anwar, K., Bakar, A., & Harmaini. (2005). The relationship between religious commitment and prosocial intentions of students of the psychology faculty UIN SUSKA Riau. Journal of Psychology, 1, 69-77.
- Arikunto. (2006). Research procedure a practical approach. Jakarta: Rineka Cipta.
- Ayuningtyas, D. (2019). CNBC Indonesia.
- Badan Pusat Statistik Bekasi. (2016). Retrieved from https://bekasikab.bps.go.id/
- Bangkara, B.M.A.S. (2017). Communication model in cross-cultural knowledge share derived from indigenous psychology in Indonesia’s multinational company (Case Study in Japanese MNC in Jababeka-Bekasi-Indonesia), Dissertation, Institut Teknologi Bandung.
- Bagozzi, R. (1982a). Theoretical concepts, measurements, and meaning. In Fornell, C. (Edition), A Second Generation of Multivariate Analysis, 24-38. New York.
- Victoria, H.B. (2012). Explaining intention to stop smoking with the theory of planned behavior and self-exempting beliefs, dissertation. Faculty of the Graduate School at the University of North Carolina at Greensboro.
- Chaplin, J. (2004). Complete dictionary of psychology. In P. R. Persada. Jakarta.
- Detik News. (2018). Retrieved from https://news.detik.com/dw/d-4046369/tiap-semenit-10-orang-meninggal-di-dunia-akibat-rokok
- DetikFinance. (2017). The largest Cikarang industrial area in Southeast Asia.
- Devitarani, L. (n.d.). Intention to quit smoking in smoking students at Padjadjaran University, Jatinangor.
- Djemari, M. (2012). Measurement of educational assessment and evaluation. Yogyakarta : Nuha Medika.
- Reyhan, A.D. (2020). Number of beginner smokers in Indonesia Up 240 Percent! This is the cause. detikHealth.
- Faizah, S.V. (2017). Effect of return on assets. Leverage, Institutional Ownership and Company Size on Tax Avoidance, 5(2). Accounting journal, 138-143.
- Farah, R.A. (2019). The effect of Theory of Planned Behavior (TPB) on intentions to quit smoking in terms of gender differences in emerging adulthood. Thesis, Faculty of Psychology Universitas Airlangga
- Ferdinand, A. (2014). Management research methods: Research Guidelines for Thesis, Thesis and Dissertation. Semarang: Publishing Agency - Undip.
- Fishbein, M., & Ajzen, I. (1975). Belief, attitude, intention and behaviour: An introduction to theory and research, 27.
- Fishbein, M., & Ajzen, I. (1975). Beliefs, attitude, intention and behavior. Reading, MA: Addison Wesley.
- Ghozali, I. &. (2008). Structural equation modeling. Semarang: Universitas Diponegoro.
- Hair (1998). Multivariate Data Analysis, (Fifth Edition). Prentice Hall, Upper Saddle River. New Jersey.
- Joseph, H., Marcelo, G., & Vijay, P. (2014). AMOS Covariance-Based Structural Equation Modelling (CB-SEM): Guidelines to Its application as a marketing research Tool. Brazilian Journal of Marketing.
- Hox, J. (1998). An introduction to structural equation modeling. Family Science Review.
- Indrawati. (2015). Management and business research methods convergence of communication and information technology. Bandung: Aditama.
- John, M. (2000). English Indonesian an English Indonesian Dictionary. Jakarta : PT. Gramedia.
- Karimy, Md., Iraj, Z., Marzieh, A., & Ali, M., (2015). An extended Theory of Planned Behavior (TPB) used to predict smoking behavior among a sample of Iranian Medical Students. Int J High Risk Behav Addict
- Pamomong, K., Pola Asuh Warisan Leluhur Indonesia. (2018). Retrieved from https://sahabatkeluarga.kemdikbud.go.id/laman/index.php?r=tpost/xview&id=5013
- Kemenperin. (2019). Retrieved from kemenperin.go.id: https://kemenperin.go.id/artikel/20467/Industri-Hasil-Tembakau-Serap-5,98-Juta-Tenaga-Kerja
- Kesehatan, K. (2015). Databoks. Retrieved from https://databoks.katadata.co.id/datapublish/2016/08/23/provinsi-mana-dengan-jumlah-perokok-terbanyak
- Kreitner, R. (2000). Organizational behavior (5th edition). Boston: Mc Graw-Hill.
- Kuncoro, M. (2014). Research methods for business & economics (Fourth Edition). Yogyakarta: Erlangga.
- LaMorte-Wayne, W. (2019). Behavioral change model. Boston University School of Public Health.
- Latan, H. (2013d). Multivariate analysis techniques and applications using IBM SPSS 20.0. Bandung: Alfabeta.
- Liputan 6. (2018). Retrieved from liputan6.com: https://www.liputan6.com/global/read/3544429/who-rokok-bunuh-10-orang-per-menit
- Lawrence, N. (2014). Social research methods: Qualitative and quantitative approaches. Pearson New International.
- Prihandini, T.I., & Sunaryo, S. (2011). Structural Equation Modeling (SEM) with Partial Regression Structural Model. National Seminar on Statistics Diponegoro University.
- Ramadiani. (2018). Structural equation model for multivariate analysis using LISREL. Mulawarman Informatics Journal, 1.
- RI, K.K. (2011). Guidelines for the development of non-smoking areas. Jakarta: Promkes.
- Hannah, R., & Max, R. (2019). Smoking, our world in data.
- Riyandi, R. (2018). Ayobandung. Retrieved from Ayobandung.com: https://www.ayobandung.com/read/2018/11/19/40692/jumlah-perokok-di-indonesia-meningkat-setiap-tahun
- Riska, R., Dwi Linna, S., & Zanal, A. (2012). Determinants of success in quitting smoking in students. Journal of Public Health, 8, 1.
- Sanusi, A. (2011). Business research methods. Jakarta: Salemba Empat.
- Sarwono. (2002). Social psychology: Individual and social psychology theories. Jakarta: PT. Balai Pustaka.
- Sekaran, U., & Bougie, R. (2016). Research methods for business: A skill. Haddington: John Wiley & Sons Ltd.
- Statpac Inc. (2011). Retrieved from http://www.statpac.com/surveys/sampling.htm
- Sugiyono. (2009). Educational research methods quantitative. Qualitative, and R&D Approaches. Bandung: Alphabeta.
- Sugiyono. (2017). Quantitative, qualitative, and R&D research methods. Bandung: Alphabeta.
- Sulaiman, Md. (2016). 3 main causes of more smokers in Indonesia: Advertising, Easy and Cheap. detikHealth
- Tempo.co. (2019).
- Winoto, Y.Y., Cahyo, K., & Indraswari, R. (2018). Factors affecting intention to quit smoking in smoking students of SMP X in Semarang City. Journal of Public Health, 6(5).
- World Health Organization. (2020). Retrieved from https://www.who.int/news-room/fact-sheets/detail/tobacco
- Zikmund, W.G., Babin, B.J., Carr, J.C., & Griff. (2010). Business research methods (Eight Edition). Canada: Cengage Learning.