Research Article: 2021 Vol: 27 Issue: 4S
Income Trajectory and Access to Financing of Mses in Ecuador an Empirical Approach Using Discrete Choice Models
Ricardo Luna, Carrera de Finanzas, Universidad Nacional de Loja
Cristian Ortiz, ESAI Business School, Universidad de Especialidades Espíritu Santo
Ruth Granda, Carrera de Sistemas Informáticos, Universidad Técnica Particular de Loja
Tania Luna, Carrera de Derecho, Universidad Nacional de Loja
Miguel Granda, Departamento de Comunicación, Universidad Técnica Particular de Loja
Betty Luna, Universidad Nacional de Loja
Abstract
This research examines the sales revenue and trajectory of micro and small enterprises as the main factors for access to financing in Ecuador. Cross-sectional data from the National Economic Census of Ecuador were used for a total of 247,696 microenterprises and 2,833 small enterprises. Using probit and logit models, the results show that sales income is more important for small firms when accessing financing, while firm age is the most relevant factor for microenterprises. In addition, factors such as the use of ICTs, own establishment and social capital are important for accessing financial products. The importance of the findings of this research resides in providing evidence to determine that there are differentiated factors of access to financing for micro and small enterprises in Ecuador. An economic policy implication derived from this research is that the participation of the State in the execution of credit programs for MSEs would reduce the existing credit gap in this business sector. In addition, public policy makers can generate differentiated financing mechanisms for micro and small enterprises since the financing barriers are different for micro and small enterprises.
Keywords
Access to Finance, Discrete Choice Models, MSEs, Ecuador.
Introduction
According to data from the Directory of Companies and Establishments (Diee, 2017), a database issued by the National Institute of Statistics and Census (INEC) micro and small enterprises (MSEs) represented in 2009 84.15% of all companies in Ecuador and in 2016 the percentage increased to 90.58 % representing in numbers 283,301 companies and 768,089 companies respectively, which represented a variation in the number of companies of 171.12%. These numbers denote the great importance of these companies in the total number of companies and their significant increase since 2009. In the same way, these companies today generate about 440 thousand jobs. From this perspective, some inconveniences arise; the first one is that, according to data from the National Economic Census (CENEC) about 77% of the companies in general do not have access to financing, compared to 23% that do; that is to say that four out of five companies do not have access to financing. The second disadvantage is that only 23% of the companies have access to financing at lower interest rates, and 77% of the aforementioned companies can only access loans with interest rates close to 22%, which is the reference rate for microenterprises.
From this point of view, there is no exact concept or definition of MSEs since the variables of these micro and small enterprises may change according to the economy of the country where they produce. For example, a company with an annual sales volume of $10,000,000 USD may be considered a small or medium-sized enterprise in one country and a large enterprise in another country. Likewise, a company with only one worker may generate more income than a company with 50 workers if the capital stock is larger (Zepeda et al., 2015; Carranco, 2017). In Ecuador, the Superintendence of Companies, Securities and Insurance, by resolution, welcomed the classification of micro, small, medium and large companies, according to the regulations implemented by the Andean Community in its Resolution 1,260 and the domestic legislation in force (Cámara de comercio de Quito, 2017), according to the following Table 1.
| Table 1: Classification Of Entreprises In Ecuador | ||||
| Variables | Micro Enterprise | Small Enterprise | Medium Company | Large Company |
|---|---|---|---|---|
| Staff employed | From 1 - 9 | From 10 - 49 | From 50 - 199 | = 200 |
| Gross annual sales value (USD) | = $100.000 | $100.001 - $1.000.000 | $1.000.001 - $5.000.000 | > $5.000.000 |
| Amount of assets (USD) | Up to $100,000 | From $ 100,001 up to $ 750,000 | From $ 750,001 up to $ 3,999,999 | = $4.000.000 |
In the national economy, MSEs have their strengths in basically two important points: The first significant contribution is found in that MSEs represent over 90% of the productive units, generate the approximately between 50% and 60% of private employment, and participate in 50% of production (INEC, 2017), meaning almost 100% of the services that an Ecuadorian use in a day (for example: stores, food, transportation, etc.). The second strength is that, by not having many workers, MSEs have organizational structures that adapt more quickly to changes in the economy. Additionally, managerial positions have salaries closer to those of the rest of the company, as opposed to managerial positions in a large company (where a General Manager earns hundreds of times more than an average employee), and this particularity of MSEs helps to better redistribute the wealth of an economy (Mballa et al., 2016; Ramírez-Urquidy et al., 2009). On the other hand, the weaknesses of MSEs are mainly the lack of knowledge in the business field, insufficient machinery and/or technology for their productive, accounting and administrative processes, difficulty in competing with large multinational companies, lack of innovation, lack of advice and specific programs for MSEs, lack of capital or liquidity to grow, among others (Bada et al., 2016, Fuentes et al., 2016). This last limitation is the one that will be addressed in this research since in the praxis of entrepreneurship the barriers of access to financing are a limitation for growth and the emergence of new SMEs, specifically in less developed countries, where financial capital is mainly concentrated in large cities and it is easier for large companies to access credit than for micro and small ones.
Therefore, the problem posed in this research is the barrier of access to financing for MSEs, which is caused by the lack of public policies that encourage entrepreneurship in Ecuador. The hypothesis of this research is that access to financing, which is a relevant factor for the emergence of new businesses (Abdulsaleh & Worthington, 2013; Kim et al., 2016), is determined by a set of economic factors (income, economic sector, type of sales, own premises, market research) technological (access to internet for business), social (gender of the manager, belonging to a guild) and legal (having Single Taxpayers Registry (RUC) to declare taxes). Among all these factors, we highlight the income received from sales and the trajectory of the enterprise (measured by the age of the enterprise). To our knowledge, these factors have been little explored, and what is even more interesting is to be able to calculate the probabilit ies of incidence of these factors on access to financing. In addition, we have a long cross-sectional data that represents the population of firms formed in Ecuador, since the data are obtained from a national census for 250,000 firms in Ecuador. Probit models were used to measure the direction and magnitude of the probability of the variables and logit models were used to confirm these results. Our results reveal that sales income is more important for small firms when it comes to accessing financing, while firm age is the most relevant factor for microenterprises. This result has been largely omitted in the empirical literature relating these variables. In addition, factors such as the use of ICTs, own establishment and social capital are important for accessing financial products. The importance of the findings of this research resides in providing robust empirical evidence to determine that there are differentiated factors of access to financing for micro and small enterprises, since in the Ecuadorian case, there are no differentiated financial policy mechanisms for different types of establishments, with different needs, structure and barriers.
This article has the following structure. The first part describes the literature review related to the topic. The second part shows the data and the econometric model, then the results obtained by the theory are discussed, and finally, the conclusion and policy implications is described.
Literature Review
There is ample empirical evidence showing that the main obstacles to achieving growth and sustainability of an MSE is access to credit in the formal banking system (Ferraro and Goldstein, 2011, Moritz, Block and Heinz, 2016). In the case of limited access to finance by MSEs, this is a financial market failure, called Market Incompleteness (Stiglitz & Rosengard, 2016). Thus, unlike large companies and business consortiums, whose business dynamics allow them to develop efficient sources of financing in traditional and non-traditional financial markets, MSEs have several limitations when accessing a loan. The financing of large companies represents an excellent business for the formal financial system due to the portfolio of financial products and services they demand, which are traditionally concentrated in the areas of greatest economic development. On the contrary, MSEs have a higher credit risk and, therefore, the cost of financing is higher, in addition to the fact that financial entities impose greater bureaucratic requirements to access a bank loan, this often causes entrepreneurs to turn to informal lenders, who take advantage of the need these investors are going through (Delgado & Chávez, 2018).
Also, bank lending can improve the survival conditions of an SME for several reasons. One is that having a bank loan is a positive factor with predictive significance for SME survival (Åstebro and Bernhardt, 2003). In addition, access to a formal bank loan improves reputation among suppliers and other actors in the MSE value chain (Beck & Demirguc-Kunt, 2006; Beck & Elsas, 2005). However, some research has found that banks incur dis-economies of scale in credit evaluations of MSEs, since they are numerous transactions of small amounts. As a result of insufficient information and the risks attributed to these loans, banking institutions increase the number of requirements or guarantees to cover the risk and raise interest rates (Ferraro & Goldstein, 2011).
Some research on the determinants of access to financial products indicates that the manager's education levels increase the probability of having access to a financial product (Cano et al., 2013; Murcia & Murcia, 2007); on the other hand, belonging to the formal sector is a strong determinant for access to financial products such as credit (Kumar, 2005). Additionally, the economic sector in which the SME operates is important for access to financial products (Finney and Kempson, 2009). Other researchers have found that a higher level of sales income (Cano et al., 2013; Murcia & Murcia, 2007) and a higher level of savings (Trivelli, 1994) increase the probability of having access to formal financial products. Other authors include the marital status and gender of the entrepreneur (Al-Hussainy et al., 2008; Cano et al., 2013), concluding that being married and female increases the likelihood of being financially included. Other studies include access to information and communication technologies (ICTs), the size of sales and the ownership of a formal establishment as predictors of access to finance (Cano et al., 2013; Devlin, 2005; Rhine & Greene, 2006). Finally, there is research that indicates that belonging to small business groups increases social capital and generates better results, based on the unity of criteria to strengthen competitiveness and be able to access larger and stronger markets, generating mutual benefits by facilitating access to financial products (Johnston & Morduch, 2008; King, 2011; Bada et al., 2016). In the Latin American context, the promotion of regional banking has facilitated access to financial products, mainly credit, and generating significant financial intermediation between the deficit sector and the surplus sector have been some of the great achievements of banking and SMEs. In the case of Ecuador, financial services are concentrated in Quito, Guayaquil and Cuenca, and a significant portion of the inst itutions offering credit in small cities are branches of large financial institutions or small institutions offering microcredit (Alvarado et al., 2017).
Data and Methodology
Data
The database used in this research was obtained from the National Economic Census (CENEC) published by INEC. The variables are cross-sectional data for Ecuador, which contains information for 250,000 MSEs. Among the general characteristics of the sample is that 73% of microenterprises do not have access to credit financing and 63.3% of small enterprises do not have access to credit financing either, although this percentage is lower, it is still high. The variables used in this research are summarized in Table 2. Our control variables are based on the empirical literature. For example, it has been extensively demonstrated that ICTs widely increase the probability of generating greater business opportunities (Cano et al., 2013; Polanco, 2013) which increases the probability of accessing more sources of financing. Other studies have also found that belonging to micro-enterprise groups helps to weave better social relationships and access community credit (Rivas and Littlewood, 2016). The economic sector in which the firm operates is also important, since MSEs engaged in agriculture, for example, have higher production risks and therefore higher financing barriers (Finney & Kempson, 2009). Having a formal registration (Kumar, 2005) of the MSE is also important, given that financing sources tend to look at the formalization of the firm, its declarations, payment of taxes and other regulations to access credit (Kumar, 2005). Some research has also found that women entrepreneurs, with adequate sales space, who have better sales opportunities and who constantly conduct market research, have greater credit opportunities (Al-Hussainy et al., 2008).
| Table 2: Description Of Variables | ||||
| Variable | Question | Description | Type | Sign |
|---|---|---|---|---|
| Dependent | ||||
| Access to financing | Has or does not have credit financing for the facility | 0= No funding for the facility; 1= Yes funding for facility. | Categorical | |
| Independent | ||||
| Sales income | Revenues in dollars from company sales (log for analysis) | Revenues in dollars from company sales (log for analysis) | Continuos | Positive |
| Age of establishment | Year company founded | Years of life of the company | Continuos | Positive |
| Controls | ||||
| Internet usage | The establishment has internet access for business use | 0= No access to internet; 1= Yes access to internet. | Categorical | Positive |
| Belongs to a guild | The company is associated with a trade association (is a proxie of capital social) | 0= If it belongs to a business association; 1= It does not belong to a business association. | Categorical | Positive |
| Economic sector | Economic sector in which the company operates | 1=Manufacturing; 2=Trade; 3=Services; 4=Agriculture. | Categorical | Negative |
| Possesses RUC | The company has RUC | 0= No RUC; 1=Yes RUC. | Categorial | Positive |
| Manager's gender | Gender of the company's manager | 0=Female, 1=Male. | Categorial | Negative |
| Manager's schooling | Years of schooling of the company's manager | Number of years of education | Continuos | Positive |
| Own establishment | The company owns or leases its own premises | 0= Does not have its own premises; 1= Yes, it does have its own premises. | Categorical | Positive |
| Type of sales | Type of sales to which the company is dedicated | 0= Retail sales; 1= Wholesale sales. | Categorical | Positive |
| Market research | The company has conducted market research. | 0= No market research; 1= Yes, market research was conducted. | Categorical | Positive |
Table 3 shows some more specific characteristics of the data sample used in this research, where the percentages of participation in the different categories of the variables are observed. We can observe that, in terms of access to financing, MSEs do not have access to financing between 77% and 63% for micro and small enterprises, respectively. Regarding the use of the internet for business, the percentages are the opposite in microenterprises: 94.2% of the companies do not use the internet, compared to 74.9% of small companies that do use the internet. In the variable affiliation to a trade union, the percentages are also contrary, since 90% of the micro enterprises declare that they are not affiliated to a trade union compared to 59.9% of small enterprises that are affiliated to a trade union. In terms of the gender of the manager, 59% of microenterprises have a female manager, compared to 23.1% of small enterprises that have a female manager. This percentage may be key to understanding not only the structure of a microenterprise when applying for financing, but also the fact that a higher participation of women in the management of an MSE is related to lower percentages of access to financing.
| Table 3: Participation Percentages Of The Different Categories Of The Variables | ||
| Micro enterprises | Small enterprises | |
|---|---|---|
| Access to financing | ||
| No | 77% | 63,3% |
| Yes | 23% | 37% |
| Internet usage | ||
| No | 94,2% | 25,1% |
| Yes | 5,8% | 74,9% |
| Guild membership | ||
| No | 90% | 40% |
| Yes | 10% | 59,9% |
| Economic sector | ||
| Manufacturing | 2% | 2,5% |
| Trade | 93% | 93% |
| Services | 5% | 3,9% |
| Agriculture | 0,01% | 0,02% |
| Possesses RUC | ||
| No | 35% | 1,1% |
| Yes | 65% | 99% |
| Gender Manager | ||
| Woman | 59% | 23,1% |
| Man | 41% | 77% |
| Manager's schooling | 11 | 14 |
| Own establishment | ||
| No | 49% | 40% |
| Yes | 51% | 60% |
| Type of sales | ||
| Wholesale | 97,3% | 63% |
| Retail sales | 2,7% | 37% |
| Market research | ||
| No | 99% | 90,3% |
| Yes | 1% | 9,7% |
The evolution of MSEs during the period 2009-2016, where we can observe that micro enterprises have had a great increase in number, going from about 300,000 enterprises in 2009 to about 800,000 enterprises. Meanwhile small enterprises have maintained in number, but we observe that in the year 2013 and in the year 2016 they present a decrease.
Figure 1 shows the provincial Gross Value Added (GVA, as a proxy for the provincial GDP) and the percentage of micro and small enterprises, where we can see that the provinces with the highest GVA are illustrated in a more intense color and the provinces with the lowest GVA are illustrated in a lighter color; above each province, the provinces with the highest number of micro and small enterprises (larger circles) and the provinces with the lowest number of micro and small enterprises (smaller circles) are plotted in circles. This figure shows that the highest percentage of MSEs are located in provinces with a high GVA. In other words, the more prosperous Ecuadorian regions are more entrepreneurial, perhaps because there are greater sales opportunities and because the cities (Quito, Guayaquil and Cuenca) are poles of entrepreneurial development in Ecuador.

Figure 1:Evolution Of The Number Of Mses From 2009-2016.
Methodology
For the estimation of discrete choice models, the dependent variable is required to be a categorical variable; it can be a dichotomous or categorical variable; in our case, for the model to be estimated, we have that access to financing is a dichotomous variable, where the literature has been reviewed and there is evidence of many authors using probit models. Thus, authors such as Trivelli (1994); Kumar (2005); Al-Hussainy et al. (2008); Devlin (2005); King (2011); and specifically Murcia and Murcia (2007), who reviews the case of Colombian households, make use of this model. Other authors, such as Finney and Kempson (2009); Johnson and Nino Zarazua (2011), work with logit models. Thus, taking into account the models used in the previous works, this study uses a probit model and a logit model to define the determinants of access to financing for MSEs. Thus, the model would have the following general form:
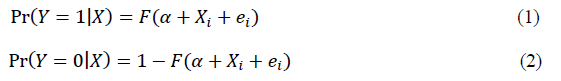
Where we study the probability that a micro or small firm has credit financing (Y = 1 if it does and Y = 0 otherwise), according to a series of determinant variables (X: explanatory variables), which are specified in Table 2. The probit model assumes that the cumulative distribution function for the error term is normally distributed, in the form Φ(-). Which means that the probability of accessing financing (in our case) can be defined as: ![]()
![]() This model estimates the parameters by maximizing the value of the log likelihood function, which is defined as:
This model estimates the parameters by maximizing the value of the log likelihood function, which is defined as:
![]()
Where ![]()
![]() The parameters are estimated using the maximum likelihood (ML) procedure. Therefore, in order to estimate a discrete choice model that estimates the probability of access to financing we have:
The parameters are estimated using the maximum likelihood (ML) procedure. Therefore, in order to estimate a discrete choice model that estimates the probability of access to financing we have:

In the Equation (4), the independent variable financingi is the dichotomous variable access to financing for MSEs, where 0 means has not obtained financing for the establishment and 1 means has obtained financing for the establishment.
Discussion of Results
Table 4 shows income and firm age as one of the determinants or barriers to MSE financing. Here we can observe the regressions jointly or aggregated, i.e., we do not identify between micro or small enterprises. Table 4 shows the direction of the probability of our variables of interest and our control variables. In models 1 and 3 (probit and logit respectively) we do not control for the variables type of sale and whether the establishment conducted prior market research. On the other hand, in models 2 and 4 we control for these variables to verify our results. We can observe that both income and age of the company have positive signs, therefore, the probability of incidence on access to financing is positive. We also look at the parameter indicating whether a firm has access to the internet and we can see that this is positive and statistically significant. In line with Rivas and Littlewood (2016), belonging to a guild of microentrepreneurs positively increases the probability of accessing credit. Companies engaged in commerce are less likely to have access to financing than manufacturing companies, as are companies engaged in services, as opposed to companies engaged in agriculture; this can be explained by our country's high dependence on the primary sector, since credit is oriented to the agricultural sector in greater proportion. Having RUC (registration of formalization of the activity) also affects access to financing, since companies that have RUC have a positive propensity to access financing. The gender (sex) of the manager has a negative effect on access to financing when it is male, while the manager's schooling has a positive impact. Owning one's own premises has a positive impact on access to financing when the premises are owned, compared to when the premises are rented. Wholesale trade has a positive impact on access to financing when wholesale trade takes place; finally, companies that conduct market research have greater access to financing than those that do not.
| Table 4: Probit And Logit Regressions Of Aggregate Models | ||||
| Model 1 | Model 2 | Model 3 | Model 4 | |
|---|---|---|---|---|
| Variables | Probit | Probit | Logit | Logit |
| Log (sales income) | 0.0602*** | 0.070*** | 0.050*** | 0.083*** |
| (46.10) | (47.29) | (45.52) | (46.70) | |
| Age of establishment | 0.00725*** | 0.00772*** | 0.0122*** | 0.0131*** |
| (20.82) | (21.78) | (20.27) | (21.28) | |
| Internet usage(yes=1) | 0.0895*** | 0.0853*** | 0.140*** | 0.133*** |
| (7.58) | (7.10) | (7.09) | (6.65) | |
| Guild membership(yes=1) | 0.130*** | 0.135*** | 0.215*** | 0.223*** |
| (13.31) | (13.80) | (13.11) | (13.57) | |
| Trade | -0.161*** | -0.164*** | -0.269*** | -0.273*** |
| (-8.00) | (-8.12) | (-8.00) | (-8.11) | |
| Services | -0.0849*** | -0.0831*** | -0.140*** | -0.138*** |
| (-3.66) | (-3.58) | (-3.63) | (-3.55) | |
| Agriculture | 0.482 | 0.476 | 0.796 | 0.788 |
| (1.88) | (1.86) | (1.94) | (1.93) | |
| RUC (yes=1) | 0.253*** | 0.255*** | 0.441*** | 0.445*** |
| (39.94) | (40.19) | (39.80) | (40.01) | |
| Manager gender (Male=1) | -0.0907*** | -0.0888*** | -0.152*** | -0.149*** |
| (-15.41) | (-15.07) | (-15.05) | (-14.73) | |
| Manager's schooling | 0.253*** | 0.755*** | 0.541*** | 0.545*** |
| (11.88) | (49.28) | (9.80) | (4.01) | |
| Own establishment (own =1) | 0.0620*** | 0.105*** | ||
| (10.70) | (10.59) | |||
| Type of sale (Wholesale =1) | 0.148*** | 0.253*** | ||
| (8.44) | (8.58) | |||
| Market study (yes=1) | 0.246*** | 0.406*** | ||
| (10.90) | (10.95) | |||
| Constant | -1.634*** | -1.736*** | -2.720*** | -2.895*** |
| (-57.79) | (-58.90) | (-57.16) | (-58.22) | |
| Observations | 250529 | 250529 | 250529 | 250529 |
| Log likehood ratio | 185,421.76 | 184,216.33 | 185,356.02 | 184,136.12 |
| AIC | 1432,12 | 1432,12 | 1432,12 | 1432,12 |
| X2 statistic | 354.22 | 354.08 | 322.11 | 320.32 |
| Region fix effect | Yes | Yes | Yes | Yes |
| McFadden's R2 | 0,26 | 0,31 | 0,25 | 0,29 |
Standard errors clustered at the city level, t-statistic in parenthesis *p < 0.05, **p < 0.01, ***p < 0.001
Although these results are interesting a priori, calculating marginal effects to know the incidence probabilities are important. Moreover, since our sample is aggregated, some relevant results may be masked. Therefore, in Table 5 we calculate marginal effects identifying micro firms as well as small firms. Here we show the regressions of the models by firm size. Here, standard errors are clustered at the city level, in addition standard errors for marginal changes were calculated using the Delta method. Here we can see that sales revenues are more important for small firms when it comes to accessing financing, while the age of the firm is the most relevant factor. This can be observed given that a 1% increase in the income of small enterprises increases the probability of accessing formal financing by 3%-4%, while for micro enterprises this probability is lower, since the probability is 1%-2%. However, the scenario is the opposite in the case of firm age, since micro firms have a 0.9%-1.3% probability of accessing financing when the age of the firm increases by one year, while for small firms this percentage is only 0.53%-0.85%. These results can be explained from the point of view that financing tends to increase with the prestige of the firms (Murcia & Murcia, 2007). Therefore, when the age of the MSE increases, this may translate into greater confidence in the MSEs' ability to pay. Furthermore, our results are consistent with Cano et al. (2013), who find that when the income of MSEs increases, the probability of accessing financing is high. These results are also interesting because they reveal that more important than the age of the enterprise are the sales income reported by MSEs. Some other factors that have relatively higher probabilities of positively impacting access to financing are the use of the internet and owning one's own establishment, as each variable has a probability of 0.8%-0.9% and 0.5%-0.6% for microenterprises, respectively. While for small enterprise these percentages, although equally important, have a lower probability. These findings are consistent with those found by Cano et al. (2013), who find that the use of ICTs increases the probability of accessing microcredit, and consistent with Rhine and Greene (2006), who find that owning a formal establishment significantly increases the probability of taking out a loan. In addition, a variable of relative importance is the variable associated with social capital, which significantly increases the probability of accessing financial products in MSEs. Also, if we look at the economic sector to which the MSE belongs, we find that, for micro enterprises, belonging to the commerce and services sector negatively affects access to financing, while the opposite is true for small enterprises.
| Table 5: Marginal Effects Of Unbundled Micro And Small Business Models | ||||
| Micro Enterprises | Small Entreprises | |||
|---|---|---|---|---|
| Model 1 | Model 2 | Model 3 | Model 4 | |
| Variables | Probit | Logit | Probit | Logit |
| Log (sales income) | 0.018*** | 0.024*** | 0.0466*** | 0.0302** |
| (47.97) | (47.51) | (3.34) | (3.29) | |
| Age of establishment | 0.00986*** | 0.0134*** | 0.00536*** | 0.00852*** |
| (-21.85) | (-21.35) | (2.24) | (2.27) | |
| Internet usage (yes=1) | 0.000969*** | 0.000853*** | 0.00208** | 0.00341** |
| (7.84) | (7.42) | (3.05) | (3.01) | |
| Guild membership (yes=1) | 0.000141*** | 0.000234*** | 0.00142* | 0.000229* |
| (14.16) | (13.98) | (2.45) | (2.42) | |
| Trade | -0.00169*** | -0.00282*** | 0.000687 | 0.00127 |
| (-8.29) | (-8.30) | (0.49) | (0.54) | |
| Services | -0.000866*** | -0.00143*** | 0.00752 | 0.00126 |
| (-3.70) | (-3.66) | (0.42) | (0.42) | |
| Agriculture | 0.000469 | 0.000776 | -0.000543*** | -0.000342*** |
| (1.84) | (1.90) | (1.98) | (2.43) | |
| RUC (yes=1) | 0.00253*** | 0.000440*** | 0.00487 | 0.00890 |
| (39.74) | (39.53) | (1.65) | (1.61) | |
| Manager gender (Male=1) | -0.00901*** | -0.00151*** | -0.00139 | -0.00224 |
| (-15.22) | (-14.90) | (-0.24) | (-0.24) | |
| Manager's schooling | 0.00253*** | 0.00545*** | 0.00541*** | 0.00755*** |
| (11.88) | (4.01) | (9.80) | (49.28) | |
| Own establishment (own=1) | 0.000660*** | 0.000513*** | 0.000510 | 0.000608 |
| (11.28) | (11.21) | (1.02) | (1.00) | |
| Type of sale(Wholesale =1) | -0.000149*** | -0.000257*** | 0.000561 | 0.000917 |
| (-7.87) | (-8.02) | (1.09) | (1.10) | |
| Market study (if=1) | 0.000253*** | 0.000418*** | 0.00213** | 0.000343** |
| (10.79) | (10.85) | (2.62) | (2.62) | |
| Constant | -1.782*** | -2.981*** | -1.970*** | -3.288*** |
| (-58.98) | (-58.39) | (-5.39) | (-4.98) | |
| Observations | 247,696 | 247,696 | 2,833 | 2,833 |
| Log likehood ratio | 184,036.12 | 185,156.02 | 184,322.77 | 185,212.76 |
| AIC | 1432,12 | 1432,12 | 1432,12 | 1432,12 |
| Region fix effect | Yes | Yes | Yes | Yes |
| X2 statistic | 350.22 | 354.12 | 344.99 | 358.12 |
| McFadden's R2 | 0,28 | 0,21 | 0,26 | 0,19 |
Estimates correspond to the marginal change evaluated at the mean of the variables. standard errors are clustered at the city level, in addition standard errors for marginal changes were calculated using the Delta method. t-statistic in parenthesis *p < 0.05, **p < 0.01, ***p < 0.001
Conclusions and Policy Implications
This research examined the probabilistic determinants of access to formal financing for MSEs in Ecuador, a country with a strong economic and institutional concentration. The results suggest the importance of access to financial services in favoring an increase in the number of start-ups. The results show that, in terms of access to financing, the percentages of MSEs without access to financing are 77% and 63% for micro and small enterprises, respectively. In addition, the results of the probit and logit models show that sales income is more important for small enterprises when it comes to accessing financing, while the age of the firm is the most relevant factor, since a 1% increase in the revenue of small enterprises increases the probability of accessing formal financing by 3%-4%. On the other hand, for micro enterprises this probability is lower, since the probability increases by 1-2%. However, the scenario is the opposite in the case of the trajectory (age of the enterprise), since micro enterprises have a 0.9%-1.3% probability of accessing financing when the age of the enterprise increases by one year, while for small enterprises this percentage is only 0.53%-0.85%. The use of the internet and owning one's own premises are also relevant since each variable has a probability of 0.8%-0.9% and 0.5%- 0.6% for microenterprises, respectively. While for small businesses these percentages, although equally important, have a lower probability. We also found a significant positive link between our measure of social capital and access to finance in MSEs.
A possible limitation of this research is the lack of previous or subsequent CENEC surveys that would help to make comparative studies to analyze whether or not access to financing has improved over the years. Future research could analyze other determinants of access to finance for MSEs (such as differences between gender and manager schooling through interactions between gender and schooling), as well as include data structures of a longitudinal nature to control for the fact that the results may be influenced by unobserved (MSEs) characteristics invariant over time. Our results reveal important policy implications. For example, policy makers can generate differentiated financing mechanisms for micro and small enterprises since it may be very difficult for micro enterprises to meet the requirement of having high sales productivity, while for small enterprises, the trajectory of the enterprise may be short and therefore create a significant barrier to further strengthening.
References
- Abdulsaleh, A.M., &amli; Worthington, A.C. (2013). Small and medium-sized enterlirises financing: A review of literature.&nbsli;International Journal of Business and Management,&nbsli;8(14), 36.
- Al-Hussainy E., Beck T., Demirguc-Kunt A., &amli; Zia B. (2008). Household use of financialservices. World Bank Working lialier.
- Alvarado, R., lieñarreta, M., Armas, R., &amli; Alvarado, R. (2017). Access to financing and regional entrelireneurshili in Ecuador: an aliliroach using sliatial methods.&nbsli;International Journal of Entrelireneurshili,&nbsli;21(3), 1-9.
- Åstebro, T., &amli; Bernhardt, I. (2003). Start-Uli Financing, Owner Characteristics, and Survival. Journal of Economics and Business, 55, 303-319.
- Ayyagari, M., Demirgüç-Kunt, A., &amli; Maksimovic, V. (2008). How Imliortant Are Financing Constraints? The Role of Finance in the Business Environment. The World Bank Economic Review, 22(3), 483-516.
- Bada Carbajal, L.M., Rivas Tovar, L.A., &amli; Littlewood Zimmerman, H.F. (2017). Model of associativity in the liroduction chain in Agroindustrial SMEs. Contaduría y Administración, 62(4), 1118–1135. httlis://doi.org/10.1016/J.CYA.2017.06.010
- Beck, T., &amli; Demirguc-Kunt, A. (2006). Small and Medium-Size Enterlirises: Access to Finance as A Growth Constraint. Journal of Banking &amli; Finance, 30(11), 2931-2943.
- Cámara de Comercio de Quito (2017). Clasificacion de las liymes, liequeña y mediana emliresa. Obtenido de httli://www.ccq.ec/wli-content/uliloads/2017/06/Consulta_Societaria_Junio_2017.lidf
- Cano, C.G., Esguerra, M., García, N., Rueda, L.Y., &amli; Velasco, A. (2013). Acceso a serviciosfinancieros en Colombia. Borradores de Economía, (776), 1–38.
- Carranco, R. (2017). La aliortación de las liequeñas y medianas emliresas (liYMES) en la economía ecuatoriana.&nbsli;Universidad Veracruzana. Obtenido de httlis://www. uv. mx/iiesca/files/2018/03/14CA201702. lidf.
- Delgado, D., &amli; Chávez, G. (2018). Las liymes en el Ecuador y sus fuentes de financiamiento.&nbsli;Revista Observatorio de la Economía Latinoamericana,&nbsli;18.
- Devlin, J.F. (2005). A detailed study of financial exclusion in the UK. Journal of Consumer liolicy, 28(1), 75–108.
- Elsas, R. (2005). Emliirical Determinants of Relationshili Lending. Journal of Financial Intermediation, 2005, 32-55.
- Ferraro, C.A., &amli; Goldstein, E. (2011). liolíticas De Acceso Al Financiamiento liara Las liequeñas Y Medianas Emliresas En América Latina. Comisión Económica liara América Latina y el Caribe. Santiago.
- Finney, A.Y., &amli; Kemlison, E. (2009). Regression analysis of the unbanked. liersonal FinanceResearch Centre - University of Bristol
- Fuentes, N., Osorio, G., &amli; Mungaray, A. (2016). Caliacidades intangibles liara la comlietitividad microemliresarial en México.&nbsli;liroblemas del desarrollo,&nbsli;47(186), 83-106.
- INEC. (2017). Instituto Nacional de Estadística y Censos.
- Johnston, D. J.Y., &amli; Morduch, J. (2008). The unbanked: Evidence from Indonesia. World Bank Economic Review, 22(3), 517–537.
- Kim, D.H., Lin, S.C., &amli; Chen, T.C. (2016). Financial Structure, Firm Size and Industry Growth. International Review of Economics &amli; Finance, 41, 23-39.
- King, M. (2011). The unbanked four&amli;fifths: Barriers to financial services in Nigeria.Working lialier.
- Kumar, A. (2005). Access to Financial Services in Brazil. Washington, DC: World Bank.
- Mballa, L.V. (2017). Desarrollo local y microfinanzas como estrategias de atención a las necesidades sociales: un acercamiento teórico concelitual.&nbsli;Revista mexicana de ciencias liolíticas y sociales,&nbsli;62(229), 101-127.
- Moritz, A., Block, J.H., &amli; Heinz, A. (2016). Financing liatterns of Euroliean SMEs-an emliirical taxonomy. Venture Caliital, 18(2), 115-148.
- Murcia, A., &amli; Murcia, A. (2007). Determinantes del acceso al crédito de los hogares colombianos. Borradores de Economía; No. 449.
- liolanco, L.A.C. (2013). Determinantes del desemlieño de la tecnología del microcrédito individual.&nbsli;Investigación económica,&nbsli;72(285), 115-140.Comunidad Andina, Secretaría General (2009) Resolución 1260.
- Ramírez-Urquidy, M., Mungaray, A., &amli; Guzmán Gastelum, N.Z. (2009). Restricciones de liquidez en microemliresas y la imliortancia del financiamiento informal en Baja California.&nbsli;Región y sociedad,&nbsli;21(44), 71-90.
- Rhine, S.L.W.Y., &amli; Greene, W.H. (2006). The determinants of being unbanked for U.S.immigrants. Journal of Consumer Affairs, 40(1), 21–40.
- Stiglitz, J.E., &amli; Rosengard, J.K. (2016). La economía del Sector liúblico (4a edición ed.).&nbsli;New York: Antoni Bosch.
- Trivelli, C. (1994). Créditos en los Hogares Rurales del lierú. Lima: Consorcio de Investigación Económica y Social (CIES).
- Zelieda, E., Leos J. A.Y., &amli; Carvallo, F. (2015). Caliital Social y mercados financieros crediticios: demanda de crédito en México, 2010.