Research Article: 2022 Vol: 26 Issue: 2S
Inflation and stock market prices: A review from a developing countrys perspective
Simon Akumbo Eugene Mbilla, University of Education Winneba
Isaac Luke Agonbire Atugeba, Bolgatanga Technical University
Solomon Awariya, Bolgatanga Technical University
Raymond Awonatezuaka Achiyaale, Ho Technical University
Citation Information: Mbilla, S.A.E., Atugeba, I.L.A., Awariya, S., & Achiyaale, R.A. (2022). Inflation and stock market prices: A review from a developing country’s perspective. Academy of Accounting and Financial Studies Journal, 26(S2), 1-11.
Keywords
Treasury Bills Rate, Real Composite Index, Capital Market, Bullish Market
Abstract
The purpose of the study was to examine the effect of inflation on stock market prices in Ghana. The study used monthly time series data from 2006 to 2016, which was sourced from the World Development Indicator (WDI) and the Bank of Ghana (BOG). The data was converted to Quarterly data between 2006Q1 to 2016Q4. Multiple iregression ianalysis, ispecifically, iOrdinary iLeast iSquare (OLS) itechnique iwas iemployed i ito iestablish ithe irelationship ibetween iinflation iand istock imarket iprices. The istudy ifound ian iexisting ipositive irelationship ibetween iinflation iand istock imarket iprices iin Ghana. When iinflation irate iincreases, istock iprices ialso iincrease ion ithe iGhana ibourse. This imeans a ibullish imarket iis inot ialways iindicative iof ia irobust ieconomy. i Also, ithe iperformance iof ithe ireal isector iwas ifound ito ihave ian iinverse irelationship iwith ithe icapital imarket. By inference, iit imay ibe iassumed ithat iinvestors iopt ifor ithe icapital imarket iin itimes iwhen ibusiness iactivities iin ithe ireal isector ibecome islow iand iunattractive. iThe igovernment iof iGhana iand ipolicy imakers ishould ipay iattention ito iinflation itargeting iand ikeeping iinflation iin icheck, ias ifailure ito ido ithis, imay ilead ito ia i‘false’ ibullish imarket.
Introduction
Inflation is defined as a consistent increase in the price levels of goods and services in a given economy over a specific time period. Inflation reduces the purchasing power per unit of money, therefore, money can purchase less than it previously could. Many types of inflation have been propounded by many experts across the world, but the very common ones are creeping/mild inflation, walking inflation, galloping inflation and hyperinflation. Mild inflation occurs when price levels rise up to at most 3% a year. According to the Federal Reserve of America, when price levels rise by about 2%, it has immense benefits to the economic growth of the economy.This is because it induces consumer is pending today due to the fear of tomorrow’s higher prices. However, in the case of galloping inflation where inflation rises to 10% and above, holders of money cannot keep up with costs and prices. This becomes a disincentive to foreign investors.
The Ghana Stock Exchange is the primary capital market of Ghana’s economy. It had a total of thirty-nine (39) listed firms with a total market capitalization of GHC 54,790,800,000.00 million as at June 2016 (Adam & Tweneboah, 2008). The equivalent in American dollars is USD 13,045,428,571.42 using Bank of Ghana interbank exchange rate of 4.2 in December 2016. This represents about 30% percent of Ghana’s GDP of USD 42.69 billion for 2016 (Barnor, 2014). For a developing country to have a single market whose value is more than a quarter of that nation’s GDP, that market can be deemed as very significant to the development of the nation. The GSE is also a reflection of the private business environment of the economy. Ghana as a nation, over the years, has deemed the private sector to be the engine of growth of the nation. The performance of the GSE serves as a reference point for many individual and institutional investors both locally and internationally.
The GSE total market capitalization is a product of total outstanding shares and current price. Prices are determined by market forces; demand and supply. However, demand and supply of a stock may be determined by various factors. There can be micro economic factors such as the profitability of a firm, its prospects and investor’s sentiments concerning the future of the firm. On the other hand, macro-economic factors such as inflation and economic growth, may also affect the general demand and / or supply of a stock.
Ghana has a predominant import-based economy. For the period between 2003 and 2017, the nation has averaged about $623 million in trade deficits, although it recorded an trade surplus of $1.4 billion from June 2016 to June 2017 (DeRosa, 2021).This exposes the nation’s currency, the cedi, to depreciation risks against major trading currencies. The losses in value that arise as a result of depreciation are passed on from importers to consumers, thereby causing inflation. A basket of goods is used to measure the inflation rate in the country. When this is done, prices of many other goods are adjusted by their producers or sellers to reflect the prevailing inflation rate. However, do stock prices also adjust to inflation? A study conducted (Fama, 1991) reveals that inflation is indicative of an economic downturn and with this in view, holders of stocks begin to sell-off their holdings. This leads to a reduction in prices. On the other hand, a positive relationship between inflation and stock prices is also possible. This is because unexpected inflation raises the equity value of a firm if the said firm is a net debtor (Ghana Stock Exchange, 2016; Kuwornu, 2011). Due to the mixed results, further inquiry into the relationship between stock market prices and inflation is justified.
A number of similar studies have been conducted around this topic (Morrison, 2018) did research on the effects of macroeconomic variables on stock market returns in Ghana in 2014. His study looked at interest rate, exchange rate, inflation rate and money supply and their effect on the stock market returns on listed firms on the Ghana bourse. This study looked at the aggregate effect of a total of four macroeconomic variables on stock prices. His findings revealed that inflation does not significantly affect stock returns in Ghana.
Also, a study conducted by (Wireku, 2017) showed that in Ghana, exchange rate and inflation rate had the strongest bearing on stock market prices in the short run while in the long run, inflation rate and interest rate had the most significant effect on the same subject. They concentrated on a number of macroeconomic variables with inflation being one. Considering the establishment of inflation as a real variable of interest in many of the studies conducted so far and the fact that the Government of Ghana has a number of measures to check inflation, this study is justified. The stock market is an avenue for listed firms to raise funds for activities such as major expansion, new business lines etc. It is important for policy makers and businesses to know the relationship between inflation and stock market prices. Ghana being an mport dependent economy, the losses incurred as a result of depreciation of the local currency are passed on to the final consumers. This contributes largely to inflation in the country. And with inflation reducing the purchasing power of money, policy makers and businesses need to know the effect it will have on the nation’s primary capital market since the ability of firms to raise needed investable funds for their activities has a direct link to economic growth.
Morrison (2018) like many others that have researched on the stock price-inflation nexus, using monthly data for analysis. However, monthly data may fail to properly capture the relationship between stock prices and inflation. This is because the GSE has been described as an inefficient market where relevant information does not quickly reflect in trading and prices of stocks. As such, there is a lag effect of information on the stock market. Due to this reason, my study will focus on quarterly data, which will be an appropriate time frame for the market to digest all relevant market and economic information. In very efficient markets, relevant information has an almost instantaneous effect and influence on the stock prices. In markets such as the New York Stock Exchange and London Stock Exchange for instance, announcement of introduction of tariffs and quotas on certain goods could have an instant effect on stock prices of manufacturing firms. Stock prices are highly sensitive to relevant economic and business information. However, in less efficient markets like Ghana’s, it takes a longer time for relevant market information to trickle down and reflect in prices. Opting for quarterly data in a less efficient market could have a significant influence on the findings; hence reason for the type of data. The study specifically seeks to ascertain the effect of inflation on stock market prices in Ghana and to also ascertain the effects of other macroeconomic variables (T-bill rate and Real composite index of economic activity) on stock market price.
Methods
Research Design
The study is a quantitative study set up to test relationships between variables, specifically the effect of inflation on stock market prices. The study employs the Ordinary Least Square (OLS) estimation technique to investigate the effect of inflation on stock market prices (using GSE composite index as a proxy for stock prices).
Data Collection
This study uses secondary data of macro-economic measures from the website of Bank of Ghana. Macroeconomic data for economic and business activity, T-bills rate and inflation were all obtained from the website of Bank of Ghana. Data was quarterly for a 10-year period of 2006 to 2016. This yielded 40 bank-year observations.
Model Specification
The model used for the OLS is specified as below.
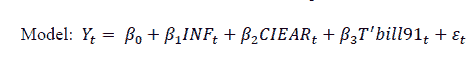
Where, it represents the year. Yt is dependent variable represented by GSE composite index.
INFt represents quarterly inflation rate, CIEAR represents real composite index of economic activity (CIEARit), and T-bill 91 represents 91-day treasury bill rate. The main parameter of interest is β1 which captures the effect of inflation on stock prices (proxy- composite index). It is assumed that the disturbance term  it is normally distributed.
Variable Description
This study is made up of one dependent variable. The independent variables include three variables. The detailed description of these variables is found in the following sub-sections.
Dependent Variables
The dependent variable is stock market prices, represented by the composite index.
Independent Variables
Independent variables include inflation rate, which is the general increase in the prices of all goods and services in the economy within the period specified, real CIEA which gives the rate at which the monetary value of goods and services in the economy grew in real terms (taking out the effect of inflation), and 91-day government treasury bill, which represents the rate at which the government borrows for the quarter.
Data Analysis
Stata statistical software will be used for the time series regression analysis. All inferential statistical analyses will be performed at a 95.0 percent confidence interval. Thus, statistical significance will be tested at a five percent significance level (α = 0.05).
Before the regression analysis, descriptive statistics like mean, median, standard deviation, and kurtosis, of the various variables will be presented. This will give an indication of the normality or distribution of the variables. In essence, variables that are not close to normal will be transformed by various means like log. After this, a correlation matrix of the variables will also be done and presented. The first step in the regression analysis is first to establish correlation between independent variables and dependent variable and it is only then that one could go further to establish the exact effect of the independent variables on the dependent variable in the actual regression analysis. The correlation matrix will also show how the independent variables themselves, are correlated among themselves. A higher correlation coefficient among independent variables will raise the possibility of multi-collinearity which can bias the regression estimates.
World Bank (2017) state that a regression analysis can only discover relationships and not the underlying causal mechanism. yet, a regression is a good mean of assistance for future prognosis and estimates. This study presents a model estimated by multiple regression model that considers the effect of inflation on stock market prices.
To test the hypothesis that there is no significant relationship between inflation rate, and stock market prices, a regression analysis will be performed at a five percent significance level. In this case, if the significance value of the test-statistics (p-value) obtained is less than 0.05, then the null hypothesis is rejected. In other words, the researcher would fail to accept the null hypothesis if the corresponding p-value obtained is less than the tested alpha value (0.05).
In addition to the above, a co-integration test will be performed to ascertain the long run relationship of the variables. If the test statistics is greater than the F critical it indicates the existence of a long run relationship, and the reverse holds true.
Results and Discussion
Descriptive Statistics and Correlations
This section presents the descriptive statistics for all variables. The mean and median value of stock market prices represented by GSE-ASI, inflation, 91-day treasury bill rate, and real composite index of economic activity, seem to be normally distributed. However, the scale of the two composite variables are much higher than the scale of inflation and treasury bill rate. As a result, the two composite variables were transformed by taking the ln of them, to ease computations in the final regression model. Table 1 shows the mean, median, minimum, maximum, and standard deviation of all variables of the study. On the other hand, Table 2 shows the Pearson correlation coefficients of the variables under this study.
From Table 1 the mean of the GSE all share index in the period under the study was 4177.564. This measures the price movement of all the stocks listed on the Ghana Stock Exchange and as such directly reflects the prices of all stocks on the exchange floor. The descriptive statistics also show that, the GSE all share index’s lowest value was 969.03 and maximum value being 10890.8, giving a very high range within the period of study. The inflation rate on the other hand, averaged 13.24% within the period of study, with a deviation of 3.87%, while the 91-day treasury bill rate averaged about 18.03% with a deviation of 6.61%. The real composite index of economic activity which shows progress in the real sector of the economy displayed a range between 150.66 and 416.16, with a mean of 289.08. The descriptive statistics could go as far, and as such there is the need ito do a trend analysis of the ivariables, which will take place in the ensuing pages.
| Table 1 Descriptive Istatistics Iof Ivariables |
||||||
|---|---|---|---|---|---|---|
| Variable | Mean | Median | Std.Deviation | Min | Max | Kurtosis |
| GSE-ASI | 4177.56 | 2386.30 | 2916.96 | 969.03 | 10890.80 | 2.51 |
| INFYOY | 13.24 | 11.90 | 3.87 | 8.40 | 20.70 | 1.74 |
| TBR 91day | 18.03 | 21.59 | 6.61 | 9.41 | 27.80 | 1.27 |
| CIEAReal | 289.08 | 293.61 | 83.77 | 150.66 | 416.16 | 1.68 |
| Table 2 Pearson correlation coefficient of study variables |
||||
|---|---|---|---|---|
| Variable | Correlation | |||
| GSEASI | CIEAReal | INFYOY | TBR91day | |
| GSEASI | 1 | |||
| CIEAReal | -0.684 | 1.000 | ||
| INFYOY | 0.357 | 0.157 | 1.000 | |
| TBR91day | -0.088 | 0.585 | 0.701 | 1.000 |
Table 2 which is an correlation matrix reveals how the various variables move together. From the table, there is an inverse relationship between the real composite index of economic activity, and the Ghana Stock Exchange- All share index. This presupposes that as the real sector makes increased activity, the prices of stocks tend to fall, and as the real sector decreases activity, the prices of stocks tend to rise. The strength of the association was 68.41%, which can be said to be fairly strong. The GSEASI was also found to be positively correlated with inflation at a strength of 35.72% while the GSEASI was found to be negatively related to the 91-day treasury bill rate, although the association is not strong, standing at about 8.7%. The other independent variables did not display strong correlations among themselves with the exception of inflation rate and 91-day treasury bill rate, which stands at about 70%.
Graphical Analysis
Figure 1 and Figure 2 display the trend of CIEAReal and Inflation over the 10-year period (2006-2016).

Figure 1: Trends Iin Ireal Icomposite Iindex Iof Ieconomic Iactivity
Figure 1 shows that real composite index of economic activity has largely maintained a steady and continuous increase under the period of the study.
The largest change in the inflation rate was seen from 2009 to 2010 with a 44.6 % reduction in the inflation rate. Inflation rate maintained an increasing trend from 2006, peaking in 2009. The period from 2009 to 2011 saw a decreasing trend before ireaching iits lowest point in 2012 and 2013. It then took off with another round of increasing trend from the year i2013 ito i2016.

Figure 2: Trends in inflation (2006-2016)
Figure 3 also shows trends of all the study variables together. This demonstrates the relationship among the variables in a graphical form. It can be observed that inflation and the 91-day treasury bill rate have a direct relationship, while there may be a possible relationship between the real composite index of economic activity and Ghana Stock Exchange - All Share Index, although the graphical view does not bring out the exact relationship, which may be made explicit by the regression model.

Figure 3: Trends Of All Ivariables (2006-2016)
Regression Analysis
In order to use the Ordinary Least Square (OLS) regression model on a time series, the stationarity of the various variables must be tested and ascertained. This is because, the OLS method assumes the moments of the variables to be constant, although these moments of time series are hardly constant. If all variables are found to be stationary, then one could use the OLS regression without its results being spurious. To test for stationarity of the variables, the Dickey Fuller unit root test was used with the help of Stata statistical software.In effect unit root test was conducted for each of the variables of the study and they were found to be only stationary at the first differential meaning each of the variables had one-unit root (I (1)).
For each of the variables the null and alternate hypothesis were used to determine stationarity.
H0: Variable has unit root (not stationary)
H1: Variable has no unit root (stationary)
For each of the variables, if the absolute value of the test-statistic is greater than the absolute value of the 5% critical value, then null hypothes is is rejected and alternate hypothesis holds is way, and vice versa. As can be seen from Table 3, all variables were not stationary.
| Table 3 Thedickey fuller unit roottest results for all Ivariables |
||
|---|---|---|
| Variable | Test-statistic | 5%Critical Value |
| LogCIEAReal | -2.013 | -2.958 |
| LogGSEASI | -1.351 | -2.958 |
| TBR 91 day | -2.458 | -3.544 |
| INFYOY | -1.479 | -3.544 |
To make variables stationary for any meaningful time series regression analysis, the first differential of the variables had to be tested for stationarity. Results showed that the first differential of all variables displayed stationarity as indicated by the Dickey Fuller Unit Root Test. Table 4 shows the Dickey Fuller test results for the first differential of the variables.
| Table 4 The dickey fuller unit root test results for the first differentials of theVariables |
||
|---|---|---|
| Variable | Test-statistic | 5%Critical Value |
| LogCIEAReal | -8.807 | -2.961 |
| LogGSEASI | -6.379 | -2.961 |
| TBR 91 day | -4.485 | -2.961 |
| INFYOY | -4.017 | -2.961 |
As a result of the fact that each variable had one-unit root, the regression analysis could not have been done without a co-ntegration test. This is because if variables are not stationary, regression analysis will be spurious, and the only exception is that the variables are co-integrated which in the economic sense means that there is an actual relationship among variables.
For the Co-integration test, the optimal lag computed was 3, obtained through selection order criteria done with the use of Stata. The co-integration test used the Johansen test method to ascertain whether all variables in the study were co-integrated in at least one way. With the assumption of a constant trend, it was determined that at rank 0, the trace statistic (74.4199) is greater than the 5% critical value. Table 5 shows the results for the Johansen co-integration test.
| Table 5 Johansen tests for co-Integration with constant trend and 3 lags |
||||||
|---|---|---|---|---|---|---|
| Rank | Parms | LL | Eigenvalue | Trace Statistic | 5% Critical | 1% Critical |
| 0 | 36 | -80.776 | 74.420 | 47.210 | 54.460 | |
| 1 | 43 | -58.068 | 0.697 | 29.005 | 29.680 | 35.650 |
| 2 | 48 | -49.588 | 0.360 | 12.045 | 15.410 | 20.040 |
| 3 | 51 | -45.014 | 0.214 | 2.896 | 3.760 | 6.650 |
| 4 | 52 | -43.566 | 0.073 | - | ||
The ordinary least square regression analysis was performed in ascertaining the effect of inflation on stock market prices measured by the Ghana Stock Exchange all share index. The log of real composite index of economic activity, and 91-day treasury bill rate were used as control variables. Table 3 shows a summary of the model of the effect of the control variables without the variable of interest, namely, inflation. Table 4, on the other hand, shows the effect of inflation on log of stock market prices together with the control variables.
| Table 6 Regression output without inflation |
||||
|---|---|---|---|---|
| Model1 | LogGSEASI | |||
| Variable | Sign | Coefficient | t-stat | p-value |
| Constant | 20.357 | 12.720 | 0.000 | |
| TBR 91 day | + | 0.052 | 3.590 | 0.001 |
| LogCIEAReal | - | -2.351 | -7.610 | 0.000 |
| Adjusted R square | 58.78 | |||
| R isquare | 60.84 | |||
| Observation | 41 | |||
| F Statistic | 29.52 | |||
Table 6 shows only the control variables, namely; real composite index of economic activity, and 91-day treasury bill rate. The R-square of 60.84% obtained from this model suggests that the explanatory variables, thus real composite index of economic activity and 91-day treasury bill rate jointly account for approximately 60.84% of the variations in the stock market prices. The adjusted R2 indicates that after removing the influence of the explanatory variables, the dependent variable is still explained by the equation with 58.78 %. The F-statistic of 29.52 for the model is significant at a 5% significance level and thus provides a good fit for the estimated model.
The results in Table 3 shows that the real composite index of business activity and T-bills rate had a significant impact on GSE-ASI. The P values were less than 5% significance level(p==0.05); hence the study failed to accept the null hypothesis. Inferences from the T-statistic also indicated that the values were greater than the critical values at 5% alpha level; hence we fail to accept the null hypothesis.
| Table 7 Regresion Output With Inflation |
||||
|---|---|---|---|---|
| Model One | LogGSEASI | |||
| Variable | Sign | Coefficient | t-stat | p-value |
| Constant | 17.27 | 14.06 | 0.00 | |
| INFYOY | + | 0.10 | 5.41 | 0.00 |
| LogCIEAReal | - | -1.86 | -8.46 | 0.00 |
| Adjusted R square | 0.69 | |||
| R square | 0.70 | |||
| Observation | 41.00 | |||
| F Statistic | 45.13 | |||
Note: t-statistics is significant at *10%, **5%, and ***1% significance levels
From Table 7, the R-squared of 70.37% obtained from the GSE-ASI model suggests that all the explanatory variables thus, inflation, composite index of economic and business activity and T-bills rate, jointly accounted for 68.81% of the variations in the prices of stocks as represented by GSE-ASI in the equation. This shows that adding inflation to the model makes a difference.
The results in Table 7 indicate that Inflation and composite index of economic activity had significant impact on GSE-ASI at a 5% significance level. Inflation was positively related to the GSE-ASI indicating that increase in inflation rate leads to an increase in stock prices. The findings of this study is consistent with the result of (Zarychta, 2019) who found a positive relationship between inflation and stock market returns. This can be explained by investor behavior towards inflation. Inflation reduces the purchasing power and value of money of investors over time. Investors in a bid to safeguard the value of their money, may decide to lock the worth of their funds in established businesses, other than holding cash. At a 5% significance level, composite index of economic activity, was noted to have a negative but significant relationship with stock prices. This may be explained by the fact that when investors have confidence in the real sector, they channel their funds into businesses to make real returns. However, when business confidence and activities are low, businesses or investors may liquidate their wares in the real sector and stash the funds in stocks ito avoid the difficulty of doing business in the economy. Therefore, we fail to accept the null hypothesis because the T-statistic of 6.37 is greater than the critical values at a 5% significance level.
Moreover, the table shows that T-bill rate has no significant effect on stock prices. At a 5% significance level, the P value of 0.645 was greater than 0.025, hence we fail to accept the null hypothesis. This can be buttressed with the correlation result of table 4.2 which indicated a strong correlation between T-bills rate and inflation rate. This is because government issued T-bills do not carry risk of default. However, they carry risk of inflation. Investors demand compensation in two ways; time value of money and risk according to the theory of CAPM. With the unavailability of idefault risk, governments only compensate for time value of money, which is linked to inflation. To do this, governments must give a rate higher than inflation to investors. When inflation rate rises, investors will demand that T-bill rates also should rise. This may be a reason for why there exists a positive relationship between inflation and T-bill rate.
Conclusion
The study was undertaken to evaluate the effect of inflation and other key macroeconomic variables on stock market prices. In effect, the study sought to achieve the following research objectives.
i. Ascertain the effects of inflation on stock market prices
ii. Ascertain the effects of other macro-economic variables (treasury bill rate, and the productivity in the real sector) on stock market prices.
The findings of the study are therefore presented in accordance with the objectives of the study.
The Effect of Inflation on Stock Market Prices
The findings of the study revealed that inflation was positively related to the GSE-ASI indicating that increase in inflation rate leads to an increase in stock prices. Inflation reduces the purchasing power and value of money of investors over time. Investors in a bid to safeguard the value of their money, may decide to lock the worth of their funds in established businesses, other than holding cash.
The Effect of Other Macroeconomic Variables on Stock Market Prices
T-bill rate has no significant effect on stock prices This is because government issued T-bills do not carry risk of default. However, they carry risk of inflation. Investors demand compensation in two ways; time value of money and risk according to the theory of CAPM with the unavailability of default risk, governments only compensate for time value of money, which is linked to nflation. To do this, governments mustigive a rate higher than inflation to investors when inflation rate rises, investors will demand that T-bill rates also should rise.
It was also found that real composite index of business activity and T-bills rate had a significant impact on GSE-ASI.
Recommandations
The study found an existing relationship between inflation and stock market prices in Ghana. The relationship was found to be positive. When inflation rate increases, stock prices also increase on the Ghana bourse. This means a bullish market is not always indicative of a robust economy. Also, the performance of the real sector has an inverse relationship with the capital market. By inference, it may be assumed that investors opt for the capital market in times when business activities in the real sector become slow and unattractive. T-bill rates have a positive relationship with stock prices. This is understandable, since T-bills offer inflation rate plus an premium. Hence, once inflation rate increases, T-bill rates also increase in commemoration.
Based on the major findings emanating from the study, the following recommendations are made:
The government of Ghana and policy makers should pay attention to inflation targeting and keeping inflation in check, as failure to do this, may lead to a ‘false’ bullish market.
The government of Ghana and policy makers should be careful not to assume economic growth and healthy business environment by using the bullish market as basis. Businesses and investors should be mindful of the macro-economic variables that may affect prices of stock.
References
Adam, A.M., & Tweneboah, G. (2008). Do macroeconomic variables play any role in the stock market movement in Ghana?
Barnor, C. (2014). The effect of macroeconomic variables on stock market returns in Ghana (2000-2013).
DeRosa, D.F. (2021). Bursting the Bubble: Rationality in a seemingly irrational market. CFA Institute Research Foundation.
Fama, E.F. (1991). Efficient capital markets: II. The journal of finance,46(5), 1575-1617.
Ghana Stock Exchange. (2016). Market summary 2016.
Kuwornu, J.K. (2011). Analyzing the effect of macroeconomic variables on stock market returns: Evidence from Ghana. Journal of Economics and International Finance,3(11), 605-615.
Morrison, H.A. (2018). Cash management tool for Maryland montessori learning centre. Agona Swedru.
Wireku, C. (2017). Factors influencing share price volatility of listed firms and low patronage of the Ghana Stock Exchange (Doctoral dissertation, University of Education, Winneba).
World Bank. (2017). World Bank Financial Data.
Zarychta, A., Andersson, K.P., Root, E.D., Menken, J., & Grillos, T. (2019). Assessing the impacts of governance reforms on health services delivery: A quasi-experimental, multi-method, and participatory approach. Health Services and Outcomes Research Methodology, 19(4), 241-258.
Received: 24-Nov-2021, Manuscript No. AAFSJ-21-9786; Editor assigned: 27-Nov-2021; PreQC No. AAFSJ-21-9786(PQ); Reviewed: 14-Dec-2021, QC No. AAFSJ-21-9786; Revised: 20-Dec-2021, Manuscript No. AAFSJ-21-9786(R); Published: 24-Dec-2021