Research Article: 2022 Vol: 28 Issue: 6S
Innovation and Sustainable Growth of SMEs in Bangladesh - Do Financial Innovations Matters: An Asymmetric Investigation
Md. Qamruzzaman, United International University
Salma Karim, United International University
Ishrat Jahan, United International University
Citation Information: Qamruzzaman, Md., Karim, S., & Jahan, I. (2022). Innovation and sustainable growth of SMEs in Bangladesh - Do financial innovations matters: An asymmetric investigation. Academy of Entrepreneurship Journal, 28(S6), 1- 28.
Abstract
This study's motivation is to investigate the association between innovation, financial innovation and sustainable SME growth over 2006-2020 in Bangladesh with cross-sectional data. Unlashing the fresh evidence study performs baseline estimation with Dynamic OLS and Fully-modified OLS, Nonlinear Autoregressive distributed lagged (NARDL) for detecting asymmetric shock and System GMM for robustness. Furthermore, directional causality establishes by performing the Panel Granger-causality test under the error correction term. Baseline estimation documents positive statistically significant effects running from innovation and financial innovation to SMEs growth in all the aspects. Asymmetric effects of innovation and financial innovation on a firm’s growth unveil asymmetric relationships in the long and short run. Positive shocks in innovation and financial innovation establish a positive statistically significant linkage, and a negative shock reveals a negative association with SME growth. In contrast, the positive shocks are more intense than negative. Finally, the feedback hypothesis explains the causal relationship between innovative finance, innovation and SMEs growth in the long run and short run. The study advocates policy formulation for SME's progress so that the firms willing to adapt innovation and financial institutions to offer innovative financial products and services shall be accelerated.
Introduction
Developing countries, like Bangladesh, are pursuing to achieve the Millennium Development Goal, hereafter MDG, by ensuring socio-economic growth. Economic growth is characterized by stable growth in GDP, employment opportunities in the economy, reduction of income inequalities, and poverty alleviation. The development of small and medium enterprises only can contribute progressively towards achieving MDG with maintainable development. The key strategic role of SMEs through rural area development, forward integration to large industries as key input suppliers and reduction of regional disparity.
The government and the key policymakers acknowledge the optimization of scarce economic resources, employment generation, and entrepreneurship development in small businesses in Bangladesh. Like another economy segment, small enterprises have extended their contribution over the past decade at the aggregated output of the gross domestic product. The economy of Bangladesh observes significant contribution from SMEs industry with 25% accumulated growth in GDP, 15% in employment generation, 7.8% acceleration in export growth, and 31% improvement in entrepreneurship development (Bangladesh Bank, 2021)
According to the Bangladesh Bureau of Statistics (2017), about 90% of business units belong to small enterprises with a revised definition of SMEs, about 80% of current employees working in small businesses, 75% of gross domestic product composite with SMEs output, and 65% of the export-oriented product come from the SME sector of Bangladesh. The performance of SMEs is inevitable for economic growth because the majority group of business organizations worldwide is SMEs. The emergence of SMEs acts as a catalyst for economic development through job creation in the society as a solution to the unemployment problem, the startup of new enterprise by encouraging new entrepreneurs, optimization of available economic resources through higher productivity and promotion of marketing technology technological advancement. SMEs are the engine for economic progress with limited resources by ensuring the maximization of productivity (Eniola and Entebang, 2015; Qamruzzaman, 2014b; Qamruzzaman, 2014a).
SMEs, however, contribute to the world economy and are well-acknowledged and appreciated in diversified aspects. In empirical literates, the role of SMEs advocated by researchers including employment generation (OECD, 2015; Eze and Okpala, 2015; Johari, 2012; Cheng and Frianeza, 2014; Hassan and Mohamed, 2015; Babalola, 2014; Coke-Hamilton, 2013; Tambunan, 2006), poverty alleviation (Eton et al., 2019; Waqas and Nawaz, 2019; Mamman et al., 2015; Asikhia, 2010; Mukras, 2003), entrepreneurship development ((Liñán et al., 2019; Jerome and Timothy, 2019), domestic market development (Khoryanton et al., 2020; Rundh, 2001; Razzaque, 2003) and so on. Like other developing countries, Small businesses in Bangladesh have been positioned in an important position in economic development since independence. The contribution of SMEs in economic growth is noticeable, particularly ensuring optimization of economic resources in every corner of the economy by promoting entrepreneurship in society. Small business in Bangladesh.
Over the past decade, Bangladesh experienced the considerable growth of SMEs contribution to Gross Domestic Product, ranging from 7.06% to 16.70% from 2000 to 2017 (see, Figure 1). Bangladesh's economy immensely relies on Small Business development because SMEs are directly linked with large production capacity to optimize natural resources from every corner of the country. During this period, the highest growth rate was addressed in 2013 and the lowest in 2007. The positive growth trend confirms the future development of the SME sector the eventual impact on sustainable economic growth. SMEs contribution to the economy not only supplying physical goods but also assists in another production process by supplying supplementary services required by the large production process.

Figure 1: Growth rate of smes contribution to gdp (2000-2017)
The motivation of the study is to investigate the causal relationship between innovative finance, ICT adaption, business innovation and growth for the periods 2005-2018 by using firm-level data. Assessing the effects of innovative finance and innovation on SMEs growth. We performed panel cointegration, regression with Dynamic OLS, Fully-Modified OLS, Nonlinear ARDL by following the nonlinear framework proposed by Shin et al., (2014) and empirical model robustness by performing system GMM with asymmetry. Furthermore, the directional causality was investigated by performing the granger causality test under the error correction term. Study findings unveiled a positive association between innovative finance and SME growth. These findings are valid in all three proxy measures in SME growth. The nonlinear ARDL confirmed the asymmetry relationship between innovation finance and innovation. Considering positive and negative shocks in innovative finance and innovation, it is apparent that positive variations in innovative finance and innovation are positively linked, and negative shock is negatively associated. However, the significant effects were observed with positive variation in innovative finance and innovation. These findings are valid for all three proxy measures for SME growth.
The remaining structure of the article is as follows. Section II is dealing the summary of the literature review. Variable definitions and methodologies of the study are explained in detail in Section III. Econometric model estimation and their interpretation are inserted in Section IV. Finally, Section V contains the summary findings and policy recommendations.
Theoretical and Conceptual Development: Financial Resources Based Theory
According to Sapienza, et al., (2003), a theoretical framework implemented in a developed environment leads to applying conventional finance theory. However, traditional finance theory does not offer enough support for entrepreneurial decision-making in the financial system (Eniola, 2018; Eniola & Entebang, 2015). The assumptions of traditional capital structure theories are based on the fact that some of the frameworks under consideration are quite shaky and are not entirely relevant to the financing of small and medium-sized businesses. Therefore, a growing number of researchers have been considered resources-based theory in gauging the SMEs financing decisions and detecting the impact of financing decisions on SME's performance sustainability (Kijkasiwat, 2021; Koropp et al., 2014; Qamruzzaman & Jianguo, 2017).
Entrepreneurs often ask family and friends to join their operations, investments, manufacturing, and strategy-making. Centralized family management may help SMEs grow rapidly early, but it can also lead to inefficient resource allocation and managers' self-serving conduct. SMEs' survival and failure in the early stage are determined by the accessibility and application of economic and financial resources in operation (Alayo et al., 2021). Limiting external financing from financial institutions discourages firms from adopting expansion strategies and pushes them to look for private investment, which is costly in managing those funds (Wang et al., 2017). The firm's capacity to distinguish resource requirements and potential sources allows for the maximization of the scope for development with limited resources. The resource-based approach proposed that the firm's competitive advantage be divided into internal and external resources. SMEs have control over internal resources but face difficulties accumulating and managing external sources (Bardhan et al., 2014).
External economic resource integration in operation boosts a firm s managerial efficiency, corporate governance, and innovativeness, eventually augmenting long-term sustainability (Brown, 2018; Qamruzzaman et al., 2021). In addition, financial resources accessibility and profit reinvestment in research and development induce innovation and a further improvement in SMEs' growth. However, family-owned SMEs with underlying development possibilities may be tentative to rely upon external financing that entails incurring debt or dilutes ownership; thus, startup entrepreneurs may be apprehensive about relinquishing control of their businesses (Miller et al., 2013). Theories based on asymmetric information, created to explain the market failure, have also been developed to analyze the demand for financial resources. Particularly noteworthy is the well-known pecking order hypothesis, which emphasizes the importance of information asymmetries in causing preferences for cheaper internal finance first, followed by costlier external finance (debt then equity) if there are insufficient internal funds available (Myers & Majiuf, 1984; Vanacker & Manigart, 2010; Fang & Qamruzzaman, 2021). Following agency theory, there is a conflict between the objectives of entrepreneurs and financiers - external financing will be more readily accessible when there is collateral to assist align interests (Rao, 2017).
Finance and accessibility decisions are significantly and favorably related to entrepreneurship's vitality and innovation. Furthermore, funding motivates established businesses to take advantage of possibilities for expansion and innovation and attain better stability. Companies may also use a finance infrastructure to build a more competent and productive asset portfolio and choose more productive organizational structures like incorporation (Beck & Cull, 2014).
Literature Review
The development of SMEs is not an easy task. However, government from every country takes substantial initiatives towards SMEs sectors growth by eradicating capital scarcity which is the prominent cause impeding SME survival figures out by researchers in their respective empirical studies see, for example, Schmitz (1995); Schmitz (2015); Abor & Quartey (2010); Hussaina, et al., (2010); Elaian (1996); Gockel & Akoena (2002); Ricupero (2001); Anheier & Seibel (1987). In a study, Hartšenko & Sauga (2014)found that effective support for financing to SMEs helps for increase productivity
A study by Harash, et al., (2014) investigated the role of finance on SME s performance in Iraq. They postulated that available access to finance accelerates SMEs' growth especially mitigating the demand for operating capital. Researchers, over the period, observed a strong association between microfinance and SME development, especially in developing countries. For example, Bello (2013) & Abubakar & Gani (2013); Afolabi Afolabi & Oni (2015); Oni (2013), Oleka, et al., (2014); Oleka, et al., (2014) found in Nigeria, Ngugi & Kerongo (2014) found in Mombasa, Karlan & Zinman (2010) found in the Philippines, Pei-Wen, et al., (2016)- found in Malaysia, Awuah & Addaney (2016) found in Ghana. Access to credit through microfinance; assist SMEs not only to boost their financial power and performance stability (Simeyo et al., 2011) and enhance the income level of households in the society (Zimba, 2016).
Further evidence was observed in the study of Ahiabor (2013). He investigated the microcredit impact on SMEs performance in Ghana conducted a study. Studies support the availability of external financing to boost performance with a higher survival rate. Another study conducted by Osoro & Muturi (2013) assessed the role of credit facility by microfinance on SME development. They conclude that the savings account offered by micro financials assists entrepreneurs in developing a culture of saving. They also emphasized that the accessibility of training is positively related to the growth of SMEs with the provision of credit and training, and a cheap savings account helps the growth of SMEs (Andriamahery & Qamruzzaman, 2022).
Another key attribute that plays a critical role in the financial performance of SMEs, i.e., innovation. According to Schumpeter Schumpeter (1911), there is no well-designed definition; however, following empirical literature, innovation is the adaptation and diffusion of know-how, development of the new product, process efficiency. Broadly, the innovation process can be understood as a complex activity in which current and new knowledge are applied for commercial ends (Escribano et al., 2009).
The effects of innovation on financial performance are also extensively investigated. In the study of Bigliardi (2013), he investigates the relationship between innovation and the financial performance of SMEs by collecting data from 98 firms. Study findings revealed that an increase in innovation results in higher financial performance. A similar positive association was also observed in other studies conducted by researchers see an instance, (Hult et al., 2004; Jiménez-Jiménez & Sanz-Valle, 2011; Rhee et al., 2010; Wang, 2014; Simpson et al., 2006; Sethibe & Steyn, 2016). The results of innovation, according to Damanpour & Evan (1984), provide a transitory competitive advantage that allows firms to obtain returns on innovation, such as higher sales and firm growth.
In addition to the direct effects of innovation on SMEs' performance. Learning during the innovation process generates absorptive capacity that, in turn, implies competitive advantages (Zahra & George, 2002). Further benefits include learning economies, economies of scale and scope, preemption of limited resources, advantages in further innovation, and the ability to set standards (Rosenbusch et al., 2011). Furthermore, innovation positively affects the firm's manufacturing capacity (Sandvik & Sandvik, 2003) and employment growth (Freel & Robson, 2004; Lingyan et al., 2021).
Data and Methodology of The Study
Data and Variable Definition
In this study, annual time series data were used empirical estimation over the period for 2006-2020, and the aggregated data were extracted from Bangladesh economic review(BRE) published by Ministry of Commerce and Industry, Annual SMEs report published by SMEs foundation Bangladesh, and Statistical package Book published by Bangladesh Statistical Bureau.
SMEs' growth sustainability measured using a single proxy is biased estimation due to several proxies available in the empirical literature. In this study, therefore, as a dependent variable, Sustainable SME growth is measured by three different proxies are Revenue growth by following (Gerba & Viswanadham, 2016; Barbera & Hasso, 2013; Locke, 2004), Assets growth by following (Locke, 2004), and employee growth by following (Locke, 2004; Gerba & Viswanadham, 2016).
Two variables are treated as independent variables in the empirical model estimation.
First, Financial Innovation (FI): refers to utilizing alternative financing options, more specifically those modes of finance initiated by targeting SMEs' access to credit. In this study, the innovative finance measures by the total amount for credit facility avail by SMEs from SME financing scheme from Banks, Credit with Refinancing scheme of Bangladesh bank, credit form Microfinance institution as a percentage of equity capital employed in the business.
Second, Innovation (INNO): in line with existing literature, we used the total R&D internal expenditure to total sales (R&D INT) by following (D’Angelo, 2012; Koellinger, 2008; Branzei and Vertinsky, 2006). To make the robustness of the analysis, I add three (03) more control variables, namely, ICT adaption, employee development, and business development.
| Table I VARIABLE DEFINITION WITH THE EXPECTED SIGN |
||
|---|---|---|
| Variable Definition | sign | |
| Dependent Variable | ||
| Revenue Growth (RG) | It refers to percentage changes in income generation capacity over the period. A positive change indicates the firm's business development with operational improvement over the year. | |
| Assets growth (AG) | The growth of firms' assets indicates business expansion and substantial earning generation. Positive changes in asset growth signify the maximization of economic resources by the firm. | |
| Employee growth (EG) | Recruitment of new employees indicates business expansion by adopting more production capacity in the existing business. | |
| Independent variable | ||
| Innovative finance | An innovative way of financing small business with the development of financial products and new financial institutions in the financial system | + |
| Innovation | Indicates investment in research and development. As a percentage of total expenditure in the firm | + |
| Control Variable | ||
| ICT | Amount of capital invested in the implementation of ICT in the business process. As a percentage of total expenditure in the firm. | +/- |
| BD | The firm continues improvement in dealing with business operations with substantial investment for changing existing business operations. | + |
| ED | The amount of capital invested in the employee development program as a percentage of total expenditure. | +/- |
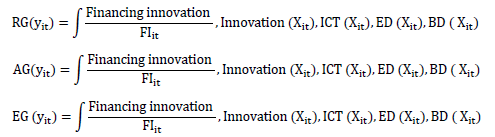
Considering the variables, the following basic panel model can construct based on dependent variables.

Where i = 1 … N, t = 1…..T, Y denotes proxy of firm growth; FI specifies financial innovation, INO denotes for innovation, ICT for information technology, BD for business development and ED for employee development. The coefficient represents the constant term, indicates the elasticity of the independent and control variable towards the dependent variable, and indicates error correction term in the model. The summary statistics of the research variables reported in Error! Reference source not found. consist of two (02) data panels. Panel – A represents descriptive statistics, and Panel – B contains a correlation matrix, respectively.
| Table 2 A SUMMARY OF DESCRIPTIVE STATISTICS |
||||||||
|---|---|---|---|---|---|---|---|---|
| AG | RG | EG | FI | INNO | BD | ICT | ED | |
| Mean | 13.6124 | 15.7857 | 15.9121 | 12.7307 | 13.6421 | 2.3722 | 12.92201 | 14.13124 |
| Median | 13.82 | 16.06 | 16.43 | 14.44 | 14.87 | 2.48 | 13.01 | 14.20 |
| Maximum | 14.84 | 17.18 | 17.72 | 15.42 | 17.73 | 2.99 | 13.52 | 14.73 |
| Minimum | 9.93 | 12.20 | 9.90 | 5.39 | 5.39 | 0.69 | 11.92 | 13.12 |
| Std. Dev. | 0.85 | 0.99 | 1.64 | 3.11 | 3.45 | 0.48 | 0.43 | 0.43 |
| Skewness | -1.11 | -0.88 | -1.07 | -1.16 | -1.24 | -1.18 | -0.53 | -0.53 |
| Kurtosis | 4.25 | 2.99 | 3.11 | 2.74 | 3.03 | 4.41 | 2.20 | 2.23 |
| Panel ? B: Correlation Matrix | ||||||||
| AG | 1.00 | |||||||
| RG | 0.31 | 1.00 | ||||||
| EG | 0.40** | 0.43 | 1.00 | |||||
| FI | 0.42 | 0.46*** | 0.09*** | 1.00 | ||||
| INNO | 0.30 | 0.34 | 0.11 | 0.55 | 1.00 | |||
| BD | 0.08 | 0.11*** | 0.01 | 0.02 | 0.05*** | 1.00 | ||
| ICT | 0.02*** | 0.01*** | 0.04 | 0.09 | -0.014*** | 0.11 | 1.00 | |
| ED | 0.12 | 0.02 | 0.15 | -0.25 | 0.081*** | 0.02 | -0.06*** | 1.00 |
Conceptual Model and Hypothesis Development of this Study
Methodology of the Study
Estimation began with establishing the order of integration test of stationarity. Existing empirical advocates various techniques of estimating variables order of integration, including Levin et al., (2002); Im et al., (2003); Breitung (2001). Application of panel unit root estimation is more powerful in predicting the level of integration with single time series data. Researchers in empirical studies segregate panel unit root test in two generations, first-generation panel unit root test includes Levin, et al., (2002); Im, et al., (2003), and Fisher-Type test using ADF and PP-test (Maddala & Wu, 1999) under the assumption of cross-sectional independence and second-generation test of stationarity focus on covariance restriction approach.
Panel Cointegration Test
Investigating the long-run association between dependent and explanatory variables is one of the key issues in this study. Considering the research data character, I peruse the panel cointegration test of ascertaining the long-run relationship. Existing econometric empirical study provides evidence of different panel cointegration testing over the past decade. However, many researchers rely on suggestions for panel cointegration estimation introduced by Pedroni (2001, 2004, 1999).
I will use the eleven-panel cointegration offered by Pedroni (2004, 1999). The estimation of the cointegration test performs residual correlation with the normalization of panel estimation. The procedures proposed by Pedroni (1996) make use of estimated residual from the hypothesized long-run regression of the following form:

For, t = 1... T; i = 1… N; m = 1… M,
T is the observations with time, N number of cross-sectional units in the Panel, and M number of repressors. Is this setup the fixed effects coefficient for cross-sectional units in individual units and the coefficient of indicating time effects in the equation?
I examine the cointegration relation among variables by applying Pedroni (2004, 2001) panel cointegration test. As stated by Pedroni (2004), the panel cointegration technique is based on pooling among both within dimensions (Panel V-Statistic, Panel ρ-Statistic, Panel PP-Statistic, and Panel ADF-Statistic) and between dimensions (Group ρ-Statistic, Group PP-Statistic, and Group ADF-Statistic).
Dynamic Ordinary Least Square (DOLS) and Fully-modified Ordinary Least Square (FMOLS)
Fully-Modified Ordinary Least Square: Estimation of cointegration with panel data series, fully modified least square (FM-OLS) provides the best possible findings (Phillips & Hansen 1990). The FM-OLS can incorporate serial correlation and heterogeneity while estimating cointegration regression. Furthermore, the FM-OLS can also estimate a multivariate unit root test with the deterministic trend.
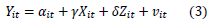
The traditional OLS estimation produces bias and cannot address the equation's dynamic effect. Incorporation and address of Heteroskedasticity and reduction of biases towards estimation, I consider both the fully modified ordinary least square (FM-OLS) and dynamic ordinary least square (DOLS) introduced by Pedroni (1996). After further developing and improving the existing methodology, Pedroni (2000) introduces a new panel cointegration estimation test forming group means known as Fully Modified Ordinary Least Square (FM-OLS).
The estimator of FM-OLS is as follows:
The study considers both the fully modified and Dynamic Ordinary Least Square estimation on the following ground.
Both FM-OLS and DOLS can address the problem of serial correlation and heterogeneity in the data set.
Like another popular nonparametric test, the FM-OLS and DOLS incorporate a standardized score from Heteroscedasticity in the estimation.
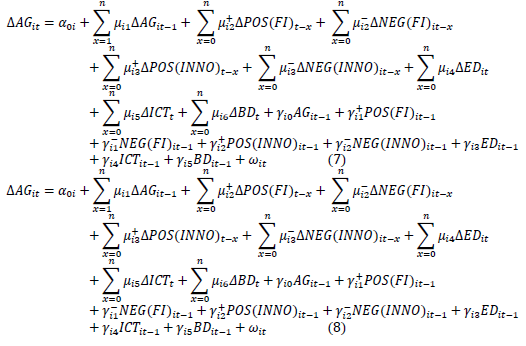
The Asymmetric Panel ARDL
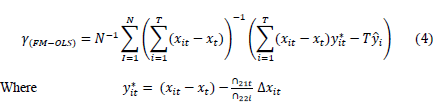
To test symmetric or asymmetric effects of remittance receive on household consumption. We follow the Nonlinear ARDL proposed by Shin et al. (2014) and transform it into panel mode with the underlying assumption of a positive and negative shock in the independent variable. Following empirical studies, see (Bahmani-Oskooee & Mohammadian, 2016; Qamruzzaman, 2022; Muneeb et al., 2021a; Muneeb et al., 2021b; Jia et al., 2021; Zhang et al., 2021), we decompose innovative finance into positive and negative changes denoted by . The argument behind decomposition is that finance flows do not remain stable since finance availability relies on firm performance and financial situation; therefore, variation is imminent. Using new notation, we create two sets of new time series variables, where denoted by growth in finance flows and denoted by negative growth in access to finance availability. Series can drive using the following equations:
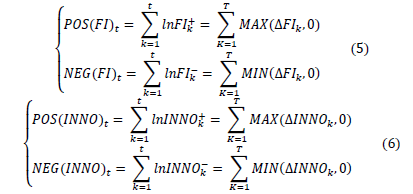
The next step is to rewrite equation (2) by incorporating positive and negative changes in the equation and transforming it into Panel Non-linear ARDL:
Panel Granger Causality Test
The study performs the Granger causality test under the error correction model (ECM) to investigate the directional relationship between explanatory and dependent variables. Causality test under the error correction environment produces evidence regarding short-run and long-run causality in the model estimation.

The long-run causality ascertains the error correction term ETC (t-1). The attribute ascertains that long-run causality from the error correction term should be negative and statistically significant. In short-run causality, the estimation can produce bi-directional causality, implying that any changes addressed in any variables can cause both outcomes in the same manner. On the other hand, unidirectional causality explains causality in one direction. It implies that the only effect can be addressed if the causal variable assumes any changes in the equation only when the dependent variable can change.
Empirical Model Estimation
Panel Unit Root Test
In the initial stage of panel data analysis, the study investigates the data order of integration by performing the stationary test.
Table 3 exhibits the results of unit root tests summary results considering variable order integration at a level I (0).
| Table 3 PANEL UNIT ROOT TEST AT LEVEL |
||||
|---|---|---|---|---|
| Methods | ||||
| Variables | Levin, Lin, and the Chu | Im, Pesaran, and Shin | ADF-Fisher | PP-Fisher |
| lnAG | 11.12 (1.00) | 1.23 (0.34) | 23.11(0.089) | 3.87 (0.67) |
| lnRG | 1.93(0.976) | 16.39 (0.65) | 6.25 (1.00) | 3.23(0.45) |
| lnEG | 4.66(1.000) | 15.37(0.846) | 19.19(0.991) | 56.57(0.064) |
| lnFI | 3.69(1.000) | 20.17(0.572) | 0.09(0.996) | 1.73(0.976) |
| lnINNO | 2.55 (0.72) | 26.99 (0.15) | 2.89 (0.76) | 2.45 (0.098) |
| lnBD | 1.32 (0.65) | 45.32 (0.76) | 32.65 (0.66) | 2.18 (0.67) |
| lnED | 13.56 (1.00) | 15.37(0.846) | 19.19(0.991) | 15.37(0.846) |
| lnICT | 3.87 (0.098) | 20.17(0.572) | 0.09(0.996) | 20.17(0.572) |
Table 4 reports the result of the four-panel unit root test at the first the difference, such as Levin, et al., (2002); Maddala & Wu (1999); Im, et al., (2003). It is observed that after the first difference, all the model variables become stationary. This confirms variables order of integration at me (1).
According to Granger & Newbold (1974), stationery is essential for the panel cointegration test and the use of other kinds of time series modeling because nonstationary data in empirical estimations lead to spurious regression results. Therefore, the primary step before proceeding with a given model is to check the level of stationarity for each variable. Choi (2001); Im, et al., (2003); Maddala & Wu (1999) argue that unit root tests allow for individual unit root processes and that the autocorrelation coefficients vary across cross-sections; however, Breitung (2001) and Levin Levin, et al., (2002) point out that unit root tests have a common unit root process across cross-sections.
| Table 4 PANEL UNIT ROOT TEST (AFTER THE FIRST DIFFERENCE) |
||||
|---|---|---|---|---|
| Methods | ||||
| Variables | Levin, Lin, and the Chu | Im, Pesaran, and Shin | ADF-Fisher | PP-Fisher |
| lnAG | -7.52*** | -8.08*** | 11.97*** | 57.60*** |
| lnRG | -5.64*** | -3.66** | 24.26*** | 32.57*** |
| lnEG | -5.54*** | -8.25*** | 21.89*** | 22.42** |
| lnFI | -5.33** | -6.60*** | 25.53*** | 36.59*** |
| lnINNO | -5.20** | -4.79*** | 30.77*** | 31.27** |
| lnBD | -5.31*** | -3.84* | 38.22*** | 26.63*** |
| lnED | -5.09** | -7.46*** | 32.36*** | 27.80*** |
| lnICT | -4.27*** | -7.76*** | 24.68*** | 25.28** |
| Note 1: *** and ** denote 1% and 5% level of significance, respectively. | ||||
Panel Cointegration Estimation
After the first difference, the stationary test confirmed the variable order of integration in the previous section. It implies that after the first difference, all the variable becomes stationary. After confirming stationary, in this section, I examine cointegration relation among variables by applying Pedroni's (2004, 2001) panel cointegration test. As stated by Pedroni (2004), the panel cointegration technique is based on pooling among both within dimensions (Panel V-Statistic, Panel ρ-Statistic, Panel PP-Statistic, and Panel ADF-Statistic) and between dimensions (Group ρ-Statistic, Group PP-Statistic, and Group ADF-Statistic). The results of the panel cointegration test displayed in Table 5.
| Table 5 PANEL COINTEGRATION RESULTS |
|||||||||
|---|---|---|---|---|---|---|---|---|---|
| Within dimension | Between dimension | ||||||||
| Homogeneous | Heterogeneous | ||||||||
| Statistic | Statistic | Test | Statistic | ||||||
| Model 1: | Panel v-Statistic | -8.34 | -11.94 | Group rho-Statistic | 15.97 | ||||
| Panel rho-Statistic | 6.37 | 7.39 | Group PP-Statistic | -28.17 | |||||
| Panel PP-Statistic | -20.48** | -18.10** | Group ADF-Statistic | -17.09** | |||||
| Panel ADF-Statistic | -19.13** | -16.69** | |||||||
| Model 2: | Panel v-Statistic | -7.54 | -11.27 | Group rho-Statistic | 17.03902 | ||||
| Panel rho-Statistic | 7.22 | 8.66 | Group PP-Statistic | -19.27** | |||||
| Panel PP-Statistic | -16.59** | -14.06** | Group ADF-Statistic | -12.54** | |||||
| Panel ADF-Statistic | -15.82** | -13.17** | |||||||
| Model 3 | Panel v-Statistic | -7.34 | -12.22 | Group rho-Statistic | 17.29894 | ||||
| Panel rho-Statistic | 8.027 | 8.74 | Group PP-Statistic | -20.71** | |||||
| Panel PP-Statistic | -11.91** | -13.53** | Group ADF-Statistic | -10.42** | |||||
| Panel ADF-Statistic | -11.79** | -12.75** | |||||||
Considering the panel cointegration test results, it is apparent that seven out of eleven test statistics support the rejection of the null hypothesis with no cointegration at a 1% level. This implied the existence of long-run cointegration between firm growth and external financing opportunities available in the economy. Also, Pedroni (1999) argued that the panel ADF and group ADF statistics deliver the most powerful cointegration result within the seven test statistics. The Model 3 tests also revealed that there is a long-run equilibrium relationship among the country-level variables in all models.
Furthermore, we also investigate the long-run association by performing the Westerlund-Durbin-Hausman panel cointegration proposed by Westerlund (2008). Model estimation produced two statistics: Group statistics based on panel homogeneity and Panel statistics based on panel heterogeneity. Table 6 reports the summary results of the panel cointegration test. It is observed from the estimation that the null hypothesis of no cointegration is rejected in all four estimations. These findings imply that SME's growth will be affected by any changes in Innovative Finance, Business Development, Innovation, ICT adaption, and Employee Development in the long run.
| Table 6 RESULT OF WASTELAND-DURBIN-HAUSMAN (2008) PANEL COINTEGRATION TEST |
|||
|---|---|---|---|
| Test | Assets growth | Revenue growth | Employee Growth |
| Durbin-Hausman Group Statistic | 4.4486 (0.000) |
23.871 (0.000) |
15.598 (0.000) |
| Durbin-Hausman Panel Statistic | 17.934 (0.000) |
4.943 (0.004) |
6.142 (0.002) |
Empirical model estimation with DOLS and FMOLS
Based on the previous estimation of the panel unit root test and Pedroni panel cointegration test, I observed that variable integrated after the first difference. The three-panel cointegration model confirms the existence of long-run cointegration among variables. The next step is to implement fully-modified ordinary least square (FMOLS) and Dynamic ordinary least square (DOLS) to gauge the long-run linkage between SME's growth and financial innovation with four explanatory variables.
Estimation of Financial Innovation impact on the Revenue Growth of the Firm
This section investigates the association between financing innovation and the growth of small businesses in Bangladesh, where growth is proxy by changes in revenue over the period. Study perform, panel data regression base estimation, Fully Modified Ordinary Least Square (FMOLS) and Dynamic Ordinary Least Square (DOLS).
The study revealed positively linked with available SME financing and increased revenue for the sample SMEs for FMOLS estimation. The coefficient of financing innovation (FI) is positive and statistically significant at a 1% significance level. Study findings imply that 1% of additional capital can generate 0.125% of revenue in the business. The study considers a set of control variables, and empirical studies suggest that those variables might impact SME's operational performance and growth in the long – run. Among all control variables, innovation in the organization through research and development, adaption and application of ICT, and employee development can positively impact SMEs' performance and growth. In particular, all the coefficients of the control variable are positively linked and statistically significant at a 1% level of significance. However, the control variable of business development activities shows a negative link to the revenue growth of SMEs.
For Dynamic OLS estimation, investigative financing innovation's impact on revenue growth supports positive and statistically significant 1%. Furthermore, the study observes that the control variable'scontrol variables positively influence SMEs' performance development by generating additional revenue in their normal operation. However, business development investment negatively causes the revenue growth of SMEs.
Briefly, both FMOLS and DOLS confirm the positive impact from financing innovation to SMEs growth; in particular, for revenue growth and simultaneously innovativeness in the business and employee development also produce a positive outcome for revenue growth of SMEs.
| Table 7 FINANCIAL INNOVATION IMPACT ON FIRMS PERFORMANCE (REVENUE GROWTH) |
|||||||||
|---|---|---|---|---|---|---|---|---|---|
| Method | |||||||||
| Fully ? Modified least square | Dynamic Ordinary Least square | ||||||||
| Variable | ? | Std.Error | t statistics | p-value | ? | Std.Error | t statistics | p-value | |
| FI | 0.125 | 0.004 | 29.472 | 0.000 | 0.121 | 0.002 | 42.719 | 0.000 | |
| INNO | 0.051 | 0.029 | 1.757 | 0.08 | 0.062 | 0.019 | 3.24 | 0.001 | |
| ICT | 0.006 | 0.028 | 0.243 | 0.81 | 0.028 | 0.019 | 1.481 | 0.138 | |
| BD | -0.378 | 0.022 | -16.97 | 0.000 | -0.359 | 0.012 | -27.842 | 0.000 | |
| ED | 0.053 | 0.02 | 2.666 | 0.01 | 0.061 | 0.014 | 4.396 | 0.000 | |
Estimation of Financial Innovation Impact on Assets Growth of the Firm
The firm's growth is subject to proxy measurement use in the study. In this section, I am investing by deploying another proxy indicator: assets growth, indicating overall development in assets expansion and acquisition over the operational period.
For the FMOLS estimation, the study revealed that the impact of financing innovation while expanding additional credit to SMEs is positive and statistically significant at a 1% level. The coefficient of financing innovation explains that 1% enhance financing opportunities will promote assets development by 0.68%. Furthermore, a similar linkage also supports the other estimation performed by the study called DOLS. The estimation ascertains that an increase in financing availability can contribute positively toward firm growth characterized by asset expansion and acquisition, eventually ensuring the expansion of current business to further development.
Apart from an independent variable, to enhance estimation robustness study also considers three (03) control variables. For control variables, the study observed that both investment in research and development for innovation in the business process and investment in employee development positively promote business development on a positive note. In both estimations, research and development and development and employee development coefficients are positive and statistically significant at 1%. Study findings suggest that investment in business innovation, with R&D and employee development, can assist business growth in the long run. However, the study also unveiled a negative association with asset growth, ICT implementation, and business development, confirmed by both estimations.
| Table 8 FINANCIAL INNOVATION IMPACT ON FIRMS PERFORMANCE (ASSETS GROWTH) |
|||||||||
|---|---|---|---|---|---|---|---|---|---|
| Method | |||||||||
| Fully ? Modified least square | Dynamic Ordinary Least square | ||||||||
| Variable | ? | Std.Error | t statistics | p-value | ? | Std.Error | t statistics | p-value | |
| FI | 0.673 | 0.031 | 21.367 | 0.000 | 0.529 | 0.003 | 165.131 | 0.000 | |
| INNO | 0.042 | 0.03 | 1.393 | 0.163 | 0.031 | 0.021 | 1.449 | 0.147 | |
| ICT | -0.047 | 0.029 | -1.609 | 0.107 | -0.035 | 0.021 | -1.686 | 0.091 | |
| BD | -1.007 | 0.031 | -32.056 | 0.000 | -1.043 | 0.014 | -72.073 | 0.000 | |
| ED | 0.072 | 0.025 | 2.902 | 0.003 | 0.078 | 0.015 | 5.025 | 0.000 | |
Estimation of Financial Innovation impact on Employee Growth of the Firm
Several empirical studies advocated in favor of employee growth as an alternative indicator of measuring the growth of any enterprise. Following past researchers' proposition of using employee growth as an indicator for testing business development, in this section, I estimate further to produce more reliable and pertinent information regarding SMEs' growth and the impact of financing innovation, in particular.
Table 9 exhibits the estimation result of financing innovation's impact on employee growth. The study disclosed in FMOLS and DOLS that financing innovation positively impacts firm growth by expanding existing operations and recruiting additional employees to adjust further business growth. The coefficient of financing innovation under both assumptions is 0.18 and 0.17, respectively, and they are statistically significant at the 1% significance level. One can conclude that a 1% increase in innovative financing can accelerate small enterprise growth regarding employee growth by 18% and 17%, respectively. These study findings suggest that financing innovation in SME financing creates new opportunities for business development with the expansion of existing operations and simultaneously generates additional employment prospects in the economy. Thus, it assists in earning substantial earnings and eventually ensures better development.
For the control variable, innovativeness in the business through research and development and enactment of information technology can construct a more opportunistic situation to grow the firm extensively. The coefficients of both variables are positive and statistically significant. Study findings suggest that investment in innovativeness and integration of information technology in the business process can accumulate operational benefits towards business growth. Nevertheless, other control variables, namely investment for business development and employee development, negatively affect overall performance and employee growth.
| Table 9 FINANCIAL INNOVATION IMPACT ON FIRMS PERFORMANCE (EMPLOYEE GROWTH) |
|||||||||
|---|---|---|---|---|---|---|---|---|---|
| Method | |||||||||
| Fully ? Modified least square | Dynamic Ordinary Least square | ||||||||
| Variable | ? | Std.Error | t statistics | p-value | ? | Std.Error | t statistics | p-value | |
| FI | 0.182 | 0.031 | 5.778 | 0.000 | 0.174 | 0.003 | 52.056 | 0.000 | |
| INNO | 0.008 | 0.03 | 0.267 | 0.789 | 0.026 | 0.023 | 1.134 | 0.256 | |
| ICT | 0.021 | 0.029 | 0.746 | 0.455 | 0.028 | 0.022 | 1.243 | 0.213 | |
| BD | -0.371 | 0.031 | -11.828 | 0.000 | -0.378 | 0.015 | -24.414 | 0.000 | |
| ED | -0.047 | 0.025 | -1.899 | 0.057 | 0.061 | 0.014 | 4.396 | 0.000 | |
Summary of Study Hypothesis Test Along With the Final Verdict
In the last segment, I perform panel data regression using the FMOLS and DOLS considering three different indicators for measuring the growth of the enterprise.
Summary of Study Hypothesis Test Along With the Final Verdict
reports the summary of the tested hypothesis in the study under FMOLS estimation. The hypothesis testing findings show that financing innovation and business innovativeness are positively linked with small enterprise growth. In the case of all three indicators confirm and fully support the tested hypothesis of positive association. Furthermore, the employee development initiative only supports revenue growth and assets growth but negatively persuades the employee growth of firms. Also, ICT adaptation and implementation in the business process only support employee growth of the enterprise. However, investment in business development shows a negative attitude toward enterprise growth in either form of development.
| Table 10 Summary Findings to Support the Test Hypothesis (Fmols Estimation) |
|||
|---|---|---|---|
| Tested Hypothesis | Fully-modified Ordinary Least Square | ||
| Revenue Growth | Assets Growth | Employee Growth | |
| Financing innovation can promote firm growth | Support | Support | Support |
| Business Innovation can stimulate firm growth | Support | Support | Support |
| ICT adaption and implementation can tempt firm growth | NS | NS | Support |
| Business Development can improve operational efficiency | NS | NS | NS |
| Employee development increase the firm level of productivity to growth | Support | Support | NS |
Note 1: "S" for support study hypothesis, "NS" does not support the study hypothesis.
Table 11 exhibits a summary of hypothesis testing under dynamic ordinary least squares. Study findings inclusively support nine (09) out of fifteen (15) hypotheses in three different proxy indicators for measuring the growth of small enterprises. The study observed that the explanatory variable of financing innovation and business innovativeness yields an advantageous environment for small enterprise growth in either measurement. These findings adherently support to improve the way of innovative finance for small enterprise and investment in research and development of bringing business innovativeness can aggregate business performance, eventually, boost growth towards development.
On the other hand, investment for business development may yield unexpected performance, precisely the business development process negative influence on the firm's growth. Moreover, ICT involvement and employee development also produce mixed behavior towards the growth measurement indicator of this study.
| Table 11 Summary Findings to Support the Test Hypothesis (Dols Estimation) |
|||
|---|---|---|---|
| Tested hypothesis | Dynamic Ordinary Least Square | ||
| Revenue Growth | Assets growth | Employee growth | |
| Financing innovation can promote firm growth | Support | Support | Support |
| Business Innovation can stimulate firm growth | Support | Support | Support |
| ICT adaption and implementation can tempt firm growth | NS | NS | S |
| Business Development can improve operational efficiency | NS | NS | NS |
| Employee development increase the firm level of productivity to growth | Support | Support | NS |
The Asymmetric Panel ARDL Estimation
This section investigates the symmetric or asymmetric relationship between remittance flow and household consumption by considering a nonlinear approach (see equation 6-8). Table 12 exhibits the panel estimation results under asymmetry assumption in the equation.
Referring to the results of the long-run model estimation. It is observed that positive shock in innovative finance [FI+] positively linked to SMEs growth (a coefficient of 0.157 for Asset growth, a coefficient of 0.237 for Revenue growth and a coefficient of 0.227 for employee growth). These findings suggest that an increase in SME finance accessibility will accelerate SME's growth in the economy. On the other hand, negative shocks in SME financing opportunities are relatively linked with the proxy measures in SME growth (a coefficient of -0.048 for asset growth, a coefficient of -0.078 for revenue growth, and a coefficient of -0.054 for employee growth). It implies that conservative SMEs financing policy might adversely affect overall SMEs performance, which results in negative growth for SMEs.
Furthermore, considering innovation effects in the long run, it is observable that positive shocks (a coefficient of 0.114 for assets growth, a coefficient of 0.214 for revenue growth and a coefficient of 0.112 for employee growth) in innovation are positively linked with SMEs growth. This conclusion is valid for all three proxy measures of SME growth. On the other hand, the negative variation in innovation is negatively allied with SME's growth proxy. In particular, a coefficient of -0.321 for assets growth, a coefficient of -0.122 for revenue growth, and a coefficient-0.255 for employee growth, respectively. Besides the positive and negative association, the magnetite of negative shocks in innovation is significantly higher than positive variation. Therefore, the management of firms should be considerate in case of deciding for further investment in research and development.
Considering the results of short-run estimation. The coefficient of error correction term (a coefficient of -0.323 for assets growth, a coefficient of -0.513 for revenue growth and a coefficient of -0.453 for employee growth) is negative in sign, a desirable and statistically significant 1% level. These findings suggest that there is long-run convergence in the empirical model. Furthermore, the positive shock in SME financing exhibits a positive association (a coefficient of 0.016 for assets growth, a coefficient of 0.061for revenue growth, and 0.014 for employee growth). On the other hand, negative variation in SMEs financing is negatively linked to SMEs growth proxy but only statistically significant in the case of employee growth (a coefficient of -0.095)
In the long-run positive effects are running from business development, ICT adaption and employee development toward SMEs growth for control variables. This conclusion is valid for all three empirical models. However, I observed mixed effects in the short run
A standard wild test with a null hypothesis of "symmetry effects" was performed to assess both long-run and short-run asymmetric relationships between innovative financing and SMEs growth and innovation and SMEs growth. Because of Wald test results for the long run, the test statistics are statistically significant irrespective of model estimation. Therefore, it implies rejecting the null hypothesis, which means a long-run asymmetric relationship between innovative finance and SMEs growth and innovation and SME growth. On the other hand, the test statistics of the Wald test in the short run are statistically significant in the empirical model with revenue growth employee growth as the dependent variable.
| Table 12 Panel regression results for innovative finance – smes growth |
|||
|---|---|---|---|
| Model Estimation | |||
| Dependent variable à | Assets growth | Revenue Growth | Employee Growth |
| Panel – A: Long-run Coefficients | |||
| 0.155 *** | 0.237*** | 0.227 f *** | |
| -0.048*** | -0.078** | -0.054** | |
| 0.114** | 0.214*** | 0.112*** | |
| -0.321*** | -0.122*** | -0.255*** | |
| BD | 0.003 *** | 0.097*** | 0.003 *** |
| ICT | 0.112** | 0.056*** | 0.343*** |
| ED | 0.041 *** | 0.218*** | 0.008 *** |
| Symmetry test | |||
| 15.627*** | 12.324*** | 15.632*** | |
| 11.982*** | 26.623*** | 13.797*** | |
| Panel – B: Short-run Coefficients | |||
| ECT(-1) | -0.323[0.002] | -0.513[0.004] | -0.453*** |
| 0.016 *** | 0.061*** | 0.014 ** | |
| -0.030 | -0.124 | -0.095 *** | |
| 0.205 [0.026] | 0.307 *** | 0.099*** | |
| 0.008*** | -0.011* | 0.022** | |
| ?BD | 0.024 *** | -0.039 *** | -0.010*** |
| ?ICT | 0.014*** | 0.116*** | 0.031*** |
| ?ED | -0.038 *** | 0.036 *** | 0.004*** |
| Symmetry test | |||
| 1.234 | 9.182*** | 3.232** | |
| 11.723*** | 3.887*** | 6.845*** | |
System-GMM Dynamic Panel – Two-Step Robust Estimate
This section investigates the asymmetry between remittance receive and household consumption applying System – GMM dynamic estimation proposed by Arellano & Bover (1995) and further development made by Blundell & Bond (1998). The estimation was executed considering the previously developed asymmetric equation (see equation -6-8). Wald statistics of both short and long-run can discover symmetry relations between innovative finance, innovation, and SMEs growth. At the same time, the optimal number of lags is selected based on SIC information criterion.
Table 13 exhibits the results of System GMM estimation. Short-run dynamics estimation reports in Panel-A and Wald test statistics for the null hypothesis of short-run symmetry. Furthermore, the results illustrate the conventional AR (2) and Sargan test statistics, allowing us to check the validity of the instruments used in the GMM regressions. It is worth noting that both tests are not rejected at the 1% significance level, suggesting that all GMM regressions use valid instruments. Panel – B reports long-run coefficients and Wald test statistics confirming long–run symmetry. In terms of the symmetry test, both the short-run and long-run, the null hypothesis was convincingly rejected at a 1% level of significance.
| Table 13 Short- and Long-Run Symmetry Tests |
|||
|---|---|---|---|
| Regression Model | |||
| Dependent variable à | Assets growth | Revenue Growth | Employee Growth |
| Panel – A: Short-run model coefficients | |||
| AG(-1) | 0.724*** | - | - |
| RG(-1) | - | 0.647*** | - |
| EG(-1) | - | - | 0.835*** |
| 0.103*** | 0.549** | 0.409*** | |
| -0.010*** | -0.152*** | -0.138** | |
| 0.098** | 0.098*** | 0.061*** | |
| -0.072*** | 0.009** | -0.006* | |
| ?BD | 0.023*** | 0.011** | 0.089*** |
| ?ICT | 0.097*** | 0.013*** | 0.011** |
| ?ED | 0.012** | 0.017*** | 0.023 ** |
| ECT(-1) | 0.452*** | 0.342** | 0.293** |
| (Wald) symmetry test | |||
| 14.981*** | 12.192*** | 22.132[0.000] | |
| Panel – B: Long-run model coefficients | |||
| 0.393** | 0.105*** | 0.371*** | |
| -0.724*** | -0.079*** | -0.477*** | |
| 0.231** | 0.093*** | 0.072*** | |
| -0.113*** | -0.113*** | -0.173*** | |
| BD | 0.113*** | 0.092*** | 0.009*** |
| ICT | 0.004* | 0.023*** | 0.115*** |
| ED | 0.073** | 0.098** | 0.005** |
| Symmetry test | |||
| 23.112*** | 16.157*** | 12.983*** | |
| 11.627*** | 14.114*** | 13.883*** | |
| AR(1) Prob > Z | 0.002 | 0.004 | 0.000 |
| AR(1) Prob > Z | 0.752 | 0.861 | 0.767 |
| Hansen Test Prob > Chi2 | 0.456 | 0.967 | 0.576 |
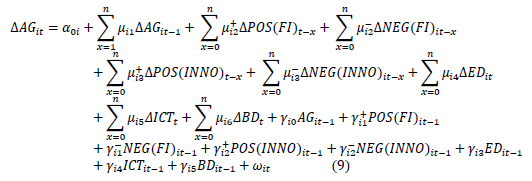
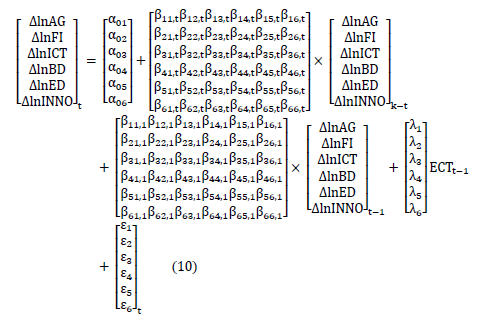
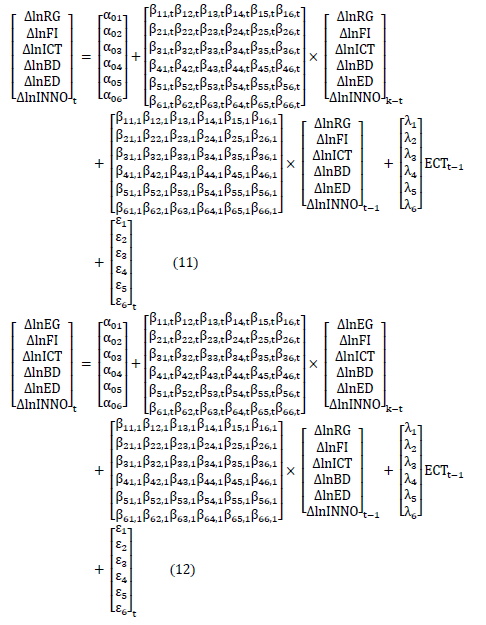
Dynamic Panel Error Correction Estimation
I perform a Granger causality test under a panel error correction model (P-ECM) to establish the directional causality between SME's growth, financial innovation, and a set of control variables. Table 14 exhibits the estimation results of the Granger causality test under P-ECM. Studies perform both short–run and long–run directional causality.
For long-run causality, the lagged error correction term specifies the existence of long-run causality in the equation or not. The ECT (t-1) should be negative and statistically significant to ascertain long-run causality from the explanatory variable to the dependent variable. The study revealed several long-run causality models, especially when SMEs growth is a dependent variable in the equation representing three proxy variables. These findings suggest that SME growth can cause any deviation experience in financing innovation, business innovativeness, an adaption of ICT, an initiative for business development, and investment for employee development in the long run. Furthermore, the study also divulged the long-run causality model when financing innovation was treated as the dependent variable in the case of all three proxy growth models. The causality ascertains in the equation when the dependent variable considers SME's growth and financing innovation. This result confirms bidirectional causality between SMEs' growth and financing innovation in the long run.
| Table 14 Results of Causality Test Under P-ECM |
||||||||
|---|---|---|---|---|---|---|---|---|
| Short-run causality test | Long-run causality | |||||||
| RG | FI | ICT | INNO | ED | BD | ECT(t-1) | Remarks | |
| Model – I: Revenue growth as a proxy for SMEs growth | ||||||||
| RG | 7.4921** | 1.0109** | -2.7402** | -3.3710 | 12.7722** | -0.6377** | Presence | |
| FI | 8.6844** | 1.224 | 0.1911 | 5.8802 | 2.1901 | -0.2311** | Presence | |
| ICT | 1.5875 | 6.0122** | 0.5712 | 1.9687** | 14.0241 | 0.5212 | Absent | |
| INNO | 0.4641 | 5.3144** | 2.2974 | 0.4222 | 12.575** | -0.4297** | Presence | |
| ED | 5.8854** | 3.5774* | 1.0521 | 0.2187 | -0.5857 | -0.16** | Presence | |
| BD | -2.7221 | 1.3378** | 3.1411 | 0.8984 | 10.1922** | -0.14** | Presence | |
| Model – II: Assets growth as a proxy for SMEs growth | ||||||||
| AG | FI | ICT | INNO | ED | BD | |||
| AG | 4.4911** | 11.64** | 4.42** | 10.35** | 14.82* | -0.1774* | Presence | |
| FI | 5.4887** | 0.3352 | 0.3177 | 1.7422 | 0.1237 | -0.2711 | Presence | |
| ICT | 2.2454 | 0.7754 | 13.2233** | 1.7497 | 1.3574 | -0.15** | Presence | |
| INNO | 13.3966** | 5.0421** | 1.82 | 0.7241 | 2.0187** | 0.7441 | Absent | |
| ED | 0.4574 | 3.2622** | 0.59 | 0.1587 | 1.0427** | -0.97** | Presence | |
| BD | 0.2254 | 2.0812 | 12.71** | 12.89** | 2.321 | 0.5594 | Absent | |
| Model – III: Employee growth as a proxy for SMEs growth | ||||||||
| EG | FI | ICT | INNO | ED | BD | |||
| EG | 4.3874** | 0.5311 | 10.2221** | 7.1887** | 12.9401** | -0.2720** | Presence | |
| FI | 2.8455** | 12.34** | 0.0687 | 0.1187 | 0.5698 | -1.2101 | Presence | |
| ICT | 14.7341** | 1.7211 | 2.2654 | 5.1655** | 31.2957** | -0.6707** | Presence | |
| INNO | 0.1145 | 1.3121 | 2.1547 | 10.4174** | 2.5244 | 0.2145 | Absent | |
| ED | 10.03** | 13.5887** | 10.9122** | 0.3774 | 0.9871 | -0.9635** | Presence | |
| BD | 3.3921 | 8.8855** | 0.7687 | 2.1674 | 1.9454 | -0.5511** | Presence | |
The summary of the short-run causality test results exhibits in Table XV. Like long-run causality, the study also confirms several causal relationships between a pair of variables tested in the short-run causality test.
For the revenue growth model: Study unveiled bidirectional causality between revenue growth and financing innovation [RGßà FI], revenue growth and business development [RGvßàBD], financing innovation and business innovativeness [FI ßà INNO], business innovation and business development [1NNOßàBD], investment in ICT and business development [ICTßàBD], and employee development and business development [EDßàBD]. Besides, the study also disclosed unidirectional causality from business innovation to revenue growth [RG ß INNO], employee development to the growth of SMEs [RG ß ED], Financing innovation to ICT adaptation [FI àICT], financing innovation to employee development [FI à ED], business development to financing innovation [FI ß BD], and employee development to business innovativeness [1NNO ß ED]
For assets growth: The study introduces bidirectional causality between Financing innovation and business development [FIßàBD], SMEs growth and financing innovation [AGßàFI], SMEs growth and business innovativeness [AG ßàINN], SMEs growth and employee development [AG ßàED], Financing innovation and business innovativeness [FI ßà INNO], and Employee development and business development [ED ßà BD]. Furthermore, the study also discover unidirectional causality from SMEs growth to ICT adaption in the business [AG à ICT], business development to SMEs growth [AG ß BD], business innovativeness to business development [1NNO à BD], business development to ICT incorporation in operation [ICT ß BD], and financing innovation to employee development [FI à ED]
For employee growth: The study revealed bidirectional causality between SMEs growth and financing innovation [EG ßà FI], SMEs growth and ICT integration in the business process [EG ßà ICT], financing innovation and business innovativeness [FI ßà INNO], business innovativeness and employee development [1NNO ßà ED], business development and business innovativeness [1NNO ßàBD], and employee development and business development [ED ßà BD]. Likewise, the study also uncovered unidirectional causality from business innovativeness to SMEs growth [EGßINN], business development to SMEs growth [EGß BD], financing innovation to ICT adaption in the business process [FI à ICT], and Business development to financing innovation [FI ß BD].
| Table 15 Summary Results Of The Short-Run Causality Test |
|||||
|---|---|---|---|---|---|
| Revenue growth | Asset growth | Employee growth | |||
| Causality test | Results | Causality test | Results | Causality test | Results |
| RG VS FI | RGßà FI | AG VS FI | AG ßà FI | AG VS FI | AG ßà FI |
| RG VS INNO | RG ß INNO | AG VS INNO | AG ßà INNO | AG VS INNO | AG ß INNO |
| RG VS ICT | AG VS ICT | AG à ICT | AG VS ICT | AG ßà ICT | |
| RG VS ED | RG ß ED | AG VS ED | AG ßàED | AG VS ED | |
| RG VS BD | RG ßà BD | AG VS BD | AG ßà BD | AG VS BD | AGß BD |
| FI VS INNO | FI ßà INNO | FI VS INNO | FI ßà INNO | FI VS INNO | FI ßà INNO |
| FI VS ICT | FI àICT | FI VS ICT | FI VS ICT | FI à ICT | |
| FI VS ED | FI à ED | FI VS ED | FI à ED | FI VS ED | |
| FI VS BD | FI ß BD | FI VS BD | FI ßà BD | FI VS BD | FI ß BD |
| INNO VS ICT | INNO VS ICT | INNO ß ICT | INNO VS ICT | ||
| INNO VS ED | INNO ß ED | INNO VS ED | INNO VS ED | INNO ßà ED | |
| INNO VS BD | INNO ßà BD | INNO VS BD | INNO à BD | INNO VS BD | INNO ßàBD |
| ICT VS ED | ICT VS ED | ICT VS ED | |||
| ICT VS BD | ICT ßà BD | ICT VS BD | ICT ßà BD | ICT VS BD | |
| ED VS BD | ED ßà BD | ED VS BD | ED ßà BD | ED VS BD | ED ßà BD |
Granger-causality test panel data assuming the error correction model (P-ECM) specify the directional causal relationship between a pair of variables in the study. In particular, I investigate the causality between financing innovation and SMEs growth considering firm-level information. Both in the long and short-run studies found evidence in favor of bidirectional causality between SMEs growth and the availability of alternative financing opportunities in the economy. The bidirectional causality ascertains all three indicators used to measure SMEs' growth. These study findings advocate for financing innovation in SME financing so that access to credit facilities can boost a small business process with perpetual development.
Theoretical Contribution
Growth and development need investment, which necessitates long-term finance in technological upgrades, asset acquisition, new market development, capacity expansion, and diversification. It is important to examine the capital structure of SMEs since it indicates the nature of long-term financing choices. The variables influencing a company's leverage are mainly examined regarding a company's capital structure (Michaelas et al., 1999). The notion of "leverage" or "gearing" refers to borrowing money to buy assets with the expectation that the assets' income would be higher than the cost of borrowing. This is risky since the assets' income stream, or capital gain is frequently uncertain, and the debt is likely to have continuing principal and interest expenses. (Bhaird & Lucey, 2010). The issue of obtaining financing cannot be explained only by capital structure factors. It necessitates comparing the current capital structure with the desired capital structure. The existing capital structure represents a firm's current preference for readily available financial resources, while the preferred capital structure encompasses all available sources of money in the market. Firms may solve the issue of insufficient and timely financing if their current and preferred capital structures are the same. As a result, a company may meet its financial obligations while also addressing a variety of other problems linked to growth and development. Existing literature suggests that SMEs' sustainability relies on firms' accessibility and capacity to utilize external financial opportunities (Beck, 2007; Klonowski, 2012).
Financial decision-making, according to Sapienza, et al., (2003), is a critical asset for corporate success, and quantitative research has demonstrated that small companies perform better when they utilize external financial facilities that are available to them. An SME uses loan and equity financial resources to generate revenue and develop insurance while expanding and funding new entrepreneurial operations. As a result, innovation often necessitates workers' technical knowledge. At the same time, anticipated cash flow (a source of funding) is a component of small and medium-sized businesses, where owners, managers, and employees may and should utilize it to start and expand the business. The characteristics of SMEs will change as businesses expand and impact the financing sources available to entrepreneurs. Every organization's long-term viability is largely determined by SME owners' desire to properly manage working capital components (Vishnani & Shah, 2007). Operational capital availability ensures the business has adequate resources to continue its operations related to acquiring and disbursing funds; thus, firms categorize their financing choices to meet its requirements. SMEs with higher operational capital concentrations may boost sales and provide early payment reductions, increasing their value and achieving growth sustainability in the long run (Chen & Chen, 2011).
Conclusion and Implications
The motivation of the study is to signify the effects running from excess to external finance and innovativeness in operation on firm performance. The key findings of this study are as follows:
First, the panel unit root test results confirmed variables are in a mixed order of integration. Furthermore, the long-run association is confirmed by the results of the panel cointegration test, implying that in the long run, all the variables are SMEs growth, innovative finance, innovation, business development, ICT adaption, and employee development move together.
Second, we performed baseline model estimation with Dynamic Ordinary Least square and fully-Modified Ordinary Least Square (FM-OLS). Study findings revealed a positive relationship, particularly innovative finance, innovation, and SME growth. This conclusion regarding positive effects is valid for all three empirical models, with a different proxy of SMEs' growth.
Third, empirical model estimation with the nonlinear framework proposed by shin for investigating asymmetric relation between innovative finance, innovation and SMEs growth. Study findings divulged that asymmetric effects run from innovative finance and innovation to SMEs growth in the long run. Moreover, this conclusion is applicable for all three empirical models estimating. On the other hand, asymmetry effects were observed in explaining the relationship between innovation and SME's growth for all proxies in the short run. However, innovative finance only exhibits asymmetry for revenue growth and employee growth as a proxy for SMEs growth.
Fourth, consider the result of the Granger-causality test under the error correction term. Study findings hold a feedback hypothesis for explaining innovative finance and SME growth. These findings include all the three proxy measures established bidirectional causality running between innovative finance and proxy measures. Furthermore, bidirectional causality also appears between innovation and asset growth and employee growth but unidirectional causality from innovation to revenue growth.
These study findings have managerial and policy formulation implications. Study findings establish that innovativeness in SME financing is critically important for SMEs' growth and remaining sustainable. Thereby, policy formulations surrounding SMEs financing are obvious to feel their perspective effects and create ample opportunities for easy access to funds. Considering managerial perspective, study findings suggest that innovation accelerates the firm's growth; therefore, managers keen to perform by maintaining sustainable profitability should put considerable effort into organizational innovativeness.
It is important to note that readers should be cautious when generalizing the results to different cultural contexts. Further, the sample size is relatively small because I only consider manufacturing units. However, the reality is that in Bangladesh, there are hundreds of SMEs who are doing business with service. Therefore, future research should broaden the scope by studying the impact of innovative finance innovation on SMEs' growth within different industries.
Acknowledgment
Data availability statement: The data that support the findings of this study are available from the corresponding author upon reasonable request.
Funding: The study received a research grant from The Institute of Advanced Research (IAR), United International University (Grant Reference: UIU/IAR/01/2021/BE/08)
References
References
Abor & Quartey. (2010). Issues in SME Development in Ghana and South Africa. International Research Journal of Finance and Economics, 218–228.
Abubakar, A., & Gani, I.M. (2013). Impact of banking sector development on economic growth: Another look at the evidence from Nigeria. Journal of Business Management & Social Sciences Researc, 2, 47-57.
Afolabi, A.A., & Oni, E.O. (2015). Effect of micro-finance banks on micro, small and medium scale enterprises (MSMEs) in Nigeria . 141-156.
Ahiabor G. (2013). The impact of microfinance on the development of small scale enterprises in the Ledzorkuku-Krowor Municipality in the Greater Accra Region of Ghana. European Journal of Business and Management, 5, 165-172.
Alayo, M., Iturralde, T., & Maseda, A. (2021). Innovation and internationalization in family SMEs: Analyzing the role of family involvement.European Journal of Innovation Management ahead-of-print.
Andriamahery, A., & Qamruzzaman, M. (2022). Do access to finance, technical know-how, and financial literacy offer women empowerment through women’s entrepreneurial development?Frontiers in Psychology, 12.
Crossref, GoogleScholar, Indexed at
Anheier, H.K., & Seibel, H.D. (1987). Small scale industries and economic development in Ghana. Saarbruckh, Germany. Verlag Breitenbech.
Arellano, M., & Bover, O. (1995). Another look at the instrumental variable estimation of error-components models.Journal of Econometrics, 68, 29-51.
Crossref, GoogleScholar, Indexed at
Asikhia, O.U. (2010). SMEs and poverty alleviation in Nigeria: Marketing resources and capabilities implications. New England Journal of Entrepreneurship, 13, 7.
Crossref, GoogleScholar, Indexed at
Awuah. S.B., & Addaney, M. (2016). The interactions between microfinance institutions and small and medium scale enterprise in the Sunyani Municipality of Ghana. Asain Development Policy Review, 4, 51-64.
Crossref, GoogleScholar, Indexed at
Babalola, O.S. (2014). The role of small and medium scale enterprises in Nigerian economic development. Journal of Educational Review, 7, 455-466.
Bahmani-Oskooee, M., & Mohammadian, A. (2016) Asymmetry effects of exchange rate changes on domestic production: Evidence from nonlinear ARDL approach. Australian Economic Papers, 55, 181-191.
Bangladesh Bank. (2021). SME financing reropt - 2021. Bangladesh.
Bangladesh Bureau of Statistics. (2017). National accounts statistics - Bangladesh bureau of statistics. Yearly. Bangladesh: Bangladesh Bureau of Statistics, 250.
Barbera, F., & Hasso, T. (2013). Do we need to use an accountant? The sales growth and survival benefits to family SMEs.Family Business Review, 26, 271-292.
Crossref, GoogleScholar, Indexed at
Bardhan, I., Lin, S., & Wu, S-L. (2014). The quality of internal control over financial reporting in family firms. Accounting Horizons, 29, 41-60.
Crossref, GoogleScholar, Indexed at
Beck, T., & Cull, R. (2014). Small-and medium-sized enterprise finance in Africa. Global Economy and Development Program, 16.
Beck, T.H.L. (2007). Financing constraints of SMEs in developing countries. Financing innovation-oriented businesses to promote entrepreneurship, 1-36.
Bello, G.B. (2013). An assessment of the contribution of micro finance institute on the growth of the small and medium enterprise. International Journal of Innovative Research in Management, 2, 16-23. GoogleScholar
Bigliardi, B. (2013). The effect of innovation on financial performance: A research study involving SMEs.Innovation, 15, 245-255.
Crossref, GoogleScholar, Indexed at
Blundell, R., & Bond, S. (1998). Initial conditions and moment restrictions in dynamic panel data models. Journal of Econometrics, 87, 115-143.
Crossref, GoogleScholar, Indexed at
Branzei, O., & Vertinsky, I. (2006). Strategic pathways to product innovation capabilities in SMEs. Journal of Business Venturing, 21, 75-105.
Crossref, GoogleScholar, Indexed at
Breitung, J. (2001). The local power of some unit root tests for panel data. Nonstationary panels, panel cointegration, and dynamic panels. Emerald Group Publishing Limited, 161-177.
Crossref, GoogleScholar, Indexed at
Brown, W.S. (2018). Socially responsible entrepreneurship as innovative human resource practice. The Journal of Applied Behavioral Science, 54, 171-186.
Chen, S-Y., & Chen, L-J. (2011). Capital structure determinants: An empirical study in Taiwan. African Journal of Business Management, 5, 10974-10983.
Cheng, J., & Frianeza, C. (2014). How Hong Kong small businesses are growing in the digital economy. Connected Hong Kong SMEs. Ipsos Business Consulting, 31.
Choi, I. (2001). Unit root tests for panel data. Journal of International Money and Finance, 20, 249-272.
Crossref, GoogleScholar, Indexed at
Coke-Hamilton, P. (2013). SME competitiveness in the Caribbean: Challenges and opportunities. IDB INTAL publication, 37, 1-4.
D’Angelo, A. (2012). Innovation and export performance: a study of Italian high-tech SMEs. Journal Of Management & Governance, 16, 393-423.
Crossref, GoogleScholar, Indexed at
Damanpour, F., & Evan, W.M. (1984). Organizational innovation and performance: The problem of "organizational lag".Administrative Science Quarterly, 392-409.
Crossref, GoogleScholar, Indexed at
Elaian, K. (1996). Employment implications of small scale industries in developing countries: Evidence from Jordan.Science, Technology and Development, 14, 80-101.
Eniola, A.A. (2018). Entrepreneur-SME manager traits and sources of financing. In: Dana L-P, Ratten V and Honyenuga BQ (eds) African Entrepreneurship: Challenges and Opportunities for Doing Business. Cham: Springer International Publishing, 223-259.
Eniola, A.A., & Entebang, H. (2015).SME firm performance-financial innovation and challenges. Procedia - Social and Behavioral Sciences, 195, 334-342.
Crossref, GoogleScholar, Indexed at
Escribano, A., Fosfuri, A., & Tribó, J.A. (2009). Managing external knowledge flows: The moderating role of absorptive capacity.Research Policy, 38, 96-105.
Eton, M., Ayiga, N., Moses, A., et al. (2019). Small Medium Enterprises (SMEs), environmental management and poverty reduction in Western Uganda.
Eze, T.C., & Okpala, C.S. (2015). Quantitative analysis of the impact of small and medium scale enterprises on the growth of Nigerian Economy: (1993-2011). International Journal of Development and Emerging Eco, 3, 26-38.
Fang, L., & Qamruzzaman, M. (2021). An asymmetric investigation of remittance and trade openness impact on inequality: Evidence from selected South Asian Countries. Frontiers in Psychology, 12.
Freel, M.S., & Robson, P.J. (2004). Small firm innovation, growth and performance: Evidence from Scotland and Northern England.International Small Business Journal, 22, 561-575.
Gerba, Y., & Viswanadham, P. (2016). Performance measurement of small scale enterprises: Review of theoretical and empirical literature.International Journal of Applied Research, 2, 531-535.
Gockel, A.G., & Akoena, S.K. (2002). Financial intermediation for the poor: Credit demand by micro, small and medium scale enterprises in Ghana. A further assignment for financial sector policy?. International Labour Organisation.
Granger, C.W., & Newbold, P. (1974). Spurious regressions in econometrics. Journal of Econometrics, 2, 111-120.
Harash, E., Al-Timimi, S., & Alsaadi, J. (2014). The influence of finance on performance of small and medium enterprises (SMES).Technology, 4, 161-167.
Hartšenko, J., & Sauga, A. (2014). The role of financial support in SME and economic development in Estonia.Business and Economic Horizons, 9, 10-22.
Hassan, B., & Mohamed, B. (2015). Role of SMEs in the economic and social development: Case of Terroir Products in Souss Massa Draa Region (Morocco).Advances in Economics and Business, 3, 340-347.
Crossref, GoogleScholar, Indexed at
Hult, G.T.M., Hurley, R.F., & Knight, G.A. (2004). Innovativeness: Its antecedents and impact on business performance.Industrial marketing management, 33, 429-438.
Crossref, GoogleScholar, Indexed at
Hussaina, I., Sib, S., & Wangc, L. (2010). SMEs development in developing countries through public - private partnership.Chines Economic Review, 10, 1-25.
Im, K.S., Pesaran, M.H., & Shin, Y. (2003). Testing for unit roots in heterogeneous panels. Journal of Econometrics, 115, 53-74.
Jerome, N., & Timothy, V. (2019). Perceived impact of entrepreneurship on the performance of Small and Medium Enterprises (SMEs) In Nigeria. Advances in Social Sciences Research Journal, 6.
Jia, Z., Mehta, A.M., & Qamruzzaman, M., et al. (2021). Economic policy uncertainty and financial innovation: Is there any affiliation? Frontiers in Psychology, 12, 1781.
Jiménez-Jiménez, D., & Sanz-Valle R. (2011). Innovation, organizational learning, and performance. Journal of Business Research, 64, 408-417.
Crossref, GoogleScholar, Indexed at
Johari, H. (2012). The role of Small and Medium Enterprises (SME) in the country's economic development. Journal of Basic and Applied Scientific Research, 2, 10279-10287.
Received: 09-Mar-2021, Manuscript No. AEJ-22-11302; Editor assigned: 12-Mar-2021, PreQC No. AEJ-21-11302 (PQ); Reviewed: 15-Mar-2022, QC No. AEJ-21-11302; Revised: 22-Mar-2022, Manuscript No. AEJ-21-11302 (R); Published: 13-Apr-2022