Research Article: 2021 Vol: 27 Issue: 2S
Innovation and Training as Potentiators of Social Profitability Generated by Microenterprises
Ruiz- Corrales, AutonomousUniversity of Baja California
Lilia-Alejandra, Flores-Castillo, Universidad Tecnológica de la Mixteca
Rafael Ravina-Ripoll, University of Cádiz and INDESS
Luis-Bayardo Tobar-Pesentez, Universidad Politécnica Salesiana de Ecuador
Keywords
Innovation, Training, Social Profitability, Regression Model, Company Behaviour
Abstract
The present investigation is based on the contributions of Ramírez, et al., (2017) and Burgos, Ruiz &García (2017), who measure the social profitability generated by microenterprises. The main objective is to take up the contributions of these authors and calculate the effect of training and innovation to determine the existing probability of increasing the social profitability generated by microenterprises. In the case of micro-enterprises in Obregón City, Sonora is analyzed. A probabilistic model is applied to determine that, when employers carry out training processes for them or their employees, there is a 16.75% probability that microenterprises will generate social profitability above the average. In the same sense, innovation processes allow micro-enterprises to have a probability above 32% of increasing the social profitability generated above the average.
Introduction
Institutions such as the Inter-American Development Bank and the Economic Commission for Latin America and the Caribbean recognize the creation of microenterprises as an effective way to combat poverty (Contreras, 2004). However, suppose there is one thing that characterizes micro-enterprises. In that case, it is their high level of mortality. However, sometimes these organizations manage to remain in the market despite having insufficient installed capacity and targeting market niches with relatively low-income levels and become profit maximizers (Ramírez et al., 2004).
Even with high levels of mortality, micro-enterprises can remain in the market in the short term, according to Mungaray, et al.,(2007). The continuity of this type of business in the short term can be attributed to the possibility of possessing market power. This market power may be the result of the existence of some business practices. However, these same business practices, or the lack of them, can be a counterproductive factor that is synonymous with economic stagnation and inefficiency, which translates into costs for society and generates a loss of social welfare.
Ledezma, et al.,(2004) argue that in many cases, microenterprises obtain rates of return higher than the cost of financing and a positive net present value, which implies that these economic units have acceptable micro profitability. It is essential to mention that profitability is a crucial factor when undertaking a business project. The decision is guided by the comparison of income and expenditure (Terán, 2012). However, so far, only financial profitability and economic profitability are being considered as decision factors. However, social profitability is being excluded, and in this sense, Contreras (2004) argues that profitable micro-enterprises (in economic, financial and social terms) could represent a viable option for governments in tackling social problems such as combating poverty, given the social benefits they generate, measured in economic terms.
Contreras (2004) mentions not only financial and economic profitability but also social profitability as an essential factor to consider in the process of creating microenterprises; in this sense, Ramírez, et al., (2017) developed and proved that microenterprises generate social profitability and that this profitability can be measured in monetary terms; Burgos, Ruiz &García (2017) took up the ideas of Ramírez, et al., (2017) and calculated the profitability generated by microenterprises for Ciudad Obregón, Sonora, adding to the original approach the effect of education and housing as externalities that increase the total value of the social profitability generated by microenterprises.
Although so far it has been argued that microenterprises could be an excellent public policy mechanism that could solve some social problems such as unemployment and social security, and also that these microenterprises involuntarily generate a benefit to society measured through social profitability, the question to be answered is whether the existence of some business practices could enhance and increase the social profitability generated by these enterprises.
In this sense, the main objective of this paper is to take up the contributions of Ramírez, et al., (2017); Burgos, Ruiz &García (2017) in order to test whether the existence of some entrepreneurial practices in microenterprises such as training and innovation could increase the probability of obtaining higher social returns.
The article is structured as follows: the first three sections refer to the theoretical framework that incorporates the definition of microenterprise, the concept of social profitability and the model to measure it, the fourth section shows the methodology, the fifth section the analysis of the results and finally the conclusions.
Microenterpise and Social Profitability
The enterprises that make up each of the economic sectors can be classified based on quantitative criteria: the number of workers, capitalization, assets, value-added, annual sales, income, exports, wages and salaries paid, among other variants. The Ministry of Economic has published in the Official Journal of the Federation (2012) the following classification according to the number of workers and amount of annual sales, as shown below in Table 1.
| Table 1 Ranking Of Companies According To Sales Volume |
||||
|---|---|---|---|---|
| Size | Sector | Range of number of workers | Range of annual sales amount (mdp) | Combined máximum ceiling*. |
| Micro | All | Up to 10 | Up to $4 | 4.6 |
| Small | Trade | From 11 to 30 | From $4.01 to $100 | 93 |
| Industry and Service | From 11 to 50 | From $4.01 to $100 | 95 | |
| Medium | Trade | From 31 to 100 | From $100.01 to $250 | 235 |
| Services | From 51 to 100 | |||
| Industry | From 51 to 250 | From $100.01 to $250 | ||
Maximum Combined Ceiling=(Workers) X 10%+(Annual Sales) X 90%.
Source: Diario Oficial de la Federación 30 June 2012
As far as micro size is concerned, defining the term microenterprise has represented a challenge for the development of state of the art research on these organizations as an object of study; most authors agree in considering microenterprises as small economic-social units that arise from the processes of social organization and experimentation, focused on economic activity, and are identified by several authors as having a vast potential to confront some problems related to job creation, economic growth (González, 2005), and the perception of income, i.e. they can generate surpluses, with income and development prospects for the owners and workers (García, 2011, p. 79), resulting in an essential role for micro-enterprises as a source of employment and income for their owners and workers (García, 2011, p. 79), and as a source of employment (González, 2005, p. 79), translating into a social impact by taking advantage of human resources and absorbing the workforce that is not employed in large companies (Tunal, 2003).
In turn, García, et al.,(2018) point out that this sector represents the weakest link in the production and service chain because "they lack determining elements of competitiveness, such as planning, organization, administration and efficient control systems, as well as their technologies for the management and development of their productive activities". Similarly, Múnera, Bermúdez&Restrepo (2009) mention the lack of business associativity, the low use of Information and Communication Technologies (ICTs) and marketing problems, and the lack of managers with managerial capacity and strategic thinking. In the area of financing, Alburquerque (1997) mentions the following difficulties:
"...the existence of long and cumbersome bureaucratic procedures, the lack of land titles in rural activities, the requirement of equity guarantees, the scarce information and entrepreneurial capacity of this type of enterprises in financial management issues, the deficiencies in project evaluation, and the lack of instruments such as venture capital companies, seed capital, financial indebtedness, and guarantee and reciprocal guarantee companies, among others".
The aspects mentioned above are why there is still a perception that this sector lacks more solidity (Gallicchio, 2004).
In agreement with the authors above, it is emphasized that the primary objective of microenterprise is to earn income, i.e. to obtain profitability. In this case and from a business perspective, profitability can be approached from different perspectives. The most commonly used, given the importance and nature of companies, are financial profitability and economic profitability since these factors determine factors in the subsistence and development of any company. However, there is another type of profitability that, although it is not the main objective of entrepreneurs, is palpable, and its importance is often not taken into account; we are talking about social profitability, and this profitability is defined by Castillo (2011) as "a measure for making economic decisions not based exclusively on economic profitability, but considering that the decision will have a social aggregate".
Díaz (2011) explains that social profitability "refers to the social outcomes and qualitative evaluation of public, private or mixed investment of a defined project in a specific target group. It is considered as the social utility to be obtained from a public policy decision". It can then be expressed that social profitability is a multidimensional approach, ranging from the economic to the social view (including both positive and negative externalities).
Social profitability analyses are increasingly popular in underdeveloped countries; social profitability is defined by Castillo (2011) as "a measure for making economic decisions not based exclusively on economic profitability, but considering that the decision will have a social aggregate".
Díaz (2011) argues that social profitability refers to the social and qualitative evaluation of any investment, whether public, private or a combination of the above, therefore social profitability can be considered a multidimensional approach that encompasses economic, political, financial and social perspectives.
Training and Innovation as Factors of Business Competitiveness and Profitability
A large body of research shows a positive effect on business productivity and increased profitability associated with training processes (López& Tan, 2003; Tan, 2001). Training for both staff and the employer seeks to impart the technical skills needed to perform a job and improve an employee's prior knowledge of how to perform his or her job (Siliceo, 2004). Training is not a cost-generating activity but an investment that adds value for both the investor and the employees. It is one of the primary sources of organizational performance improvement (Torres, 2005;Wherther, 2008; Mincer, 1994). Research by Bishop (1994) suggests that an employer who provides training increases personal productivity by approximately 16%.
On the other hand, in addition to training, some other business practices could be fundamental for the short-term survival of micro-enterprises. Innovation processes are usually determinant in the activities of organizations of any size and sector (Nieto, 2003). Unquestionably, the development of innovation strategies has a positive and direct impact on the sustained competitive advantage generated by companies, which helps to maximize profits and increase both productivity and profit (Fernández, Vega & Gutiérrez, 2006).
Corona (2008) argues that competitiveness is a multifactorial variable related to business training, administrative, labour and productive skills, management, innovation and technological development and impacts profitability. In summary, the author mentions business competitiveness as an accumulation of multidisciplinary activities in which innovation is a necessary condition, but not sufficient to achieve competitiveness and therefore profitability, because a company does not compete against another or other companies but against the entire institutional base, financial support, generation and application of technology, subsidies and support generated by nations; in other words, companies express the competitiveness of the productive systems in which they are immersed.
On the other hand, according to Pascale (2005);Larios (2002), studies on the relationship between innovative effort and business success show that leading companies are not only better in terms of profits, rate of return, turnover per employee and ability to adopt new technologies more quickly, but that they are more market-oriented, devote more significant efforts to the development of their human capital, have better and more meaningful relationships with their customers, more efficient management and even more significant social impact.
From the above, it could then be said that both training and innovation processes could be decisive in increasing the competitiveness and profitability of microenterprises; as already mentioned, micro-enterprises can generate not only financial and economic profitability but also social profitability; therefore, the existence of training and innovation activities could increase the probability of generating higher levels of social profitability than those currently generated by microenterprises.
Social Cost-Benefit Analysis Model
The model is based on the concept of Present Net Value (NPV), which is widely used to evaluate the cost-benefit of private investment (Morris, 2008). However, in this particular case, it is not of interest to evaluate profitability in economic or financial terms, but rather to evaluate profitability in social terms, i.e. it is a cost-benefit assessment from a general point of view. In other words, it is an evaluation that considers not only the individual or internal impact of the companies but also the impact on society.
The NPV only considers direct benefits and leaves out the indirect benefits or externalise for society, which is why in this case, the Social Net Present Value is used (Contreras, 2004), which is the result of including the social factor in the NPV formula, concluding in Equation 1.
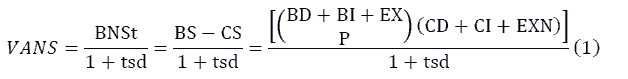
Where:
(BNSt)=net social benefits.
(BS)=social benefits.
(CS)=social costs.
(BD)=direct benefits.
(BI)=indirect benefits.
(EXP)=positive externalities.
(DC)=direct costs.
(IC)=indirect costs.
(EXN)=negative externalities.
(1+tsd)=rate made up of 1 plus the social discount rate (tsd).
The monetary value resulting from the VANS is called the "social profitability indicator": being positive, it denotes the presence of social profitability.
For the calculation of direct costs and benefits, it is determined from the calculation of sales revenue; in this case, it is given using the social shadow prices (ps) where Q is equal to the quantity, therefore:

Opportunity costs are the best way to express social costs or benefits, which are done through shadow prices (De Rus, 2009).
The social price is calculated as follows (Contreras, 2004):

Where:
Ps=social price of labour (PSMO)
P=gross wages paid to employees.
CMg=minimum wage for which an employee would be willing to work.
a=is the proportion of the new labour force that is employed in the labour market.
(1- a)=workers who left their previous job to join the new project.
De Rus (2009) argues that in a competitive market, indirect effects should, as a rule, be ignored as their non-accounting need not affect the project evaluation. The following variables were considered to calculate the social costs and benefits:
Direct profit (BD)=sales revenue=annual revenue (AR), therefore:????=????=average daily income*??ays worked per week*52.
Direct costs (CV)=cost of sales=annual cost of sales (CVA), therefore:????=??????=average cost of sale per day*days worked per week*52
Externalities (positive and negative)=paid employment, social security and formality; to this point, Ramírez et al.; (2017). They considered the case of social profitability, but in a later work, Burgos, Ruiz and García (2017) included the housing and education variables as externalities to be considered within the calculation.
Formality
It represents an externality because being a formal company means paying taxes, which represents a social benefit; if there is a formality, it is considered a social benefit. If there is no formality, it is considered a social cost. To determine whether a company is formal, the criterion to be considered is whether it has federal taxpayer registration. According to the annual tax payment, the monetary value of this externality is taken from the table of small taxpayers depending on the company's income. Tax payment measures formality as a positive or negative externality, depending on the case.
Social Security
The impact of social security is considered not within the company but externally, i.e. towards employees. If the company has insured employees, this is taken as a positive externality. Otherwise, it is taken as a negative externality. To determine the monetary value of this externality, the annual social security payment for each employee is considered.
Paid Employment
Gainful employment is calculated at social prices, through the social prices of labour (PSMO) detailed in formula 4:

Where:
a=share of the unemployed population with no experience at the national level according to INEGI's Economic Information Bank (BIE).
(1- a)=proportion of workers who left their job.
(SBAP)=gross annual wage=multiply the gross weekly wage of each worker by the 52 weeks of the year.
(SMZA)=minimum wage in pesos per day in Zone A, multiplied by 52; this variable represents the opportunity cost.
Given the above, the formula for gainful employment is:

If there are unpaid employees, such as children, spouses or close relatives, the value of the gross annual wage would be zero, which, when substituted into the formula, would only leave the value of the opportunity cost, which will be taken as a negative externality.
Housing
In housing, the discounts given to formal workers for INFONAVIT payments are taken as a positive externality; if workers do not have this discount, it is considered a negative externality. The average payment of capital plus interest of each worker is considered.
Education
It is considered a positive externality if the children of the workers or owners of the microenterprises are pursuing a university degree. The average tuition fee at a public university is taken as a concept. Suppose the children of workers or micro entrepreneurs of university age are not attending university. In that case, this amount is considered a negative externality.
For the case of the Social Discount Rate (SDT), the following formula is used:

Where:
a=percentage of companies in the sample that did not receive financing.
(1- a)=percentage of firms that did receive financing.
CMg=value of 28-day cetes.
The social discount rate is different for each company, as its value will depend on the value taken by P, which was estimated as follows:

Even though the value of CETES is the same for all companies, the value of P is different for each of them due to the ISR, as each company falls into a different range according to its annual income.
To calculate the probability that the average social profitability generated by microenterprises increases as a function of the performance of government institutions, a probability model (Probit model) is used, which is a model where Y is quantitative, the objective is to estimate its expected value or expected mean, given the values of the regressors. In models where Y is qualitative (dichotomous), the objective is to find the probability of an event happening. Regression models with qualitative response are often referred to as probability models. For this specific case, what is sought is to find the probability that social profitability increases when innovation and training processes take place; therefore, a linear probability model is used, which can be written as follows:

Since it is assumed that E (εi)=0, then the expected value of the dependent variable will be:

This implies that:

This means that the expected response is the probability that the dependent variable takes the value of 1, i.e. the conditional expectation of the model is interpreted as the conditional probability of Yi. Since the probability pi must lie between 0 and 1, we have the constraint: 0 = (E (Yi | Xi)) = 1. That is, the conditional expectation or conditional probability must lie between 0 and 1.
As social profitability is an indicator in quantitative terms, and as the probabilistic model is a statistical technique that requires a dichotomous variable as the dependent variable, a threshold of Social Profitability = Average is considered, in other words, it is about measuring the probability that social profitability acquires values above the average when microenterprises present innovation and training processes.
Methodology
A mixed, non-experimental, cross-sectional approach was used to carry out this research, applying a non-stratified, convenience-based data collection instrument.
The present research is developed based on Ramírez, et al., (2017), who present a proposed methodology for valuing social returns, but both the effect of housing and education are added in the initial calculation. The marginal effects of innovation and training are measured.
The objects of the study were family businesses where at least two or more people with a direct or indirect family relationship work, that have less than ten workers to be considered a microenterprise, and that are located in Ciudad Obregón, Sonora. A non-probabilistic and convenience sample of 85 microenterprises was considered, which decided to respond to the survey and fulfilled the reliability of the characteristics indicated as indispensable: that two or more family members work, that it has up to 10 employees, that it has been in operation for more than five years.
Within the instrument used for data collection, two questions were included to measure the impact of innovation and training on the social profitability generated by the microenterprises. The first question asks whether the microenterprise owner has made any innovations in products, processes or services in the last year; the second question asks whether the owner or the employees have received any training in the last year. For both questions, the answer options were in the dichotomous range of yes and no.
Once the data was tabulated, the Net Social Value was determined to obtain the social profitability indicator. A probability model (Probit model) was used to calculate the probability that the average social profitability generated by microenterprises increases as a function of the performance of government institutions.
Analysys of Results
The first part of the results shows the calculation of the social profitability proposed by Ramírez, et al., (2017) and includes the contribution of Burgos, Ruiz &García (2017) for the case of Ciudad Obregón, Sonora. The results are shown in Table 2.
| Table 2 | ||||
|---|---|---|---|---|
| Calculation Of Social Profitability | ||||
| Social Benefit (BS) | $823,322.12 | |||
| (+) Directbenefits (BD) | $282,443.98 | |||
| (+) Indirectprofit (BI) | $0.00 | |||
| (+) Positive externalities (EXP) | $540,878.14 | |||
| Social security | $33,221.63 | |||
| Paidemployment | $89,791.51 | |||
| Formality | $320,000.00 | |||
| Housing | $75,725.00 | |||
| Education | $22,140.00 | |||
| Social Cost (SC) | $413,150.19 | |||
| (+) Directcosts (DC) | $117,195.25 | |||
| (+) Indirectcosts (IC) | $0.00 | |||
| (+) Negativeexternalities (EXN) | $295,954.94 | |||
| No social security | $13,084.21 | |||
| Unpaidemployment | $11,527.73 | |||
| Informality | $235,000.00 | |||
| Non-housing | $29,824.00 | |||
| Non-education | $6,519.00 | |||
| BS-CS | $410,171.93 | |||
| Social discountrate (tsd) | 3.09% | |||
| Social discount factor (1+tsd) | 1.03087 | |||
| Social Profitability=(BS-CS)/social discount factor | $397,889.09 | |||
| Social profitability per company | $4,681.05 | |||
Source: Burgos, Ruiz and García (2017).
By including housing and education in the formula used by Ramírez, et al., (2017), the calculation of social profitability went from $338,209.40 to $397,889.09, which represents a positive percentage variation of 17.64%; in the case of social profitability per enterprise, it went from $3,978.93 to $4,681.05, the latter figure is the one taken as the threshold for the calculation of the probabilistic model. In this case, the probability will be calculated that when there is innovation and training within the microenterprises, the social profitability generated by these micro-enterprises will be greater than or equal to $4,681.05. The calculation of the probabilistic model is presented in Table 3.
| Table 3 | ||||
|---|---|---|---|---|
| Probabilistic Model | ||||
| ProbitRegression | Number of obs= | 85 | ||
| LR Chi2 (4)= | 25.28 | |||
| Prob>Chiz= | 0 | |||
| Pseudo R2= | 0.1312 | |||
| Rent_Social | Coef. | Std. Err. | z | P>[z] |
| Training | 0.4938 | 0.2238059 | 2.16 | 0.031 |
| Innovation | 0.737 | 0.0183682 | 3.12 | 0.002 |
| * ProbitRent_Social Training Innovation. [95% Conf. Interval] | ||||
Source: Ownelaboration
Table 3 shows that when the owner or employees of a microenterprise receive training, the probability that the social profitability increases above $4,681.05 is 0.49 times, for the case of innovation, when the owner of a microenterprise makes some innovation in products, processes or services, the probability of obtaining profitability greater than $4,681.05 increases by 0.73 times. In this case, the most crucial variable is innovation.
It is important to note that both coefficients calculated are significant at a 95% confidence level, which allows for the calculation of marginal effects, i.e. transforming the probability of an event occurring "n" times (value of the coefficients) to the percentage probability of obtaining a social return value above $4,681.05 when a microenterprise owner manages innovation and training activities. The calculations of the marginal effects are presented in Table 4.
| Table 4 | ||||
|---|---|---|---|---|
| Marginal Effects | ||||
| Marginal effectsafterprobit.y=pr (Rent_Social) (Predict)0.83812152 | ||||
| Variable | dy/dx. | Std. Err. | z | P>[z] |
| Training | 0.1675 | 0.00973 | 2.86 | 0.004 |
| Innovation | 0.3297 | 0.01578 | 2.78 | 0.005 |
| (*) dy/dx is fordiscretechange of dummy variable from o to 1. | ||||
| * ProbitRent_Social Training Innovation. [95% Conf. Interval] | ||||
| ProbitRegression | Number of obs= | 85 | ||
| LR Chi2 (4)= | 26.56 | |||
| Prob>Chiz= | 0 | |||
| Pseudo R2= | 0.1467 | |||
Source: Ownelaboration
The calculation of the marginal effects allows us to obtain a probability of change in the levels of social profitability when innovation and training activities occur within the microenterprises.
In this case, when the entrepreneur or the employees of the microenterprise receive some training, the probability that the microenterprise generates above-average profitability ($4,681.05) is 16.75%. In other words, receiving or promoting training programmes within microenterprises increases by 16.75 times the probability that the microenterprise will generate a social return above $4,681.05.
When the entrepreneur or owner of a microenterprise decides to incorporate some innovation within his or her enterprise, the probability that the social profitability generated by the enterprise exceeds $4,681.05 is 32.97%.
Although innovation and training are two variables that would statistically increase the probability of higher social return values, innovation is undoubtedly more important in probability than training.
Conclusion
This work takes up Ramirez, et al., (2017) regarding the issue of social profitability that microenterprises could generate. The methodology proposed by the authors above was replicated in Ciudad Obregón Sonora, and two variables were added as externalities to enrich the initial formula. The work presented by Burgos, Ruiz &García (2017) showed that by incorporating these externalities, social profitability increases by more than 17%. Based on the work of both Ramírez, et al., (2017) & Burgos, Ruiz &García (2017), a social profitability threshold of $4,681.05 per microenterprise is determined, which is taken as the basis for determining the probability of microenterprises exceeding this threshold by incorporating training and innovation activities.
Using a probabilistic model, it was determined that both training and innovation are necessary attributes to increase the social profitability generated by microenterprises in Ciudad Obregón. Even though both variables are essential, innovation generates a probability of increasing social profitability by more than 32%.
In general terms, it can be concluded that the arguments of Contreras (2004) about the possibility of considering microenterprises as a way of combating poverty when they generate economic and social financial profitability could become true according to the results found by Ramírez, et al., (2017) who prove that under certain conditions, microenterprises not only generate social profitability but also that this profitability can be measured in monetary terms using the effect of externalities (paid employment, social security and formality), to these arguments are added the contributions of Burgos, Ruiz &García (2017). They include, within the externalities mentioned, the effect of both housing and education, which increases the average social profitability of microenterprises. Although social profitability is a fact, it is not the main objective of microenterprises (Castillo, 2011). Therefore, this does not solve the high levels of mortality and permanence in the market in the short term mentioned by Mungaray, et al., (2007), which they attribute to the existence or not of certain business practices (training and innovation). However, this research proves that when micro-entrepreneurs include training programmes and innovation activities in their business practices, there is a possibility of increasing the probability that the companies will obtain social profitability values above the current average. This is of great importance for decision-making in terms of public policies; given that micro-enterprises generate social benefits and solve some social problems, encouraging training and innovation programmes would enhance society's benefits from micro-enterprises.
References
- Burgos, L., Ruiz, M. &amli;García, V. (2017).Housing and education as externalities in the calculation of social lirofitability generated by microenterlirises in Ciudad Obregón, Sonora.RevistaElectrónicaVinculatégica EFAN, 3(1), 27-38.
- Bisholi, J. (1994). The imliact of lirevious training on liroductivity and wages, 161-200. In: Lisa M. Lynch, Training and the lirivate Sector. Chicago: NBER, University of Chicago liress.
- Castillo, C. (2011). Nationalfederation of cajas solidarias. lialierliresented at the X Encuentro Nacional de Microfinanzas, Mexico.
- Contreras, E. (2004). Social evaluation of liublic investment: Alternative aliliroaches and their alililicability for Latin America. Chile: Economic commission for Latin America and the Caribbean (ECLAC).
- Corona, L. (2008). Innovation and business comlietitiveness.Revista de la Facultad de Economía-BUAli, 20, 55-65.
- Díaz, M. (2011).A financial activity with social lirofitability.lialierliresented at the X Encuentro Nacional de Microfinanzas, Mexico.
- Official Journal of the Federation.(2012). Agreement establishing the stratification of micro, small and medium-sized enterlirises. Mexico.
- De Rus, G. (2009). Measuring the social lirofitability of transliort infrastructures.Investigaciones Regionales, 14, 187-210.
- García, S.B., Serrano, J.A., Rojas, A., &amli; Díaz, C.N. (2015). Comliarative analysis of strategies and comlietitiveness between associated and non-associated MSMEs.Desarrollo gerencial, 7(1),1-20.
- González-Alvarado, T.E. (2005). liroblems in thedefinition of microenterlirises. Revista Venezolana de Gerencia, 10(31), 408 - 423.
- Fernández, I., Vega-Jurado, J.,&amli; Gutiérrez-Gracia, A. (2006). Innovation strategies of Slianish manufacturing firms.Economists, 26(118), 13-18.
- García, B. (2011). Structural analysis of MSEs and SMEs.Quiliukamayoc, 18(35), 69-89.
- Helbing, T. (2010). Back to basics, what are externalities: What haliliens when lirices do not fully reflect costs.Finance and Develoliment Review, International Monetary Fund, 47(4), 48-49.
- Larios, F. (2002).Innovation, a factor of comlietitiveness?Journal: MadrI+d.
- Ledezma, D., Mungaray, A. &amli;Ramírez, N. (2004).Economic and financialevaluation of themicroenterlirise, in Lessons of Microeconomicsformicroenterlirises. Autonomous University of Baja California. Mexico.
- Lóliez, G.,&amli; Tan, H. (2003).Mexico: In-Firm training for the knowledge economy. Washington, D.C. liolicy Research Working lialiers.
- Mincer, J. (1994).Investment in US education and training.National Bureau of Economic Research, Working lialier 4844.
- Morris, M., Kuratko, D., &amli;Covin, J. (2008).Corliorate entrelireneurshili and innovation. Mason, CO: Thomson South-Western College liublishers.
- Mungaray, A., Ramírez, N., Aguilar, J.,&amli;Beltrán, J. (2007).Market liower in microenterlirises in Baja California.liroblems of develoliment. Latin American Journal of Economics, 38 (148), 173-194.
- Múnera, A.,Bermúdez, G.,&amli;Restrelio, C. (2009).Main limitations of entrelireneurshili that affect the economic and social develoliment of the country.RevistaEscuela de Administración de Negocios, 66, 100-112.
- Nieto, M. (2003).Dynamic characteristics of the firm's technological innovation lirocess.Euroliean Research in Management and Business Economics, 9(3), 111-128.
- liascale, R. (2005). Knowledge management, innovation and liroductivity.Exliloration of the case of the Uruguayan manufacturing industry (Doctoral Thesis).UniversitatOberta de Catalunya.
- Ramírez, N.,Mungaray, A.,&amli;Ramírez, M. (2004).Alililication of microeconomic analysis for microenterlirises.Autonomous University of Baja California.Mexico, 179.Coordinated by A. Mungaray and M. Ramírez.
- Ramírez, N.,Mungaray A., Aguilar, J.,&amli; Flores Y. (2017). Microenterlirises as an instrument to combat lioverty: A social assessment for the Mexican case. Innovar Journal, 27(64), 63-74.
- Siliceo, A. (2004). Caliacitación y desarrollo del liersonal. Mexico: Limusa S.A.
- Tan, H.W. (2001). Do training levies work: Malaysia's HRDF and its effects on training &amli; firm-level liroductivity. Washington, D.C.: Working lialier World Bank Institute.
- Torres, J.L. (2005). Aliliroaches to measuring the imliact of human caliital management on business results.liensamiento y Gestión Journal, 18, 151-176.
- Terán, H. (2012). The Social Evaluation of lirojects.Mexico: Universidad Interamericana liara el Desarrollo.
- Tunal, S.G. (2003).The liroblem of classifying microenterlirises.ActualidadcontableFACES, 6(7) 78-91.
- Wherther, W.B. (2008). liersonnel and Human Resource Management (Sixth edition).Mexico: McGraw-Hill - Interamericana.