Research Article: 2019 Vol: 23 Issue: 1
Insurance Industry Risk During the 2008 Financial Crisis
Raja Bouzouita, University of Central Missouri
Mihaela Craioveanu, University of Central Missouri
Abstract
This paper investigates the impact of the 2007-2009 financial crisis on the volatility of insurance stock returns and on the correlation of the insurance stock returns with the market. In particular, we use a DCC GARCH model that allows for structural breaks in the volatility estimation in order to show the evolution of the insurance stock return volatility and their correlation with the overall market over time. Using daily stock returns on a sample of 208 insurance companies from 1990 until 2011, we find that insurance stock return volatilities increased significantly during the financial crisis but eventually reverted to pre-crisis volatility levels. The crisis also increased the correlation of insurance stocks with the market. The analysis of insurance segments reveals that the correlations with the market exhibit different patterns across segments during the financial crisis.
Keywords
Financial Crisis, Insurance Stock Return.
Introduction
The 2007-2009 financial crisis revealed the vulnerabilities of financial services companies, and climaxed into the distress of large financial institutions such as the failure of Lehman Brothers and the near collapse of the insurance giant AIG. In the aftermath of the crisis, a considerable scholarly effort has been devoted to better understand risks posed by these firms. Policy makers have passed new regulations to prevent future financial crises and to contain their ensuing economic impact. The sub-prime mortgage crisis that started in the U.S. affected all sectors of the financial system including the insurance industry. Prior to the financial crisis, insurance companies offered exceedingly large amounts of financial guarantees and provided significant corporate financing making them important to the financial system and a potential source of risk.
Insurance companies have been caught up in the crisis as evidenced by the U.S. government’s bailout of the insurance giant AIG. This generated calls for greater scrutiny and oversight of the insurance industry. The Dodd-Frank Wall Street Reform and Consumer Protection Act of 2010 established the Financial Stability Oversight Council (FSOC). The FSOC’s task is to identify Systemically Important Financial Institutions (SIFI) whose potential collapse could lead to a systematic failure of the financial system. Among those financial institutions, the largest insurance companies such as MetLife, AIG, and Prudential were identified as SIFI. As a result, the insurance industry will be closely monitored by the Federal Reserve to assess its systemic risk. This measure represents a major shift in the regulation of the insurance industry which has been regulated by the states since the 1945 McCarran-Ferguson Act. This new oversight will subject larger insurers deemed systemically important to tighter rules in the form of higher capital requirements and stress tests.
This paper analyzes insurance companies stock returns volatility and the correlation of the insurance stock returns with the overall stock market returns during the financial crisis. Understanding insurance risk, its size, and its interaction with the wider market helps regulators devise the appropriate policy tools to manage insurance risk. Because the insurance business is multifaceted, it is instructive to examine the different insurance segments to understand the breadth and depth of changes in correlation and volatility.
We use a DCC GARCH (Engle, 2002) model to estimate insurance industry volatility returns and the correlation of industry returns with the wider market. As historical time series of returns may not be stable over time but maybe driven by economic states, our estimation procedure detects structural breaks. Therefore, failure to account for the associated economic state, the estimated conditional volatilities are not reliable and could be misleading to market participants and policymakers. We find a significant increase in the volatility of the insurance segment during the financial crisis especially in the last part of 2008. This phenomenon is short lived as by the end of 2009 the volatility reverts back to the pre-crisis levels. With respect to the correlation of the insurance stocks and the overall market we also find an increase during the financial crisis. The insurance segment analysis reveals differences among sectors, both for the volatility and correlation. The correlations for the life insurers, health insurers, and property & casualty insurers are high during the financial crisis, while the correlations for the surety & financial guarantee insurers and hospital & medical service plans with the overall market index remain at lower values throughout the financial crisis. The surety & financial segment also exhibits the highest volatility
The rest of the paper is organized as follows. Section 2 explores the literature review. Section 3 discusses the estimation procedure. Section 4 summarizes the results and the final section presents concluding remarks.
Literature Review
There is a rich body of financial literature on the volatility and the correlation of financial firms’ stock returns. In fact, the topic of systemic risk in the financial sector has attracted renewed attention following the 2008 financial crisis. The demise of AIG put the spotlight on insurance companies and raised concerns by policymakers, practitioners, and academics about the role of the insurance industry in the crisis and the extent to which the insurance industry is systemically risky.
Two lines of research emerged. A number of studies considered the insurance sector as part of the overall financial services industry along with banks, brokers/dealers, and hedge funds; while another line focused on insurance systemic risk and determined the factors that affect their riskiness.
Grace (2010) conducts a series of tests on insurer stock prices to help determine “whether insurers contribute to systemic risk or whether they are potential victims of systemic risk.” Grace’s findings suggest that AIG was systemically important but that generally, the insurance industry is not a significant source of systemic risk.
Cummins & Weiss (2014) find that the core activities (underwriting, reserving, claims settlement, and reinsurance) of property and casualty insurers do not contribute to systemic risk. However, the authors do find evidence suggesting that some activities of life insurers, particularly group annuities and separate accounts, do indeed contribute to systemic risk.
Chen et al. (2014) using daily stock prices construct a systemic risk measure to examine the inter-connectedness between banks and insurers. Their results indicate that the impact of banks on insurers is stronger and of longer duration than the impact of insurers on banks. Stress tests confirmed that banks create economically significant systemic risk for insurers. However, insurance companies do not contribute to the financial system systemic risk.
Drake et al. (2017) analyze equity risks of financial services companies with a focus on insurance firms. The authors find that not all insurance lines of business contribute to the financial system risk. They find that financial guarantee and surety insurers do exhibit interconnectedness to bank risks. This study’s findings are at odds with Cummins & Weiss (2014) that life insurance companies operations are systemically significant.
Bouzouita et al. (2018) investigate the link between systemic risk in the insurance sector and the macro economy during the 2008 financial crisis. The authors test the predictive power of insurance companies’ systemic risk of macroeconomic downturns using two measures of systemic risk: the estimated shortfall and the financial volatility. The findings show that insurance systemic risk forecasts macroeconomic downturns three months into the future.
Chow et al. (2018) use CDS spreads to identify systematically important insurers. They assess the global systematically important insurers’ designation by the Financial Stability Oversight Council. The authors found that market data based CDS provide a better assessment of insurance companies’ systemic risk than the method used by the FSOC.
In summary, the existing literature provides a conflicting picture of the degree of the systemic risk of the insurance industry and the role of insurance companies in the financial crisis. While most of the studies look at the entire financial sector, our analysis exclusively considers equity-based measures of systemic risk in the insurance industry.
Methodology
Data
To measure the risk in the U.S. insurance industry, we collected daily stock returns from the CRSP data set over the period from 1-Jan-1990 through 30-Dec-2011. We screened insurance companies with SIC codes 6311, 6331, 6321, 6324, and 6351. Thus, we include life insurers, property and casualty insurers, accident and health insurer, hospital and medical service plans, and surety insurance companies. We explicitly exclude reinsurance companies and title insurers due to their specialized business model. As a proxy for market returns, we use CRSP value weighted returns with dividends. Focusing on U.S. insurers ensures that all companies in our study are subject to uniform regulation standards. For a company to be included in the sample, we require a minimum of 250 observations. Our final sample consists of 208 U.S. insurance companies.
Table 1 presents summary statistics for our sample. We observe that life insurers and property and casualty insurers dominate the industry. Over the time period covered, the average daily return of insurance stocks was slightly over one percent (0.06%) while the average daily return of the CRSP value weighted is 0.041%. It seems that insurance stocks performed better than the market index measured by CRSP. On the other hand, we notice that insurance stock returns exhibit a higher risk, measured by the standard deviation than market returns. Among the five segments, property and casualty insurers have the highest daily return while hospital and medical service plans had the lowest daily average return.
| Table 1 Sample Statistics |
|||
| Summary Statistics of Individual Stock Returns for each Insurance Segment | |||
| Segments | N | Mean | Std. Dev. |
| Life Insurance | 75 | 0.00075 | 0.03145 |
| Accident & Health | 23 | 0.00049 | 0.02532 |
| Property & Casualty | 96 | 0.00084 | 0.02787 |
| Hospital and Medical Service Plans | 10 | 0.000460 | 0.02593 |
| Surety Insurers | 4 | 0.00064 | 0.04519 |
| All | 208 | 0.0006 | 0.02875 |
| Summary Statistics for Market Returns | |||
| Mean | Std. Dev. | ||
| CRSP | 0.00041 | 0.01172 | |
Figure 1 shows the daily returns of the insurance industry and daily market returns in panels (a) and (b) respectively. As expected, the returns move in the same direction though the swings are less pronounced for insurance returns than those of the market index.
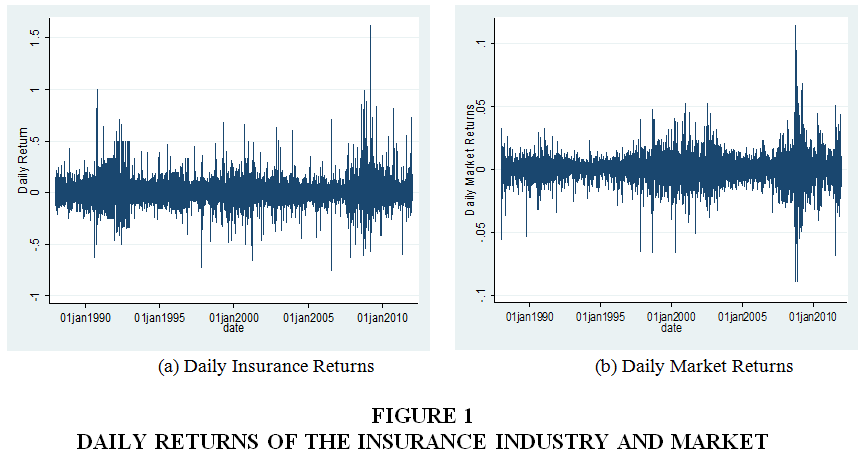
Figure 1: Daily Returns Of The Insurance Industry And Market
The main contribution of our paper is twofold. One novelty in our work is that we model the insurance sector and the overall market simultaneously by using a Multivariate GARCH framework. These models allow for both time varying volatility and time varying correlation among assets. Another novelty is that we account for the existence of structural breaks during our sample period. It is well known that structural breaks confuse the volatility estimation (Perron, 1989; Hillebrand, 2005). Ignoring structural breaks in the volatility estimation can lead to inaccurate estimates of persistence with important implications for asset pricing models (Fouque et al., 2003).
One of the key aspects of any asset pricing model is the volatility. It is well documented that financial assets exhibit time varying volatility or volatility clustering which means that volatility is high for a period and low for other periods: periods of high volatility are followed by other periods of high volatility and periods of low volatility are followed by other periods of low volatility. In order to capture this stylized fact Engle (1982) proposed the ARCH Model. In practice, this model requires a large number of parameters to be estimated in order to capture the main stylized facts of volatility. To address this issue Bollerslev (1986) proposed the GARCH Model.
The second aspect of any asset pricing model is the covariance or correlation of various assets. It is of equal importance to analyze how the correlation of different assets evolves over time. Multivariate GARCH Models are very appealing in practice because they allow us to model these correlations over time. Therefore, assuming that financial asset returns have Constant Conditional Correlation (CCC) within GARCH processes has been shown in the literature to be an inaccurate assumption (Engle, 2002). In response to this shortcoming, Engle (2002) generalized the CCC model to allow correlations to vary over time by using a two-step procedure to isolate the dynamic conditional correlation process. The first step involves obtaining GARCH estimates of variances in order to standardize the residuals. In the second step, the standardized residuals are used to estimate time-varying conditional covariance. Since the original DCC model by Engle (2002), several alternative specifications have been proposed. The class of DCC GARCH has become widely used in time series analysis. It conveniently estimates the volatility of asset returns as a function of their past volatility and the correlation between them.
We fit a multivariate DCC GARCH model as proposed by Engle (2002). Let Yt be a vector containing the insurance stock returns rt and the market returns rmt (the CRSP value weighted returns with dividends index). The conditional mean equation is given by:
Φ (L)Yt= ?t (1)
Where,Φ (L) is a lag polynomial matrix and ?t follows a N (0, Ht) distribution with the conditional variance-covariance matrix given by:
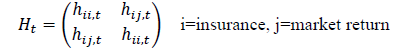
The variance-covariance matrix can be expressed as:
Ht=DtRtDt.(2)
The matrix Rt contains the conditional variances and correlations and Dt is a normalized matrix given by:
Estimation Results
The consequences of structural breaks in the context of time series have been studied extensively in the literature (Hillebrand, 2005). Ignoring structural breaks in the volatility estimation introduces errors in the estimates. We therefore further analyze the data for structural breaks. We employ the Kokosza & Leipus (2000) test in order to detect change points in the volatility.
Table 2 presents a summary of the structural breaks found in our sample. The breaks occur around the stock market crash on September 15, 2008 after the decision to let Lehman Brothers fail. Another break date is July 24, 2007. On this day, the leading subprime lender Countrywide Financial, in a financial filing, warns of difficult housing and mortgage conditions for the rest of 2007. The Dow closes at $13,716.95, down 1.6%. This break was one of the clear signs of troubles in the mortgage market and provides evidence that the financial crisis started in 2007. Eventually, Bank of America purchased Countrywide for $4 billion on January 11, 2008.In the period from 1990 to the 2007-2008, equity markets experienced several spikes in volatility returns that did not culminate in full blown financial crises for potentially two reasons. One possibility is that regulatory measures have been taken to avert a crisis. Another explanation is that equity markets self- corrected as they usually do.
| Table 2 Structural Breaks |
|||
| Change-Point Detector for ARCH model (Kokosza & Leipus, 2000). | |||
| Breaks | Start Date | End Date | Break Date |
| 1 | 01/01/1988 | 12/30/2011 | 07/24/2007 |
| 2 | 01/01/1988 | 07/24/2007 | 07/21/1998 |
| 3 | 07/24/2007 | 12/30/2011 | 05/19/2009 |
| 4 | 01/01/1988 | 07/21/1998 | 03/09/1993 |
| 5 | 07/21/1998 | 07/24/2007 | 06/02/2003 |
| 6 | 01/01/1988 | 03/09/1993 | 07/20/1990 |
| 7 | 03/09/1993 | 07/21/1998 | 03/07/1997 |
| 8 | 07/24/2007 | 05/19/2009 | 09/15/2008 |
| 9 | 05/19/2009 | 12/30/2011 | 08/03/2011 |
Industry Results
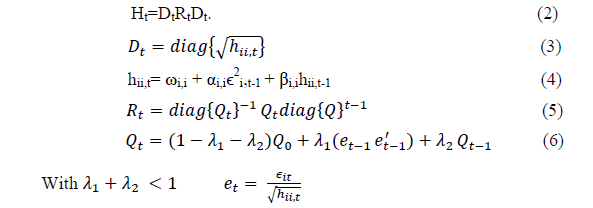
Figure 2 shows the estimated volatilities measured by conditional standard deviations. The volatilities of the stock market are time-varying volatilities. The volatility of insurance stock returns spiked during the crisis but eventually dropped back to approximately the same level of volatility before the crisis. A comparison between panels (a) and (b) reveals that conditional volatility of the insurance sector reached a peak following September 15, 2008.
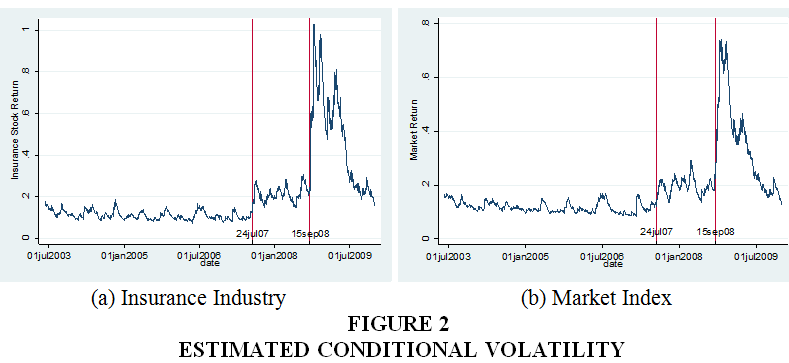
Figure 2: Estimated Conditional Volatility
Figure 3 shows plots of the conditional volatility of the market returns around the events occuring from September 15 through October 14 in 2008. On September 16, the Federal Reserve provided AIG with an $85 billion loan to prevent the company from failing and causing further distress to the economy.
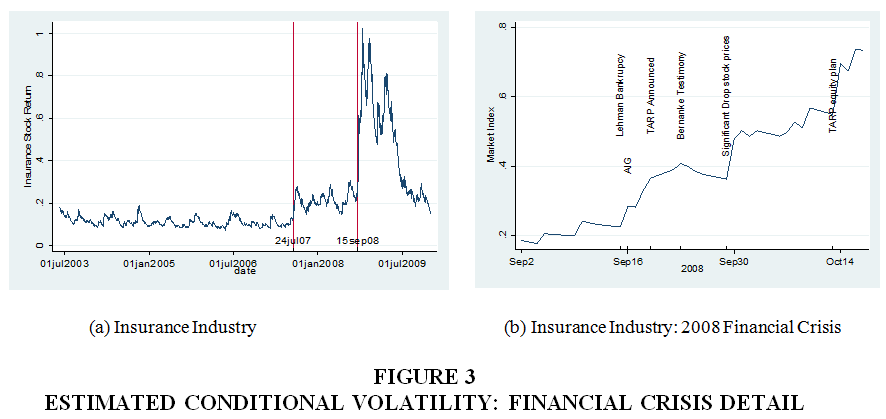
Figure 3: Estimated Conditional Volatility: Financial Crisis Detail
Next, we present the results for the estimated correlation between insurance stock returns and the market index. Figure 4 panel (a) presents the dynamic conditional correlation between the insurance stock industry and the CRSP index for the DCC GARCH. Comparing the two stock indices, it is clear that the fluctuations of dynamic conditional correlation of the insurance sector changes depend on the time period. Although the coefficients vary over time between highs and lows, the estimated conditional correlations have increased during the financial crisis, implying higher linkages between the insurance market and the overall market. Furthermore, it seems that these correlations have a common positive trend. In other words, the linkages between these two markets tend to move together. The mean value of the dynamic conditional correlation coefficient has a high value of 0.87.
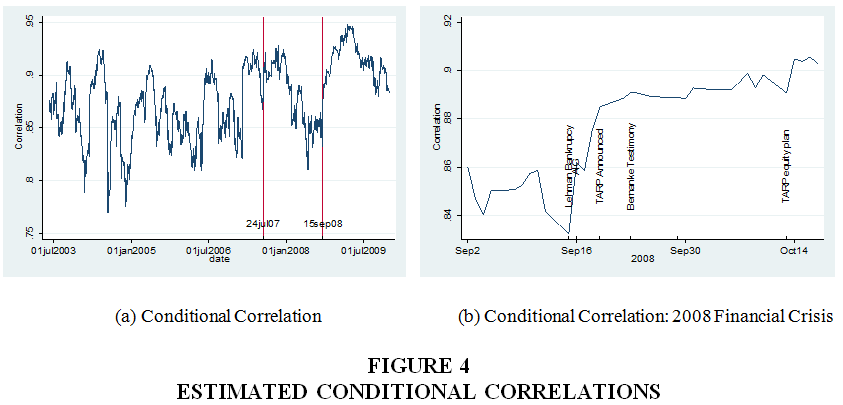
Figure 4: Estimated Conditional Correlations
Segment Results
We refine our analysis and estimate the conditional correlation of each segment of the insurance industry with the market index and their respective volatility. There are subtle differences among the different segments for both the volatilities and the correlations. These differences among sectors can be explained by several factors. One important distinction is size. Life insurers and property & casualty insurers are larger than insurers in the other segments. Financial institutions size has been shown to be the driving factor of the financial crisis. Other factors that may affect how different segments will be affected by the financial crisis is the degree of leverage and asset composition. The response of each segment of the insurance industry to the financial crisis could be informative to policymakers to chart a response tailed to each segment instead of imposing sweeping changes on the entire industry.
Figure 5 shows the conditional volatility of the five insurance segments for the entire sample period. We observe a jump in volatility for all segments with a dramatic spike for surety and financial guarantee insurers. The volatility of these companies remained high beyond the period surrounding the financial crisis as a number of them have seen their ratings being downgraded (Drake & Neale, 2011) as their creditworthiness suffered and market participants started to realize the severity of crisis engulfing the financial guarantee insurers. The other segment whose volatility spiked significantly is the life insurance segment. These companies evolved over years by engaging more and more in non-insurance activities such as trading in derivatives, offering guaranteed contracts and asset management. Another factor that may contribute to the volatility of life insurance companies is the record low interest rate environment imposed by the Federal Reserve to help contain the financial crisis.
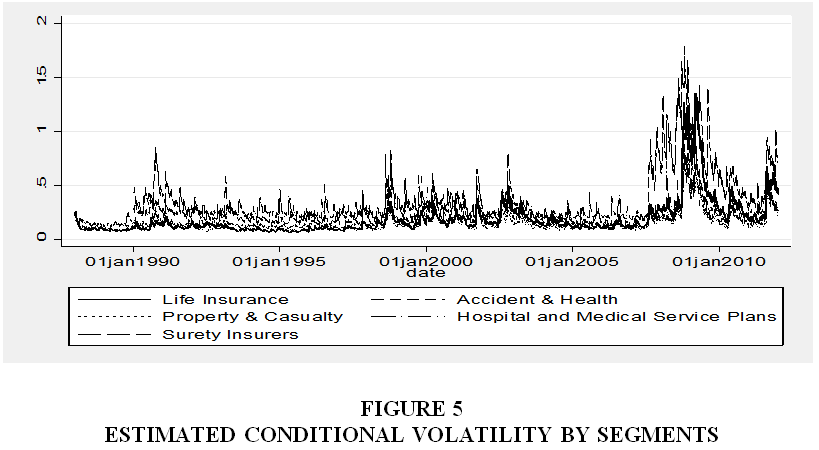
Figure 5: Estimated Conditional Volatility By Segments
Figure 6 shows the estimated conditional correlations by insurance segments. We observe that the correlation of the life insurance sector moves slightly more jointly with the property and casualty sector, while surety and financial guarantee companies had correlation levels reacting more dramatically within the period of crisis than other sectors. Surety and guarantee insurers became intertwined with the financial crisis as some of these insurers participated in non-insured credit default swaps backed by residential and commercial real estate mortgages, sold guaranteed investment contracts, and invested in municipal bonds some of which they insured (Drake & Neale, 2011).
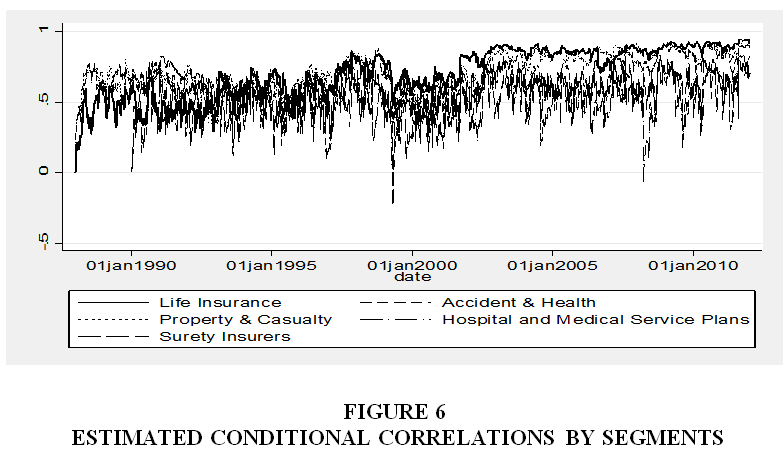
Figure 6: Estimated Conditional Correlations By Segments
Figure 7 focuses on the estimated correlation and volatility during the financial crisis. Panel (a) shows that conditional correlation of life, property & casualty is in sync with the entire industry. As shown on Table 1, the insurance industry is dominated by these two segments. While surety and financial guarantee insurers and medical plans services had a relatively low correlation shortly prior to the financial crisis, experienced a large spike in their conditional correlation with the market around September 10th and another spike around the Lehman Brothers’ failure. These two segments’ correlation continued this upward trajectory reaching levels close to the insurance industry correlation. Panel (b) shows that the volatility pattern is quite consistent with estimated conditional correlation. The volatility was highest among surety and financial guarantee insurers and medical service plans.
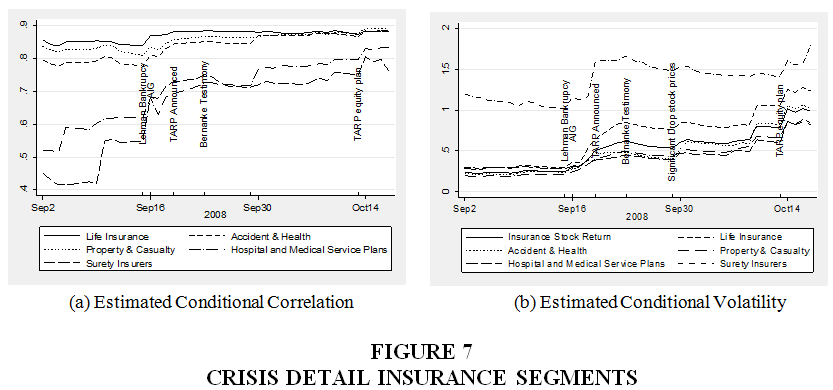
Figure 7: Crisis Detail Insurance Segments
To further check the robustness of the structural changes identified in Table 2, we test for the equality of the correlation between insurance companies stock returns volatility and the market index. We perform the Jennrich (1970) test. As Table 2 identifies a structural break date on September 9, 2008, we split the sample along that cutoff date. We test for equality of returns correlation from 07/24/2007 through 09/15/2008 with the returns correlation from 09/16/2008 through 12/31/2009. The chi-squared test values and their p-values are reported in Table 3.
| Table 3 Test For Changes In Correlation (p-values) |
||
| Equality of returns correlation | Return correlation | |
| 01/01/03-07/24/07 | 07/24/07-09/15/08 | |
| 07/24/07-12/31/09 09/15/08-12/31/09 |
11.58 (0.000) |
20.02 (0.000) |
Based on the critical values, we reject the null hypothesis that the pairwise correlations are equal. Our test implies that the magnitude of the correlation of insurance stock returns with the returns of the stock market is statistically different across the pre-crisis and post crisis periods. The post crisis correlation is significantly larger than the pre-crisis level. This result has implications for investors who hold insurance stock investments. They may consider rebalancing their holdings to reflect the increased risk.
Discussion
This paper contributes to the literature by analyzing the reaction of the insurance industry to the financial crisis. In particular, we examine the time varying volatility of the insurance sector as a whole and segment specific. We also investigate the time varying correlations of the entire insurance market and the five main segment returns in the insurance market with the CRSP value weighted index. In order to obtain time varying volatilities and correlations we employ the DCC GARCH model developed by Engle (2002). We also allow for structural breaks in the estimation. While some studies allow for time varying volatilities (Drake et al., 2017), most studies do not investigate dynamic conditional correlations and do not take into account structural breaks. One exception is Thomann (2013), who employs a DCC GARCH model to analyze property and casualty insurers’ stock returns and its correlation with the market after man-made and natural catastrophes. While the methodology of this study is similar to ours, the study does not allow for structural breaks and is focused on the effect of natural disasters and catastrophes on the volatilities and correlations, while the focus of our paper is on the financial crisis.
Conclusion
It is well documented that return volatility forecast is an important input for asset valuation, hedging, and risk management. The volatility of returns increases significantly during periods of financial markets instability.We analyzed the stock returns volatility of insurance companies and the correlation of insurance returns with the returns of the overall market during the 2007-2009 financial crises using a DCC GARCH model. We find that the volatility of the insurance stock returns and the volatility of the market index increased significantly during the financial crisis but eventually reverted to levels similar to pre-crisis volatility. With respect to the conditional correlation between the insurance stock returns and the market index, we also find an increase during the financial crisis. Analyzing the different segments of the insurance industry shows that life insurers and surety and financial guarantee insurers had experienced higher volatility than other segments. The difference in the impact of the financial crisis on insurance segments correlation with the market is useful to policymakers, investors, and insurance companies’ managers. The insurance sector represents an important segment of the entire U.S. financial system. The marked increase in insurance stock returns volatility has raised questions about the contribution of insurance companies to the severity of the financial crisis. We know that there is co-movement in asset prices in general, and that correlations increase during turbulent market conditions and then gradually revert to pre-crisis level. Our analysis confirms this pattern in the case of the 2007-2009 financial crisis for some segments of the industry such as life insurers and property & casualty insurers but surety and financial guarantee insurers’ volatility and correlation remain high after the crisis.
To curb the insurance industry risks to the financial system, the U.S. government has designated several insurance companies as SIFI. Those companies were targeted by policymakers to shore up their safety and soundness and hold more equity. The increase in systemic risk is the result of increased interest rate sensitivity and market risk related to their investment activities. The focus should not be limited to the largest insurers but should be also extended to smaller insurance companies as their simultaneous failures may contribute to the instability of the financial system. Effective and efficient regulation requires monitoring the systemic risk of each segment of the financial system and taking into account the characteristics of each industry.
The renewed effort to deregulate the financial industry and to roll back regulation and supervision mechanisms put in place through Dodd Frank Act of 2010 could inevitably create a new asset bubble that would burst and would be the driver of another financial crisis. The February 3, 2017 executive order aims at amending several parts of the law regarding the size of the financial institutions subject to oversight by the FSOC, capital standards, and stress tests. There is an almost unanimous agreement that one of the leading causes of the 2008 financial crisis was financial deregulation. As an example, the Financial Services Modernization Act of 1999 known as Gramm-Leach-Bliley Act allowed financial institutions to consolidate and engage in banking, securities and insurance businesses. Thereby, the move towards deregulation, could lead to renewed risks for the financial system.
References
- Acharya, V., Engle, R., & Richardson, M. (2012) Capital shortfall: A new approach to ranking and regulation systemic risk. American Economic Review: Papers & Proceedings, 102(3), 59-64.
- Baluch, M., Mutenga, S., & Parsons, C. (2011). Insurance, systemic risk and the financial crisis. The Geneva Papers on Risk and Insurance-Issues and Practice, 36(1), 126-163
- Bollerslev, T. (1986) Generalized autoregressive conditional heteroskedasticity. Journal of Econometrics, 31(3): 307-327.
- Bouzouita R., Craioveanu M.,& Young A. (2018). Systemic risk in the insurance industry and its impact on the economy. The Journal of Finance Issues, forthcoming.
- Carson, J., Elyasiani, E., & Mansur, I. (2008). Market risk, interest rate sensitivity, and interdependency in insurer stock returns. Journal of Risk and Insurance, 75, 873-891.
- Chen, H., Cummins, J.D., Viswanathan, K.S., & Weiss, M.A. (2014). Systemic risk and the interconnectedness between banks and insurance: An econometric analysis. Journal of Risk and Insurance, 81(3), 623-652.
- Chow, Y.F., Fung, D.W., & Yeh, J.J. (2018). CDS spreads, systemic risk and global systemically important insurers designations. Journal of Insurance Regulation, 37, 1-33.
- Cummins, J.D., & Weiss, M.A. (2014). Systemic risk and the insurance sector. Journal of Risk and Insurance, 81(3). 489-527
- Dodd-Frank Wall Street Reform and Consumer Protection Act (2010). Retrieved from https://www.congress.gov /111/plaws/publ203/PLAW-111publ203.pdf
- Drake P., & Neale, F.R. (2011). Financial guarantee insurance and the failures of risk management. Journal of Insurance Regulation, 30, 29-76.
- Drake P., Neale Faith, F.R., Schorno, P.J., & Semaan, E. (2017). Risk during the financial crisis: The role of the insurance industry. Journal of Insurance Issues, 40(2), 181-214.
- Engle, R. (1982) Autoregressive conditional heteroscedasticity with estimates of the variance of United Kingdom inflation. Econometrica, 50, 987-1007.
- Engle, R. (2002). Dynamic conditional correlation: A simple class of multivariate generalized autoregressive conditional heteroscdasticity models. Journal of Business and Economic Statistics, 20(3), 339-350.
- Fouque, J.P., Papanicolaou, G., Sircar, K.R., & Solna, K. (2003). Short time scale in S&P 500 volatility. Journal of Computational Finance, 6, 1-23.
- Grace, M.F. (2010). The insurance industry and systemic risk: Evidence and discussion. Working Paper. Georgia State University, Atlanta, GA.
- Hillebrand, E. (2005). Neglecting parameter changes in GARCH Models. Journal of Econometrics, 129, 121-138.
- Jennrich, R.I. (1970). An asymptoticχ^2test for the equality of two correlation matrices. Journal of the American Statistical Association, 65, 904-912.
- Kokoszka, P., & Leipus R. (2000). Change-point estimation in ARCH Models. Bernoulli, 6(3), 513-539.
- Perron, P. (1989).The great crash, the oil price shock, and the unit root hypothesis. Econometrica, 57(6), 1361-1401.
- Thomann, C. (2013). The impact of catastrophes on insurer stock volatility. Journal of Risk and Insurance, 80(1), 65-94.