Research Article: 2019 Vol: 23 Issue: 6
Integration of Major African Stock Markets: Evidence from Multi-Scale Wavelets Correlation
George Tweneboah, University of the Witwatersrand
Peterson Owusu Junior, University of the Witwatersrand
Emmanuel K. Oseifuah, University of Venda
Abstract
This study employ the wavelets multiple correlation and wavelets cross-correlations techniques to investigate the co-movement and interdependence structure across seven African stock markets using daily and weekly data from 2011 to 2017. The results suggest there are linkages among stock markets and this is stronger at lower frequencies (long-terms). Also, the Ghanaian stock market has a potential to lead or lag other markets at lower frequencies where there is higher degree of integration. Thus, African stock markets offer little opportunities for diversification at lower frequencies than at higher frequencies (short-terms and medium-terms).
Keywords
Stock Market Integration, Portfolio Diversification, MODWT, Wavelet multiple correlation, Africa.
Introduction
Equity market integration has spurred interest among investors, researchers, and policy makers in recent times. Interdependencies in equity markets have implications for international investors and fund managers because they tend to affect the potential benefits of diversification. Higher levels equity market assimilation is of interest to policy makers as well. To wit, the events in one market can have significant effects in other markets in the global market space. For instance, cross-border capital flows largely have ramifications on emerging market economies (EMEs) and their stock markets. Macroeconomic and monetary policy implications of greater integration therefore pronounced. This is true because domestic monetary policies could be affected by the inter-linkages in the local capital markets and other the sub-regional and global markets.
Analysis of stock market integration is vita in finance because it has consequences for asset allocation and portfolio diversification. Highly connected stock market imply low diversification benefits, whereas segmented stock markets enable portfolio managers to reap high levels of diversification due to differences in markets. In the wake of Grubel’s (1968) first treatise on the benefits of international portfolio diversification, issues related to the co-movement of stock market returns have received a great deal of attention. A huge move of research activity has emerged on the co-movement of international stock markets (Brooks & Del Negro, 2004b, 2004a; Forbes & Rigobon, 2002; Karolyi & Stulz, 1996; Yang, Kolari, & Min, 2003).
Several studies have been conducted on the integration of regional and global capital/equity markets since the early 2000s. One strand of the literature on African stock markets (ASMs) has focused on the degree of co-movement and interdependence. The evidence from such studies is that there are low levels of regional integration among African markets (Agyei-Ampomah, 2011; Boako & Alagidede, 2018; Boamah, 2016; Gourène et al., 2019; Marozva, 2017). The other strand that focuses on how integrated African markets are with the rest of the world also concludes that African markets are not well integrated with the global stock market space (Boako & Alagidede, 2018b; Mensah & Alagidede, 2017; Tong et al., 2018). However, these studies employ methodologies such as correlation, panel models, vector autoregressive models, error correction models, GARCH models, and co-spectral analysis that fail to capture the time and frequency dimensions of the data. Aside the limited literature on stock market integration in Africa, the empirical findings are at best conflicting and inconclusive.
This study contributes to the existing literature by using the wavelet-based measure of the interdependence structure. This is a unified framework that allows us to assess the extent to which two or more markets move together continuously over time and across frequencies. Unlike previous studies which assessed co-movement or integration via bivariate platforms, the application of the wavelet multiple correlation (WMC) and wavelet multiple cross-correlations (WMCC) makes it possible to investigate the time-frequency domains of integration by capturing the seven African markets as a unit within various timescales. The wavelets analysis, in general, has the ability to decompose time series data into several time scales and has the ability to handle nonstationarity and localisation in time. Being robust for non-linearity and structural breaks, it is able to capture the short-run and long-run relationships through the wavelet timescales and provide full picture of the nexus (Aloui & Hkiri, 2014; Durai & Bhaduri, 2009).
Aside the usual advantages that come with wavelets techniques, this advanced methodology helps us to answer the question of whether African equity markets can be considered as an asset class in a portfolio or treated as independent and segregated markets. The multivariate tool proposed by Fernández-Macho (2012) is considered superior and more powerful than the conventional bivariate wavelet methodology in the following ways. First, the WMC provides bivariate correlations at various frequencies which can be analysed. However, if this is the end product, like in the bivariate case, analysis can be complex and confusing if several variables are involved; for instance, seven in this study. That is, 211 pairs each for both daily and weekly periodicities as shown in Tables 1-3. Second, the overall correlations within the multivariate can be viewed in just two plots of WMC and WMCC. Third, unlike the bivariate wavelets where the composite leading/lagging variable can be determined only by assessing correlations across each time and frequency, with the WMCC this can be ascertained at once in a plot (see Appendix; also rendered in Table 4). Further, the WMC provides protection against spurious correlations as 95% confidence intervals are provided as each scale. Thus, significance of correlations is assessed at each scale, unlike the bivariate technique where a once-off confidence bounds is provided across all scales and frequencies. Finally, the technique is useful to provide cushion against type 1 errors which could be committed in assessing the significance of the correlation coefficients.
| Table 1 Interpretation of Time-Scales & Frequencies | |||
| Frequency | Scale | Daily | Weekly |
| wi1 | 2 ~ 4 | Intraweek | Intramonth |
| wi2 | 4 ~ 8 | Week | Month |
| wi3 | 8 ~ 16 | Fortnight | Month to quarter |
| wi4 | 16 ~ 32 | Month | Quarter to bi-annual |
| wi5 | 32 ~ 64 | Month to quarter | Bi-annual to annual |
| wi6 | 64 ~ 128 | Quarter to bi-annual | - |
| wi7 | 128 ~ 256 | Bi-annual to annual | - |
| Table 2 Summary Statistics of Selected African Stocks | |||||||
| Nigeria | Egypt | S. Africa | Morocco | Kenya | Ghana | Mauritius | |
| Daily | |||||||
| Mean (10-4) | 2.445 | 1.986 | 0.4386 | 0.6066 | -1.5615 | 1.151 | 0.4664 |
| Variance (10-4) | 2.086 | 3.550 | 2.2230 | 0.5841 | 0.6987 | 1.082 | 0.3413 |
| Skewness | 3.9844 | 6.0925 | 0.3214 | -0.1517 | 0.5172 | 0.2625 | 0.1689 |
| Kurtosis | 73.5649 | 129.6672 | 5.0358 | 5.3931 | 8.0795 | 18.1901 | 8.3905 |
| JB | 360000* | 1200000* | 330* | 420* | 1900* | 17000* | 2100* |
| Observations | 1724 | 1724 | 1724 | 1724 | 1724 | 1724 | 1724 |
| Weekly | |||||||
| Mean (10-3) | 1.4051 | 1.111 | 0.2073 | 0.3162 | -0.6783 | 0.5523 | -0.0047 |
| Variance (10-3) | 1.2743 | 1.9036 | 0.9754 | 0.2972 | 0.4962 | 0.6364 | 0.1649 |
| Skewness | 1.8795 | 2.1866 | 0.2289 | -0.1166 | 0.7154 | -0.6188 | -0.2242 |
| Kurtosis | 18.9994 | 20.4164 | 4.7300 | 4.3875 | 4.6976 | 14.4718 | 5.5528 |
| JB | 4000* | 4800* | 48* | 30* | 74* | 2000* | 100* |
| Observations | 359 | 359 | 359 | 359 | 359 | 359 | 359 |
| Table 3 Bivariate Interrelationships Among Major ASMS | |||||||
| Wavelet scale | I | II | III | IV | V | VI | VII |
| Daily returns | |||||||
| Egypt-Ghana | 0.05 | 0.01 | 0.03 | 0.08 | 0.17 | 0.31 | 0.24 |
| Nigeria-Mauritius | 0 | 0.03 | 0.05 | 0.06 | 0.12 | -0.16 | 0.44 |
| Kenya-Mauritius | -0.01 | -0.03 | 0.06 | 0.08 | 0.2 | -0.01 | 0.18 |
| Egypt-Kenya | -0.01 | 0.01 | 0.08 | 0.07 | 0.03 | -0.04 | 0.2 |
| Egypt-Morocco | 0 | -0.06 | -0.01 | -0.13 | -0.17 | 0.22 | 0.42 |
| Ghana-Mauritius | 0.01 | -0.03 | -0.07 | -0.01 | -0.02 | 0.26 | 0.06 |
| Egypt-S. Africa | 0.02 | 0.03 | 0.13 | 0.09 | -0.03 | -0.11 | 0.07 |
| Morocco-Kenya | 0 | 0.03 | 0.06 | -0.02 | 0 | 0.14 | -0.04 |
| Nigeria-Ghana | 0.02 | 0 | -0.05 | 0.05 | 0.09 | 0.1 | -0.04 |
| Nigeria-Kenya | 0.01 | -0.04 | -0.13 | 0.09 | 0.18 | -0.12 | 0.14 |
| Nigeria-Egypt | 0 | 0.02 | -0.06 | -0.06 | -0.03 | 0.14 | 0.09 |
| Morocco-Ghana | -0.03 | -0.03 | 0.01 | -0.03 | -0.05 | -0.06 | 0.27 |
| S. Africa-Kenya | 0.08 | -0.02 | -0.17 | -0.02 | 0.05 | 0.15 | -0.02 |
| S. Africa-Mauritius | 0.01 | 0.04 | -0.01 | 0 | -0.08 | -0.04 | 0.12 |
| Nigeria-Morocco | -0.03 | -0.03 | -0.02 | 0.01 | -0.03 | 0.07 | -0.03 |
| S. Africa-Morocco | -0.04 | -0.02 | 0.03 | -0.02 | -0.11 | 0.13 | -0.06 |
| Egypt-Mauritius | -0.01 | 0.03 | 0.06 | 0.01 | -0.16 | -0.18 | 0.09 |
| Nigeria-S. Africa | -0.01 | -0.01 | 0.02 | -0.11 | -0.12 | -0.16 | 0.08 |
| Morocco-Mauritius | -0.05 | 0 | -0.01 | -0.24 | 0.01 | -0.08 | 0.01 |
| S. Africa-Ghana | 0 | -0.03 | -0.02 | 0 | 0.13 | 0.03 | -0.5 |
| Kenya-Mauritius | 0.01 | -0.03 | -0.11 | -0.02 | -0.25 | -0.14 | -0.27 |
| Weekly returns | |||||||
| Morocco-Mauritius | 0.17 | 0.21 | 0.17 | -0.02 | 0.64 | - | - |
| Egypt-S. Africa | -0.02 | 0.16 | 0.41 | 0.52 | 0.04 | - | - |
| Egypt-Morocco | -0.06 | -0.07 | 0.15 | 0.48 | 0.49 | - | - |
| Nigeria-Kenya | 0.21 | 0.17 | 0.35 | 0.08 | 0.13 | - | - |
| Morocco-Ghana | -0.08 | -0.06 | 0.12 | 0.22 | 0.64 | - | - |
| S. Africa-Kenya | 0.02 | 0.12 | 0.32 | 0.26 | 0.08 | - | - |
| S. Africa-Morocco | 0.2 | 0.16 | 0.35 | 0.39 | -0.32 | - | - |
| Morocco-Kenya | 0.09 | 0.13 | 0 | 0.34 | 0.07 | - | - |
| Nigeria-Egypt | 0.03 | 0.13 | 0.31 | 0.14 | -0.05 | - | - |
| Egypt-Kenya | -0.04 | 0.09 | 0.39 | 0.09 | 0 | - | - |
| S. Africa-Mauritius | 0.19 | 0.22 | 0.26 | 0.12 | -0.29 | - | - |
| Nigeria-Mauritius | 0.04 | 0.29 | -0.01 | -0.03 | 0.18 | - | - |
| Nigeria-S. Africa | -0.01 | 0.19 | 0.07 | -0.08 | 0.25 | - | - |
| Ghana-Mauritius | -0.05 | -0.04 | -0.1 | 0.02 | 0.56 | - | - |
| Egypt-Mauritius | 0 | 0.02 | 0.02 | 0.19 | 0.08 | - | - |
| Kenya-Ghana | 0.08 | -0.06 | 0.13 | 0.02 | 0.14 | - | - |
| Egypt-Ghana | 0.03 | -0.04 | 0.03 | 0.2 | 0.02 | - | - |
| Kenya-Mauritius | -0.09 | 0.1 | 0.1 | -0.25 | -0.13 | - | - |
| Nigeria-Ghana | 0.04 | 0.02 | 0.05 | -0.11 | -0.4 | - | - |
| Nigeria-Morocco | 0 | -0.04 | -0.18 | -0.12 | -0.13 | - | - |
| S. Africa-Ghana | 0 | -0.08 | 0.05 | 0 | -0.66 | - | - |
| Table 4 Multiple Correlations and Cross-Correlations in Major ASMS | ||||||
| WMC | WMCC | |||||
| Scale | Lower | Correlation | Upper | Localisation | Time lag | Leading/Lagging |
| Daily | ||||||
| wi1 | 0.026 | 0.093 | 0.158 | 0.120 | -3 | S. Africa |
| wi2 | -0.014 | 0.080 | 0.173 | 0.147 | 11 | Morocco |
| wi3 | 0.146 | 0.274 | 0.394 | 0.278 | -5 | Kenya |
| wi4 | 0.091 | 0.276 | 0.443 | 0.309 | -15 | Morocco |
| wi5 | 0.119 | 0.377 | 0.587 | 0.516 | -10 | Kenya |
| wi6 | 0.135 | 0.497 | 0.741 | 0.527 | -7 | Egypt |
| wi7 | 0.134 | 0.638 | 0.878 | 0.829 | 30 | Ghana |
| Weekly | ||||||
| wi1 | 0.137 | 0.278 | 0.408 | 0.312 | -1 | Morocco |
| wi2 | 0.200 | 0.392 | 0.555 | 0.406 | -1 | Mauritius |
| wi3 | 0.329 | 0.570 | 0.741 | 0.658 | 1 | S. Africa |
| wi4 | 0.363 | 0.680 | 0.856 | 0.718 | -2 | Egypt |
| wi5 | 0.683 | 0.910 | 0.977 | 0.924 | 3 | Ghana |
On stock market integration/interdependence Agyei-Ampomah (2011), indicate that in spite of the recent interest in research on emerging markets, the works on ASMs are still limited. Stock return predictability has seen much light rather for a long time now. In the African equity market space, only a few studies have considered the issue of integration and especially so using the time-frequency framework of wavelets. On African markets, Agyei-Ampomah (2011), using volatility decomposition find that stock markets in Africa, with the exception of South Africa, are still segmented from the global market in spite of their liberalisation efforts. Also, a large part of the total volatility of the local indices comes from country-specific factors. Collins & Biekpe (2003) also use changes in correlations to examine the interdependencies of African markets. They find that interdependence in African stock markets (ASM) fall into regional blocs and that, with the exception of South Africa and Egypt, the evidence does not support integration with global emerging markets. On the other hand, Wang et al. (2003) find ASMs to have time varying integration which appears to have declined after the 1997/98 Asian crisis.
This study extends prior African studies, such as Agyei-Ampomah (2011); Alagidede (2010); Bekaert et al. (2002); and Boamah (2015) and contributes to the emerging markets literature. The above studies show that the degree of integration of the ASMs is time-varying, and that global integration exceeds that of regional integration for all of the ASMs in recent times. Our evidence built on the bivariate wavelet correlations is consistent with Boamah (2016). With the low level of regional integration, portfolio managers may realise higher diversification gains by investing across the ASMs.
This is an interesting phenomenon because in connected capital markets countryspecific risks which can be diversified away should not be priced. Further, an interesting finding is that there are low (sometimes negative) correlations between the stock markets of countries in same regional economic blocs. Consistent with Wang et al. (2003), we evidence time-varying integration with the levels of integration with global and regional markets declining across time. This contradicts the findings of (Bekaert et al., 2002) which suggest the EMEs become more integrated after liberalisation. On a positive note, these low levels of integration offer greater diversification. This corroborates earlier findings that the ASMs and economies are less regionally integrated (Alagidede et al., 2011; Boako & Alagidede, 2018a; Tong et al., 2018).
The remainder of the paper is structured as follows. Section 2 covers a description of the methodology. Section 3 presents a description of the data and statistical properties. The results and analysis of the interdependence structure of industrial metals is captured in section 4, and the last section is the conclusion and policy recommendations.
Empirical Methodology and Data
The starting point of the wavelet multiple correlation and cross-correlation is the MODWT as defined by (Gençay et al., 2001; Percival & Walden, 2000). Let  be a real-valued multivariate random process and let
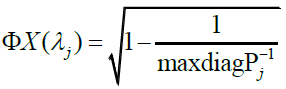
 denote the corresponding scale λjwavelet coefficients obtained by applying the MODWT. Fernández-Macho (2012) defines the wavelet multiple correlation (WMC) denoted by
  as a single set of multiscale correlations from (1) subsequently. For each λj the square roots of the coefficient of determination of the regression formed by the linear combination of
 variables for which such coefficient of determination is maximum. From extant literature it is known that for a regression of a regressand Zj on a set of predictors
  a coefficient of determination can be obtained as
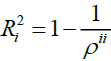 , where ρii is the ith diagonal element of the inverse of the complete correlation matrix P. Hence WMC is obtained as in (3), where Pj is the (n x n) correlation matrix of
  and max diag(.) elects the maximum element in the diagonal argument.
 (1)
(1)
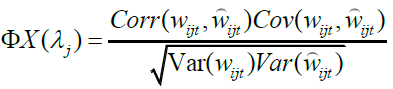
Further borrowing from regression theory to denote the fitted values of Zi as WMC can also be expressed as (4), where Wij is chosen to maximise and
  are the fitted values in the regression of Wij on the rest of the wavelet coefficients at scale λj
 (2)
(2)
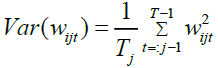
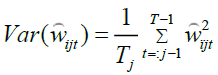
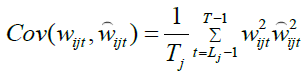
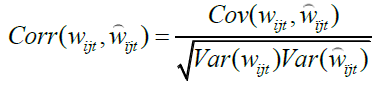
and the wavelet variances, covariances, and correlations are defined as
 (3)
(3)
 (4)
(4)
 (5)
(5)
 (6)
(6)
where  The WMCC is generated by allowing a lag τ between observed and fitted values of the variable selected as the criterion variable at each scale λj
 (7)
(7)
noting that for n = 2 , WMC and WMCC converge with the standard wavelet correlation and cross-correlation.
In estimating WMC and WMCC, let the realisation of the multivariate stochastic process By applying a MODWT of order j to each of the univariate time series
  we obtain J length-T vectors of coefficients of MODWT
From (1) the WMC is seen as a nonlinear function of all n(n - 1) / 2wavelet correlations of scale λj and a consistent estimator of wavelet correlation from the MODWT can be given by
 (8)
(8)
Following Gençay et al. (2001), the corresponding wavelet covariances and variances can be estimated as
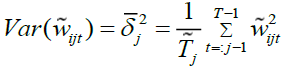 (10)
(10)
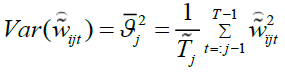 (11)
(11)
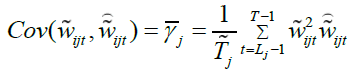 (12)
(12)
where is such that the regression of the same on the set of regressors
 maximises the coefficient of determination, denotes corresponding fitted values, and
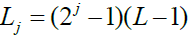 is the number of wavelet coefficients affected by the boundary conditions associated with wavelet filter of length L and scale λj whereas
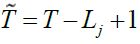 is the number of wavelet coefficients unaffected by the boundary conditions.
In a similar manner, a consistent estimator of the WMCC can be calculated as
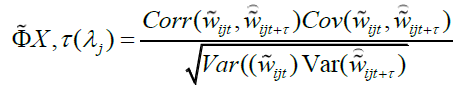 (13)
(13)
For simplicity in calculating confidence interval (CI) of WMC Fernández-Macho (2012) uses the (Fisher, 1915) transformation defined as arctan h(r) where arctan h(.) is the inverse hyperbolic tangent function. The CI is constructed on the same assumption of the realisation of X in the estimation of WMC and WMCC and hence for  in (8) then
 and
and  symbolise the folded normal distribution. Therefore, an approximate (1-α)CI for the true value of WMC is given by
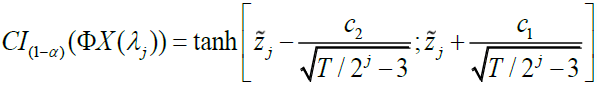 where the critical values c1, c2 are such that
  and
and as the standard Gaussian probability distribution function and
 as the value of some wavelet multiple correlation as set under certain null hypothesis of no correlation. For a complete reading on DWT, MODWT, WMC, and WMCC (Fernández-Macho, 2012; Carmona et al., 1998; In & Kim, 2013; Jansen & Oonincx, 2005; Marco & Semmler, 2014; Nason, 2010; Paparoditis, 2010; Tiwari et al., 2013).
In order to calculate WMC and WMCC the MODWT has to be applied to each of the daily and weekly stock index returns as indicated by Percival & Walden (2000). The superiority of the MODWT over DWT has been explained in Section 3. In the spirit of Fernández-Macho (2012) we have chosen to use j = 7 for daily returns and j = 5 for weekly returns, since the number of feasible wavelet coefficients gets critically small for high levels. Each j produces j number of wavelet coefficients and j - (j-1) scaling coefficient (Daubechies, 1992; Fernández-Macho, 2012; Gençay et al., 2001; Percival & Walden, 2000; Ranta, 2010). For the returns series in this paper the wavelet corresponding scales are given in Table 1.
Data Description and Statistical Properties
We have elected to use the wavelet multiple correlation and cross-correlation to measure the overall statistical relationship that might exist at differing scales among the stock market returns of seven (7) major stock exchanges in Africa; from the available data in the sample period chosen. We use both daily and weekly data as a test of robustness for our analysis and conclusions. The series span 4th January, 2011 to 29th November, 2017 and 7th January, 2011 to 24th November, 2017, for daily (1725 observations) and weekly (360 observations) frequency, respectively, extracted from Bloomberg Terminal. The analysis is based on the log-returns2 of these series calculated as  reducing each series by one. The desirability of using returns rather than price series for analysis needs no further explanations as it is extensively covered in extant literature.
We assess the distributional properties of the returns using the descriptive statistics reported in Table 2. The data shows that the mean of the weekly returns are higher than their daily counterparts. Both daily and weekly returns have positive mean returns except for Kenya which has an average of -0.0002 (daily) and -0.0007 (weekly). The mean ranges between 0.0000% and 0.0007% and variances between 0.0000% and 0.0019%. Also the standard deviations for the weekly returns are higher than the daily returns; hence they are more volatile and riskier than the latter. For daily skewness all returns are to the right except Morocco for daily frequency but for weekly only Morocco, Ghana, and Mauritius are all to the left. Thus, for Ghana and Mauritius huge negative stock returns have more leverage than huge positive returns for the weekly series than daily, however, for Morocco, regardless of frequency. All countries have positive kurtosis and thus are leptokurtic in returns for which Egypt recorded the highest. Lastly, the Jarque-Bera (JB) statistic rejects the null hypothesis of gaussianity in the stock returns for both daily and weekly frequencies for all countries. Pictorial representation of both prices and returns are shown in Figures 1 and 2. The stock markets were ordered arbitrarily as follows: Nigeria, Egypt, South Africa, Morocco, Kenya, Ghana, and Mauritius.

Figure 1 Time Series Plot of Selected Major ASMS indices returns

Figure 2 Time Series Plot of Selected African Stock Indices prices
Estimation Results and Analysis
This section presents the results and analysis of the estimations. As explained earlier, both bivariate and multivariate wavelets analysis are performed. The multivariate tool comprises multiple wavelet correlations and multiple wavelet cross-correlations.
Bivariate Interdependence of ASMs
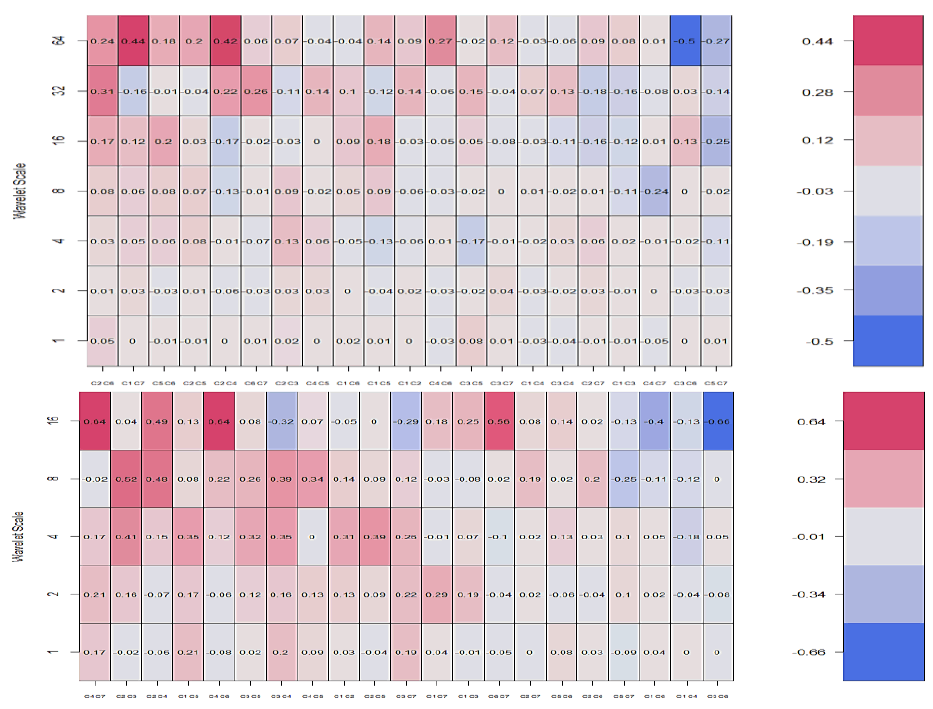
For the bivariate analysis we consider the contemporaneous correlations as shown in Table 3. The corresponding heatmaps have been provided in the Appendix. By convention in heatmaps the magnitude of contemporaneous correlations are indicated by the scale on the right of Figures 3-6 from blue to wine colour in ascending order.

Figure 3 Wavelet Multiple Correlations & cross-correlations Among Selected ASMS

Figure 4 Wavelet Multiple Cross-Correlations classical plots Among Selected ASMS

Figure 5 Bivariate Daily Correlations of Selected African Stock indices returns
Note key: C1 – Nigeria; C2 – Egypt; C3 – South Africa; C4 – Morocco; C5 – Kenya; C6 – Ghana; C7 – Mauritius

Figure 6 Multivariate Wavelet Cross-Correlations of Selected African stock returns
Note: Upper panel: multiple correlation (blue lines form 95% confidence boundary), Lower panel: multiple cross-correlation (dashed-lines indicate localisations).
We observe that bivariate wavelet correlations generally increase in degree and bearing for most of the pairs except for South Africa-Ghana which records the least correlation. Thus, the best of international diversification will come from this combination in the long-run from the bi-annual period. Also, we find that weekly wavelet correlations are stronger than daily pairs at the maximum scales. That wavelet correlations trend upwards with scale is indicative of stronger market linkages with increased investment time horizons. This corroborates the argument that benefits of diversification are more at lower scales.
Multivariate Interdependence of African Equity Markets
We then proceed to compute the WMC and WMCC which implicitly decomposes return series into time-frequency localisation by the MODWT (Fernández-Macho, 2012). From Table 4, all wavelet multiple correlations coefficients are significant at the various time scales for both daily and weekly stock returns except at the intraweek (2~4 day scale). They are comparatively high for the latter reaching as high as 0.91 at the longest and the lowest frequency (shown in the upper panel of Figure 3).
For daily returns market discrepancies are about at least 36% dashing hopes of integration until after bi-annual time periods. Moreover, there is not a continuous increment in multiple correlations over the horizon except from the fortnight scale. With the lowest coefficient of 0.080 with 2~4 days, differences in the markets are too strong at near highest frequencies. Thus, in the short-term leading up to six-months daily interdependence in these ASMs is unrealistic as only 64% of performance in one market can be explained by the rest. On the one hand, this could be the result of information asymmetry where market dynamics from one country takes some weeks to dissipate into others. If we contrast this with weekly market dynamics this seems plausible. In a similar study, Fernández-Macho (2012; 2011) attribute this to the actuation of different agents across the Euro markets with different trading horizons. In these situations there are benefits of international diversification by investing in a mixture of the stock indices in these seven African countries in the short term.
Thus, for weekly returns a very strong integration of ASMs is possible when considering periods of six-months to a year and beyond. This implies that weekly returns in one of these ASMs can be determined by the remaining six (6) to a degree of about a little more than 90% in the short-medium term of 29 weeks and 57-week trading year or more. Discrepancies in market performance magnify with increasing frequencies and lowering scales (market integration is very low in the very short-term), nonetheless increasing multiple correlations does not break down at any scale. The least (0.278) multiple correlations are recorded at highest scale of just 1~2 weeks and continue on a rising streak.
From the results of the WMC reported in Table 4 and the lower panel of Figure 3, we see the wavelet multiple cross-correlations (with localisations, time lag, lead/lag tendencies at the various scales) and their plots, respectively. Lags are up to 30 for daily returns and 5 for weekly returns. Countries listed in the plots and on Table 4 are those signaling a potential to lead or lag the others at the specific scales by maximising the multiple correlation against a linear combination of the rest of the stock markets. Further, the time lag at which the strongest or exact wavelet correlation coefficients are localised is indicated by the dashed lines (Figure 3, lower panel). For both daily and weekly returns we find that cross-correlations are stronger at lower frequencies and higher scales.
In order to determine the actual lead or lag of the stock market we further analysed the localisations vis-à-vis their time lags. Spillover effects are realised since localisations do not occur at the point of symmetry (i.e. zero time lag). Thus positive time lags are indicative of the lagging stock markets at the particular scale and the opposite is true for negative time lags. The wavelets multiple cross-correlations classical plots in Figure 4 is the delineated rendering of the heatmap in Figure 3 (lower panel).
In the daily wavelet multiple cross-correlations with the exception of Morocco (0.147) and Ghana (0.829) which lag (positive lags) at 11 and 30 days, respectively, all the other countries have leads (negative lags) at 3 days (0.12), 5 days (0.278), 15 days (0.309), 10 days (0.516), and 7 days (0.527) for South Africa, Kenya, Morocco, Kenya, and Egypt, in that order – localisation values are in parenthesis. Morocco lags both within 2~4 days but leads within 8~16 days, Kenya also leads both within 4~8 days and 16~32 days, South Africa with highest frequency in 1~2 days, Egypt in 32~64 days, and Ghana with the least frequency of bi-annual to annual. For the weekly wavelet multiple cross-correlations Ghana (0.924) and South Africa (0.658) lags all the seven countries at 3 weeks and 1 week at bi-annual to annual onward and month to quarter scales, respectively. Leading countries are Morocco (0.312), Mauritius (0.406) both at time lag of 1 week of intramonth and month scales with after Egypt (0.718) on the quarter to bi-annual scale at week 2. Kenya, however, has no lead or follow potential in the weekly returns. What’s the implication of this finding? There’s no particular leader in the continent. Different markets have the potential to lead at some point on the scale.
Conclusions and Policy Recommendations
This study underscores the increasing importance of regionalisation in the ASMs in recent years as financial market activity is gaining traction in the sub-region and subsequently the implications for trade and investment with developed economies. That is to say the interdependence and co-movements across markets and regions may never be overemphasised. In divergence from the traditional literature of correlation and cointegration as well as bivariate analysis of interdependence in international finance, we have employed the novel WMC and WMCC to assess the time-frequency co-movement of stock returns of seven major exchanges in Africa using daily and weekly data.
Our results indicate that correlations generally increase in degree with scale. Weekly returns suggest a very strong integration of ASMs is possible when considering periods of six-months to a year and beyond. Further, we find that weekly returns in one of these ASMs can be determined by the remaining six to a degree of about 90% in the short-medium term. Whereas market discrepancies are at least 10% for weekly returns, the same is about at least 36% for daily returns market and hence prospects of integration are until after bi-annual time periods. Nonetheless daily and weekly returns show similar scales starting from bi-annual time periods for stronger market interdependence. Weak short-term market co-movements can be attributed to information asymmetry; thus market dynamics from one country may take time to dissipate into others. On the other hand, we could blame the actuation of different agents across the African markets with different trading prospects as argued by Fernández-Macho (2012).
For investors, it is apparently instructive that there are prospects of international diversification by investing in a mixture of African stocks only in the short-term prior to bi-annual time periods except for a specific carefully selected bivariate pairs. We also find that lead/lag localisation points are not symmetric and thus point to actual lead or lag situations across markets at different scales. For daily returns, only Nigeria and Mauritius lack the potential of serve as market leaders, whereas Nigeria and Kenya are in this category for weekly returns. This reveals the different processes involved in the data generating process for daily and weekly prices even for the same stock market index and hence investment decisions must consider the periodicity of the time series.
The fact that integration levels are remote in time suggest there is more room for the stock markets in Africa to advance the strides to bridge the inherent structural and liquidity dissimilarities plaguing them. When these are adequately addressed stronger cross-correlations are likely to be realised at very high frequencies (lower scales) than currently to foster prospects of interdependence with the other emerging and advanced markets sequentially. This will engender more innovative ways of making profits by investors and portfolio managers alike since markets will be more similar than disparate.
End Notes
1 This is achieved by permutation; nPr, where n = 7, r = 2
2 Pt and Pt-1 are stock prices (in US dollars) at time and t-1, respectively.
Appendix
Acknowledgement
The authors wish to thank Wen-Yi CHEN for her insights and help with some R codes.
Funding: This research did not receive any specific grant from funding agencies in the public, commercial, or not-for-profit sectors.
References
- Agyei-Ampomah, S. (2011). Stock market integration in Africa. Managerial Finance, 37(3), 242-256.
- Alagidede, P. (2010). Equity market integration in Africa. African Review of Economics and Finance, 1(2), 88-119.
- Alagidede, P., Panagiotidis, T., & Zhang, X. (2011). Causal relationship between stock prices and exchange rates. The Journal of International Trade & Economic Development, 20(1), 67-86.
- Aloui, C., & Hkiri, B. (2014). Co-movements of GCC emerging stock markets: New evidence from wavelet coherence analysis. Economic Modelling, 36, 421-431.
- Bekaert, G., Harvey, C.R., & Lumsdaine, R.L. (2002). Dating the integration of world equity markets. Journal of Financial Economics, 65(2), 203-247.
- Boako, G., & Alagidede, P. (2018a). African stock markets in the midst of the global financial crisis: Recoupling or decoupling? Research in International Business and Finance.
- Boako, G., & Alagidede, P. (2018b). Systemic Risks Spillovers and Interdependence among Stock Markets: International Evidence with Covar-Copulas. South African Journal of Economics, 86(1), 82-112.
- Boamah, N.A. (2015). Financial market integration: Implications for asset pricing and diversification gains on the emerging African stock markets (ASMs). PhD Thesis, Macquarie University, Sydney.
- Boamah, N.A. (2016). Regional and global market integration of African financial markets. African Review of Economics and Finance, 8(2), 234-268.
- Brooks, R., & Del Negro, M. (2004a). Country versus region effects in international stock returns. Retrieved from https://www.frbatlanta.org/-/media/documents/research/publications/wp/2002/wp0220b.pdf
- Brooks, R., & Del Negro, M. (2004b). The rise in comovement across national stock markets: market integration or IT bubble? Journal of Empirical Finance, 11(5), 659-680.
- Carmona, R., Hwang, W.L., & Torresani, B. (1998). Practical Time-Frequency Analysis: Gabor and wavelet transforms, with an implementation in S (9). Academic Press.
- Collins, D., & Biekpe, N. (2003). Contagion and interdependence in African stock markets. South African Journal of Economics, 71(1), 181-194.
- Daubechies, I. (1992). Ten lectures on wavelets. SIAM. Retrieved from http://epubs.siam.org /doi/pdf/10.1137/1.9781611970104.fm
- Durai, S.R.S., & Bhaduri, S.N. (2009). Stock prices, inflation and output: Evidence from wavelet analysis. Economic Modelling, 26(5), 1089-1092.
- Fernández-Macho, J. (2012). Wavelet multiple correlation and cross-correlation: A multiscale analysis of Eurozone stock markets. Physica A: Statistical Mechanics and Its Applications, 391(4), 1097-1104.
- Fisher, R.A. (1915). Frequency Distribution of the Values of the Correlation Coefficient in Samples from an Indefinitely Large Population. Biometrika, 10(4), 507-521
- Forbes, K.J., & Rigobon, R. (2002). No contagion, only interdependence: measuring stock market comovements. The Journal of Finance, 57(5), 2223-2261.
- Gençay, R., Selçuk, F., & Whitcher, B. J. (2001). An introduction to wavelets and other filtering methods in finance and economics. Academic press. Retrieved from https://books.google.com/books?hl =en&lr=&id=3ZLTt50EUT8C&oi=fnd&pg=PP1&dq=time+varying+cointegration+wavelets&ots=aYiy-3Pdc6&sig=4-JZcc6hYHFCJZTqTH8vxA3Cyjo
- Gourène, G.A.Z., Mendy, P., & N’gbo Ake, G.M. (2019). Multiple time-scales analysis of global stock markets spillovers effects in African stock markets. International Economics, 157, 82-98.
- Grubel, H.G. (1968). Internationally diversified portfolios: Welfare gains and capital flows. The American Economic Review, 58(5), 1299–1314.
- In, F., & Kim, S. (2013). An introduction to wavelet theory in finance: a wavelet multiscale approach. World Scientific. Retrieved from https://books.google.com/books?hl=en&lr=&id=D3O6CgAAQBAJ&oi =fnd&pg=PR5&dq=in+and+kim+book++Wavelet&ots=Hw6MzzNMtx&sig=1U8Q1WSo1CwPEBnclbGvVzCJRtU
- Jansen, M.H., & Oonincx, P.J. (2005). Second generation wavelets and applications. Springer Science & Business Media.
- Karolyi, G.A., & Stulz, R.M. (1996). Why do markets move together? An investigation of US-Japan stock return co-movements. The Journal of Finance, 51(3), 951-986.
- Marco, G., & Semmler, W. (2014). Wavelet Applications in Economics and Finance, (Marco Gallegati) Springer (1st Edition). Switzerland: Springer International Publishing.
- Marozva, G. (2017). Africa stock markets cross-market linkages: A time-varying dynamic conditional correlations (DCC-GARCH) approach. Journal of Applied Business Research, 33(2), 321.
- Mensah, J.O., & Alagidede, P. (2017). How are Africa’s emerging stock markets related to advanced markets? Evidence from copulas. Economic Modelling, 60, 1-10.
- Nason, G. (2010). Wavelet methods in statistics with R. Springer Science & Business Media.
- Paparoditis, E. (2010). Wavelet Methods in Statistics with R. Journal of the Royal Statistical Society: Series A (Statistics in Society), 173(1), 273-273.
- Percival, D.B., & Walden, A.T. (2000). Wavelet methods for time series analysis, vol. 4 of Cambridge Series in Statistical and Probabilistic Mathematics. Cambridge University Press, Cambridge, UK.
- Ranta, M. (2010). Wavelet multiresolution analysis of financial time series. Universitas Wasaensis. Retrieved from http://www.uva.fi/materiaali/pdf/isbn_978-952-476-303-5.pdf
- Tong, C., Chen, J., & Buckle, M.J. (2018). A network visualization approach and global stock market integration. International Journal of Finance & Economics, 23(3), 296-314.
- Tiwari, A.K., Dar, A.B., Bhanja, N., & Shah, A. (2013). Stock market integration in Asian countries: Evidence from wavelet multiple correlations. Journal of Economic Integration, 441-456.
- Yang, J., Kolari, J.W., & Min, I. (2003). Stock market integration and financial crises: the case of Asia. Applied Financial Economics, 13(7), 477-486.