Research Article: 2021 Vol: 24 Issue: 3
Internet services: customer relationship management (CRM) using internet of things (IoT)
Mansoureh Zare, Department of Information Technology and Computer Engineering, Islamic Azad University
Ali Reza Honarvar, Department of Information Technology and Computer Engineering, Islamic Azad University
Citation Information: Zare, M., & Honarvar, A. R. (2021). Internet services: customer relationship management (CRM) using internet of things (IoT). Journal of management Information and Decision Sciences, 24(3), 1-24.
Abstract
Internet of things facilitates relationships in the business world. With the increased usage of new Internet services in the country and with respect to the intense competition between businesses, these organizations should pay special attention to customer relationship management in order to survive and grow in the market. The goal of this study is to analyze customer relationship management in the state-of-the-art Internet services using IoT. This research is an applied research in terms of its goal, and in terms of data gathering, it is a descriptive survey study. In order to collect data, electronic questionnaire is designed. After data acquisition, by using structural equations model, study’s hypotheses are tested and SPSS and LISREL software are used to analyze the data. Based on the results from the study, components of CRM (loyalty, understanding demands, quality of service, customer orientation, flexibility, Interaction) are effective in the success of Internet services.
Keywords
Customer relationship management; Internet services; Internet of things.
Introduction
Ever increasing growth of information and the pivotal role of the internet in the human life has brought about new events which have changed the way of doing procedures. The connection of users to the Internet and data exchanging and relations between things through sensors and tags has created a network of things, able to communicate anywhere and anytime. Today, IoT facilitates the development of new programs and modifying the existing ones. Certainly, the main ability of IoT is its huge impact on different aspects of today’s life. Social life, smart homes, offices, health centers, improving level of education are just a few examples of scenarios in which IoT is being used. Currently, the internet connects all the people to each other, but with IoT, all devices connect to each other and it’s possible to manage and control those using smartphones and tablets (Ashton, 2009).
In this regard, Internet services, e.g. Taxi sharing and food delivery applications, make many changes in people’s lives in a way that people tend to meet their demands in the easiest way. With these explanations, the necessity of using these services is clear and service owners should plan carefully in order to better manage the relationship with customers. Due to increasing growth of Internet services, the aim of this study is to investigate CRM on new Internet services using IoT and smart city and the main question is what roles CRM plays in the success and development of new Internet services.
Having an effective relationship with the customers is the most important key to success in any business. About these relationships, it can be said that companies use social media in order to directly contact with customers, increase traffic of their website, discover new business opportunities, create branding societies, content distribution, gathering feedback from customers and, in general, support their brand (Gao & Feng, 2016). With the advent of smart phones and consequently, social media, access to different information has reached to its all-time high in human history. Currently, it can be seen that customers are asked to like companies’ contents on Facebook, follow companies’ pages on Twitter or join companies’ pages on LinkedIn. For this reason, through social media customers have better and more relationship with companies which provide services and products have more information about products and services and are more powerful in the relationship between vendor and customer (Agnihotri et al., 2016).
When we talk about trust and managing relationships with customers, IoT is the primary decider. IoT is able to do more than only gathering data or organizing client information and it is also able to analyze clients’ information with a high accuracy and with taking different aspects into account and provides valid and accurate results. This is especially important for marketers due to the fact that the demand chain in customers is usually long and deciding about them requires more time, IoT can help to reduce the processing time, smart devices, by simplifying this procedure and by providing functional information, inform marketers about customers’ future decisions about buying again. By this way, marketers, by evaluating the current situation, provide better opportunities for their clients which results in customer satisfaction.
Internet services follow IoT and smart city but they are not analyzed from CRM point of view, the lack of effective and adequate CRM systems in services causes problems for customers and service staffs. For example, in Internet taxies, especial measures can be taken so a person who uses a specific route every day, by using interaction between driver and client, be able to save the precise address in the system (by driver and client), so in the next calls between other drivers and the client, there is no need to find the exact address of the origin. So focusing on CRM components and their effects on smart city can be beneficial. The approach of this study includes a relation between service relationships with staffs and customers and their success which reach to a sustainable competitive advantage by CRM and interaction using IoT.
Preliminaries
Today’s competitive world has made organizations to pay more attention to customers and instead of mass and efficient production; they put emphasis on customers and their satisfaction. IoT leverages marketing to a whole new level. Not a single part of living, product, service, and solution is non-marketable. Currently, the internet penetrates into a lot of our everyday behavior. Since all of us have connected interaction, behavior, and life, with the advent of IoT, marketers enter into our life deeper and provide us with what we demand. Each consumer and business program and each product converges to data produced from our things (Gao & Feng, 2016). To this regard, it can be said that in a smart city, IT and communications are key factors to support services to citizens (most important part of a smart city) (Wenge et al., 2014) and regarding the advent of new businesses and evolution of existing businesses, investigating effective components of CRM using IoT and smart city provides a useful insight of Internet services’ success in the country.
Customer relationship management
Customer relationship management is a comprehensive strategy for business and marketing in which unifies all process and business activities around the customer. CRM is an integrated information system which is used to plan, schedule and control activities before and after sales in the organization and with the goal of making customers capable of interacting with the organization through various tools such as website, phone, social media, etc (Hollensen, 2015).
Internet of things
In general, IoT means the connection of many of our surrounding devices and things to the internet and our ability to control them through tablets and smartphones. By using IoT, all thing are connected to each other. IoT is a network which connects every device to the internet, through various devices, e.g. sensor devices such as RFID, microwave, GPS, scanner. International Communication Union (ITU) defines IoT as a connection which exists at any time, everywhere for everyone (Esmaeil, 2016).
New internet services
Smartphones are ubiquitous these days. Every year, many applications are published which part of them are provided by internet service companies to facilitate the communication and interaction with customers and staffs. So it is safe to claim that new internet services are services using IoT and smart city and utilize science and technology. For example, Uber services, Tesco smart shopping centers and also in Iran, services like Snapp, Tap30, Chilivery, Snappfood, Reyhoon, DigiKala, AloPeik, DigiStyle, etc. exist and the number of these applications is growing every day. Also, IoT draws manufacturers’ and customers’ attention as a state-of-the-art technology and it’s being used in online businesses.
Components of CRM in This Study
Customer orientation
Putting the customer on top of the organization and noticing their demands in order to create value is called customer orientation which is beneficial for the organization in a long term.
Loyalty
Customer loyalty is one the most important components of CRM, the most valuable property of an organization is its clients so a loyal customer is someone who has a commitment to the organization and its brand and even by receiving better advantages from company’s competitors, he won’t lean toward them. Customer satisfaction is the most important factor in customer loyalty so a satisfied customer can turn into a loyal customer.
Understanding demands
The word ‘understanding’ considers description, acquisition, saving, converting and consuming knowledge and about understanding customer demands, it can be said that understanding customers’ necessities and expectations, their mentality, and tendencies is of interest and efforts for meeting customer’s needs and consequently profitability of customer is only possible by understanding his demands.
Interaction
Interaction means the mutual communication between client and company owners, this communication results in hearing client’s voice, online interactions and discussions speed-up providing services to the client and make him satisfied.
Today, these interactions are very easy thanks to social media, in another definition, social media are considered as interactive networks in which create communication between various groups of people through IT and computers (Shen et al., 2017). Regarding the fact that social media has become an integrated part of smart cities, it can be said that social media are effective in communication with customers (Katsoni & Velander, 2017; Belias et al., 2018).
Quality of service
Quality has a broad meaning and all sections of an organization are committed to it and the goal is to leverage the quality of the entire company, in a way that prevents quality deteriorating factors. Its ultimate goal is to completely correspond to customer’s demands with the lowest possible costs for the company which leads to the increase in the ability to compete (Agnihotri et al., 2017).
Flexibility
Flexibility is emphasized as an organizational capability in which enables companies to gain competitive advantage, to preserve it and to improve performance in today’s competitive and dynamic business environment (Zhang, 2005). Also, organizational flexibility is imagined as the company's dynamic ability to respond to the changing competitive environment which may create a sustainable competitive advantage for the company (Ketkar & Sett, 2010).
Literature Review
Yerpude & Singhal (2018b) have presented a study titled "Achieving Custeomer Excellence Through IoT Enabled Customer Service.” The objective of this article is to establish the linkage between customer service and customer excellence vide IoT supported connected customer and establish the important factors impacting customer excellence with its relation on repeat purchase and brand loyalty. The article also brings out the transition of the customer from the transactional marketing (traditional) to a Relationship Marketing (current) business process. In this journey, Customer Relationship Management (CRM) plays a vital role. It is proven beyond doubts that the prevalent benefits of CRM are Customer retention and Customer satisfaction. It is emblematic that both customer retention and customer satisfaction fit in the customer service domain. Customer service is the support offered to the customers before and after the product is bought that enables the customer to enjoy the product and experience. The Customer Experience originates from a set of interactions between a customer and a product, a company, or part of its organization, which provoke a reaction. The demand of product, quality and purpose of similar products doesn’t change greatly. The point of competition in such cases surfaces as Customer Service. Typically, in an automobile industry, it’s established that the customer interaction is annually almost three times in service than that happened during the sale transaction. In such cases it is imperative to maintain the customer connect post sales. Connected customer helps move the engagement of the customer and the organization towards excellence. This engagement is greatly influenced by the data and the information generated from the data. It is very crucial to have real time data to award a seamless customer experience to the customer during service. Real time data is originated from different technology landscapes. One such landscape is Internet of Things (IoT). It is profoundly a network of dedicated physical objects (things), which contain embedded technology to sense or interact with their internal state or the external environment. Real time data originated from the IoT landscape helps improve the experience and effectiveness of the connected customer concept in the customer service domain. It enables the organization to build the customer relationship in a much more transparent way and enables trust in the entire engagement contributing to a better customer experience. This brings in the required customer excellence in the process moving the organization a couple of notches above its competitors in the race of creating a differentiator for a brand. Eventually the end result of this entire exercise is better contribution with a higher top line and lower bottom line. The primary data was collated for establishing the above facts, which were derived from the secondary data. Statistical testing was conducted on SPSS and AMOS, in two steps. First step included building of the conceptual model first and conducting the factor testing by exploratory factor analysis. Step two consists of Confirmatory tests for the factors and testing the relationship regression weights by structural equation modelling method and confirming the hypotheses formed before testing of the model. The empirical validation of the connected customer concept has been offered by Yerpude & Singhal (2018b).
Yerpude & Singhal (2018a) have presented a study titled "Internet of Things Based Customer Relationship Management-A Research Perspective". In this research to study the impact of Internet of things (IoT) on the Customer Relationship Management process and evaluate the benefits in terms of customer satisfaction and customer retention. Methods: An extensive literature review was conducting wherein the constructs of CRM and IoT are studied. Various preliminary information on IoT and CRM system along with the components of Digital enablers have been evaluated. References from research papers, journals, Internet sites, statistical data sites and books were used to collate the relevant content on the subject. The study of all the relevant scenarios where there is a possible impact of IoT origin real time data on CRM was undertaken. Findings: Customer demands are continuously evolving and it is very relevant for all the organizations to align and keep pace with the change. Organizations need to be customer centric and agile to the changing market scenarios. Evaluation of the trends in mobile internet vs desktop internet was also conducted to validate the findings. Application: The usage of real time data emerg-ing out of the IoT landscape has become a reality with the data transmitted over the Internet and consumed by the CRM system. It im-proves the control on the customer relationship function helping the organizations to operate within healthy and sustained profit Yerpude & Singhal (2018a).
Fang et al. (2016) have presented a study titled "Assessing the Factors Affecting the Repetition of Purchases in E-Commerce". In this research, behavioral and cognitive theories and its impact on the repetition of the purchasing process in the online purchase and e-commerce are investigated. Fuzzy logic has been used to investigate the qualitative factors and the results of the research indicate that behavioral, emotional and cognitive factors, along with information and IT quality influence decisions made by customers and consumers. In this study, correlation and regression tests are uses in SPSS software (Fang et al., 2016).
Zhao et al. (2014) have presented a study titled “Assessing the structure of consumer goals in online purchases”. Given the growing trend of online shopping, paying attention to consumer goals in these purchases is of great importance in online marketing and customer management. For this purpose, 52 consumers were investigated by interview. Finally, 27 goals have been achieved for consumer purchases. This research, with a qualitative approach, has presented a hierarchical model of consumers’ and buyers’ goals (Zhao et al., 2014).
Sen and Lerman (2007) found out that in choosing and deciding utilitarian products, consumers have an approach to maximize the benefits and performance and their judgments are based on cognitive and purposeful activities, and the consumers pay attention to the immediate consequences of consumption, and the purpose of utilitarian consumption is to increase benefits for them if this feature (being beneficial) is high, they buy from the same website again.
Research Hypotheses
Main Hypothesis
Components of CRM have a meaningful relation with the success of new Internet services which use IoT.
Secondary Hypotheses
H1: Customer loyalty has a meaningful relation with the success of new Internet services which use IoT.
H2: Understand demands have a meaningful relation with the success of new Internet services which use IoT.
H3: Quality of service has a meaningful relation with the success of new Internet services which use IoT.
H4: Customer loyalty has a meaningful relation with the success of new Internet services which use IoT.
H5: Flexibility has a meaningful relation with the success of new Internet services which use IoT.
H6: Interaction has a meaningful relation with the success of new Internet services which use IoT.
Methodology
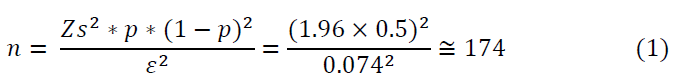
In this article, important aspects of customer relationship management for new Internet services have been explored. The required information was obtained through questionnaires. The methodology of the present research is to investigate the status quo in terms of what has been achieved and the researcher is not allowed to do any manipulation to the independent variables, but we can use the research findings to suggest or design a model. Therefore, it can be said that this research is a descriptive study based on the way the data is obtained and since the data are collected through community sampling to examine the distribution of characteristics of the statistical society, this research is from the survey branch. It is also an applied research if we consider the goal. An applied research is an attempt to respond to a real and scientific problem that exists in real world. So this research, according to the descriptive nature and the defined purpose, is of the applied type and the basis of how to do it is surveying. The statistical population of this research is all the customers, employees and owners of Internet services (e.g. Snapp, Tap30, Chilivery, Snappfood, Digikala, Digistyle, Alopeyk, etc.). The sample size will be calculated based on the number of people in the community. According to the research community in this study, the population under study in this research is all people who are in some way associated with Internet services (such as employees, owners and customers). This statistical population is unlimited, so the number of samples were calculated using equation 1.
Since the present study is conducted in a survey-based way, three researcher-made questionnaires have been used to collect information and with respect to the subject variables and the relation between the components of the research, required data in the study is collected. The designed questionnaire to collect opinions about the topic of research comprises two parts as follow:
1. Demographic Design: This section of the questionnaire is designed to receive information about the level of education, gender, etc.
2. Designing section of Questions: This section is in-line with the objectives and research questions.
Since in the design of the questionnaire paying attention to the scale and the defined spectrum is necessary in order to convert the quality indices into measurable quantitative indices, therefore, in order to quantify the qualitative variables, the relative scale and Likert scale will be used. The scales in the Likert spectrum ranging from 1 to 5 with definitions of very low, moderate, high and very high will be given to the responders. Credibility or validity refers to the rational connection between the test questions and the measured subject. When it is said that the test is valid, it means that the test questions accurately measure what is desired. In this study, content validity ratio (CVR) is used and the value of CVR is 0.8 based on 10 experts which is larger than 0.62. So the questionnaire has content validity. Reliability depends on, how much the instrument gives the same results under the same condition. To calculate the reliability coefficient of the measurement tool, different methods are used. In this study, to examine the reliability of the tool, Cronbach's alpha coefficient is used. The alpha coefficient indicates that the questions were overlapping and aligned, and the responders answered the questions with care and awareness. In a test with research objectives, the closer is the Cronbach's alpha index to 1, the more is internal consistency between the questions and consequently questions will be more homogeneous.
Cronbach proposes 45% reliability coefficient as low, 75% as moderate and acceptable, and 95% as high. The results of the Cronbach's alpha test are shown in Table 1. Based on the results from Cronbach's alpha test, the value of all variables is more than 0.7 so the questionnaire has an acceptable reliability.
Table 1 Cronbach's Alpha Test Results |
|
| Dimension | Cronbach's alpha |
| Customer Loyalty | 0.816 |
| Understanding Demands | 0.817 |
| Quality of Service | 0.798 |
| Customer Orientation | 0.852 |
| Flexibility | 0.854 |
| Interaction | 0.709 |
| CRM | 0.775 |
| Success of new Internet Services | 0.825 |
The territory of the subject of the present research is to investigate in new online services using Internet of Things and smart city. The realm of the place of the present research is the web sites and social networks of Internet services (including Instagram and Telegram), the Internet platform.
In this study, with respect to the existing types of divisions, descriptive and inferential analysis was used to analyze the data. In the descriptive method, conclusion and inference were not derived from the findings and the obtained information is only classified and presented. Therefore, it is important to note that no hypothesis is made in this method. In other words, this research only deals with the description and interpretation of existing conditions and relationships. This kind of research only studies the status quo.
The descriptive research describes and interprets what is present and pays attention to the existing situations or relationships, common beliefs, current processes, evident effects, or growing trends. Its focus is primarily on the present. However, it often focuses on past events and phenomena that are relevant to existing conditions. In the inferential method, the researcher uses the sample values to calculate the statistics and then, with the help of estimation or statistical hypothesis test provides statistics to community parameters. Inferential statistics are used to analyze the data and test the research hypotheses. It can be said that in most statistical activities, collecting, arranging and presenting findings or determining the statistics is not enough, but it is necessary that, based on the collected and arranged data, analysis and inferences be done for explanation and decision making. This section of statistics, which relies on the analysis, interpretation, and generalization of the results from the adjustment and preliminary computation of statistics is called inferential statistic. Using the inferential statistics methods, the characteristics of statistical population can be derived from samples.
In this research, in order to analyze the data, existing methods of descriptive statistics such as mean, variance, standard deviation, frequency and frequency of research variables have been used. To analyze the data and to answer the research hypotheses, inferential statistics including Friedman rankings and structural equations have been used to determine the relationships between quantitative and qualitative characteristics and prioritization of the research criteria with SPSS and LISREL software. In this study, a structural model is fitted, which uses structural equation model to confirm or disapprove the research hypotheses.
Results
Descriptive and Inferential Statistical Techniques
Using descriptive and inferential statistical techniques the data is analyzed. Descriptive statistics such as frequency and percentage are used to investigate and analyze information about the general characteristics of responders. In the inferential statistics section, the test of normality of the distribution is performed. Then, using the LISREL software, the hypothesis test is analyzed and then, using structural equations modeling, relations between the variables and the research hypotheses are examined. Descriptive statistics criteria have been used to describe the general characteristics of responders. Frequency of responders has been studied based on gender, age and education, and the respective charts have been drawn. The distribution of gender in the samples is presented in Table 2 and Figure 1. Based on the results in this study, 59 (33.9%) were female and 115 (66.1%) were male.
| Table 2 Gender Distribution in the Tested Sample | |||
| Gender | Abundance | Percent | Percentage of cumulative frequency |
| Male | 59 | 33.9 | 33.9 |
| Female | 115 | 66.1 | 100 |
| Total | 174 | 100 | |

Figure 1 Gender Distribution in the Tested Sample
The distribution of age in the sample is presented in Table 3 and Figure 2. Based on the results the highest frequency is observed in the age group of 25 to 35 and based on the observations 106 people (61.6%) were in this age range.
| Table 3 Age Distribution in the Tested Sample | |||
| Age | Abundance | Percent | Percentage of cumulative frequency |
| Less than 25 years old | 20 | 11.4 | 11.4 |
| 35- 25 years | 106 | 61.1 | 72.5 |
| 45-35 years | 39 | 22.4 | 94.9 |
| 45 years and older | 9 | 5.1 | 100 |
| Total | 174 | 100 | |

Figure 2 Age Distribution in the Tested Sample
The distribution of education in the sample is presented in Table 4 and Figure 3. As it can be seen most sample subjects were expert (46.55 people).
| Table 4 Education Distribution in the Tested Sample | |||
| Percentage of cumulative frequency | Percent | Abundance | Education |
| 3.45 | 3.45 | 6 | Under the diploma |
| 12.07 | 8.62 | 15 | Associate Degree |
| 58.62 | 46.55 | 81 | Bachelor |
| 100 | 41.38 | 72 | Supplementary |
| 100 | 174 | Total | |

Figure 3 Education Distribution in the Tested Sample

Figure 4 Standard Factor Loading of Independent Variables
Descriptive analysis of research variables based on central parameters (mean and mode) and dispersion parameters (standard deviation, variance and range of changes) are presented in Table 5 for the main research elements. Based on this table, it is clear that 174 correct answers to all research questions have been gathered. Also, customer relationship management has the highest average with 47.454, which is also higher than the high Likert range. The range varies from 3 to 63. Median and mode show that most responders choose option 3 and 4, mean medium and high.
| Table 5 Mean and Standard Deviation of Tested Criteria | |||||||
| Total | Range | Minimum | Maximum | Average | Standard Deviation | Variance | |
| Customer Loyalty | 174 | 7 | 3 | 10 | 7.609 | 1.608 | 2.586 |
| Understanding Demands | 174 | 12 | 3 | 15 | 10.793 | 2.322 | 5.39 |
| Quality of Service | 174 | 12 | 3 | 15 | 10.973 | 2.368 | 5.609 |
| Customer Orientation | 174 | 8 | 2 | 10 | 7.287 | 1.756 | 3.085 |
| Flexibility | 174 | 7 | 3 | 10 | 7.402 | 1.743 | 3.04 |
| Interaction | 174 | 12 | 3 | 15 | 11.19 | 2.654 | 7.045 |
| Success of new Internet Services | 174 | 7 | 3 | 10 | 7.437 | 1.823 | 3.323 |
| CRM | 174 | 60 | 3 | 63 | 47.454 | 9.124 | 83.255 |
Inferential statistics methods have been used to answer the research hypotheses and questions. First, test of normality of data is taken to determine if parametric methods can be used. Then case-wise, appropriate statistical methods and mean populations tests have been used. To verify normality of the distribution of data, Kolmogorov-Smirnov test was used, the results of which are presented in Table 6.
| Table 6 Results of Kolmogorov-Smirnov Test | |||
| Test statistic | Significance level | Results | |
| Customer Loyalty | 0.036 | 0.212 | Normal |
| Understanding Demands | 0.06 | 0.089 | Normal |
| Quality of Service | 0.023 | 0.154 | Normal |
| Customer Orientation | 0.003 | 0.412 | Normal |
| Flexibility | 0.089 | 0.094 | Normal |
| Interaction | 0.004 | 0.27 | Normal |
| CRM | 0.092 | 0.056 | Normal |
| Success of new Internet Services | 0.036 | 0.141 | Normal |
The results of Table 6 show that the distribution of all variables are normal, since the condition for accepting the normality for the variables is the rejection or meaninglessness of Kolmogorov-Smirnov test. As you see, the amount of level of meaningfulness for all variables is greater than 0.05. As a result, the test is rejected and “having a normal distribution” hypothesis is confirmed.
The confirmatory factor analysis investigates the relationship between the items (questionnaire questions) and the structures. Confirmatory factor analysis is used to prove that the data are accurately measured. The power of the relationship between the agent (hidden variable) and the visible variable is shown using factor loading.
The results of the factor analysis of variables of customer relationship management dimensions are presented in Figure 4. Factor loading in all cases has a value greater than 0.3. The correlation between hidden variables (dimensions of each of the main structures) with visible variables is acceptable. After the correlation of the variables is identified significance test should be performed. In order to investigate the significance between variables, t statistic is used.
Since significance is checked at the error level of 0.05, if the test statistic t is larger than the critical value of 1.96, then the relationship is significant. Based on the results of the measurement indicators of each scale used at confidence level of %5, the value of t is greater than 1.96, which indicates that the observed correlations are significant. This analysis is shown in Figure 5.

Figure 5 T Statistic of Confirmatory Factor Analysis of Independent Variables
The results of factor analysis of customer relationship management variable are presented in Figures 6 and 7. Based on the results of the measuring indicators of each of the scales used at the confidence level of 5%, the value of the t statistic is greater than 1.96, indicating that the observed correlations are significant.

Figure 6 Standard Factor Loading of Independent Variables

Figure 7 T Statistic of Confirmatory Factor Analysis of Independent Variables
The ratio of chi-squared to degree of freedom for this structure is 2.325 and the value of RSEM s 0.088 which indicates the desirability of the estimated structure.
Standard Factor Loading of Factor Analysis of Dependent Variable
The results of factor analysis of “success of new internet services using IoT” variable are presented in Figures 8 and 9. The observed factor loading in all cases is greater than 0.3, which indicates that the correlation

Figure 8 Standard Factor Loading of Factor Analysis of Dependent Variable

Figure 9 T Statistic of Confirmatory Factor Analysis of Dependent Variables
The ratio of chi-squared to degree of freedom for this structure is 1.056 and the value of RSEM is 0.018 which indicates the desirability of the estimated structure.
Research Hypotheses Test
After confirming the factoring structure of the research structures, to study the relationships between variables, structural equations modeling was used. The results of the analysis are presented separately.
Main hypothesis
The components of customer relationship management have a meaningful relation with the success of the new internet services using Internet of things.
According to the findings of the research and the goodness of the fitting of the estimated model, the research findings shows customer relationship management has a significant impact on the success of new Internet services using Internet of things. The coefficient of this path is equal to 1.14 and the value of the t statistic is 6.71, which confirms the significance of the estimated coefficient (Figures 10 and 11). As a result, the present hypothesis is confirmed.

Figure 10 Standard Factor Loading of Research Hypothesis Test

Figure 11 T statistic of Confirmatory Factor Analysis of Dependent Variables
Secondary Hypotheses
The estimated model is presented in Figures 12 and 13 for studying secondary hypotheses. According to the findings of the research, the values of the calculated criteria are within acceptable limits, which indicate the desirability of the fitted model.

Figure 12 Factor Loadings for Studying Secondary Hypotheses

Figure 13 Values of T in the Fitted Model for Studying Secondary Hypotheses
Considering the confirmation of the goodness of the fitting model, in the following parts, we explore the secondary hypotheses.
H1: Customer loyalty has a meaningful relation with the success of new Internet services which use IoT.
The findings of the study showed that the coefficient of customer loyalty path to the success of Internet services using IoT is 0.62. The t-statistic for this path is 5.23, which is bigger than 1.96 and indicates the significance of the test at a confidence level of 95%. As a result, the current hypothesis is confirmed.

H2: Understand demands have a meaningful relation with the success of new Internet services which use IoT.
The findings of the study showed that the coefficient of understanding demands to the success of Internet services using IoT is 0.49 and the t-statistic for this path is 4.41, which is bigger than 1.96 and indicates the significance of the test at a confidence level of 95%. As a result, the current hypothesis is confirmed.

H3: Quality of service has a meaningful relation with the success of new Internet services which use IoT.
The findings of the study showed that the coefficient of quality of service to the success of Internet services using IoT is 0.55 and the t-statistic for this path is 3.16, which is bigger than 1.96 and indicates the significance of the test at a confidence level of 95%. As a result, the current hypothesis is confirmed.

H4: Customer orientation has a meaningful relation with the success of new Internet services which use IoT.
The findings of the study showed that the coefficient of customer orientation to the success of Internet services using IoT is 0.54 and the t-statistic for this path is 4.25, which is bigger than 1.96 and indicates the significance of the test at a confidence level of 95%. As a result, the current hypothesis is confirmed.

H5: Flexibility has a meaningful relation with the success of new Internet services which use IoT.
The findings of the study showed that the coefficient of flexibility to the success of Internet services using IoT is 0.61 and the t-statistic for this path is 5.29, which is bigger than 1.96 and indicates the significance of the test at a confidence level of 95%. As a result, the current hypothesis is confirmed.

H6: Interaction has a meaningful relation with the success of new Internet services which use IoT.
The findings of the study showed that the coefficient of interaction to the success of Internet services using IoT is 0.38 and the t-statistic for this path is 2.87, which is bigger than 1.96 and indicates the significance of the test at a confidence level of 95%. As a result, the current hypothesis is confirmed.

Ranking CRM Components
At this stage, after research’s main hypotheses test, in order to obtain the importance ranking of the components of CRM, the results of Friedman test are presented in Table 7.
| Table 7 Friedman Test Results | ||
| Criterion | Average ranking | Ranking |
| Customer Loyalty | 3.79 | First |
| Understanding Demands | 3.24 | Sixth |
| Quality of Service | 3.4 | Fourth |
| Customer Orientation | 3.35 | Fifth |
| Flexibility | 3.46 | Third |
| Interaction | 3.76 | Second |
| 2χ | 14.87 | |
| Level of Significance | 0.011 | |
Peripheral Findings
Study of the status of research variables
About the status of each dimension of the research the opinions are reviews using the single-sample t-test and the findings are presented below. Given the response spectrum in the Likert questionnaire, which was 5, the criterion average is considered 3, the findings are presented in Table 8.
| Table 8 Summary of Single Sample T-Test Results | |||||
| Criterion | Avg | Value of t | Level of Significance | %95 confidence level | |
| Lower Bound | Upper Bound | ||||
| Customer Loyalty | 3.8218 | 14.085 | 0 | 0.7067 | 0.937 |
| Understanding Demands | 3.6322 | 11.677 | 0 | 0.5253 | 0.739 |
| Quality of Service | 3.6743 | 12.184 | 0 | 0.5651 | 0.7836 |
| Customer Orientation | 3.6695 | 10.638 | 0 | 0.5453 | 0.7938 |
| Flexibility | 3.7184 | 11.252 | 0 | 0.5924 | 0.8444 |
| Interaction | 3.7931 | 13.692 | 0 | 0.6788 | 0.9074 |
The findings show that t-test for all indices is significant because the t statistic for all indices is greater than 1.96 and the level of significance is less than 0.05. Therefore, the mean values for all indices are greater than 3(criterion mean), which indicates that, from sampled people’s point of view, investigated indices were in desirable condition.
The average of responders’ views in the customer loyalty dimension was 3.8218, which is larger than the midpoint of the Likert spectrum. A significance value of 0 is obtained which is smaller than the error level of 0.05, so the observed average is significant. The value of the t statistic is 14.85, which is larger than the critical value of 1.96. Both the upper and lower bounds of the confidence interval are somewhat greater than zero (positive) and the claims of the test is confirmed. Based on each of these statistical findings, with 95% confidence, it can be said that customer loyalty is important.
The average of responders’ views in the demand understanding dimension was 3.6322, which is larger than the midpoint of the Likert spectrum. A significance value of 0 is obtained which is smaller than the error level of 0.05, so the observed average is significant. The value of the t statistic is 11.677, which is larger than the critical value of 1.96. Both the upper and lower bounds of the confidence interval are somewhat greater than zero (positive) and the claims of the test is confirmed. Based on each of these statistical findings, with 95% confidence, it can be said that understanding demands is important.
The average of responders’ views in the quality of service dimension was 3.6743, which is larger than the midpoint of the Likert spectrum. A significance value of 0 is obtained which is smaller than the error level of 0.05, so the observed average is significant. The value of the t statistic is 12.184, which is larger than the critical value of 1.96. Both the upper and lower bounds of the confidence interval are somewhat greater than zero (positive) and the claims of the test is confirmed. Based on each of these statistical findings, with 95% confidence, it can be said that quality of service is important.
The average of responders’ views in the customer orientation dimension was 3.6695, which is larger than the midpoint of the Likert spectrum. A significance value of 0 is obtained which is smaller than the error level of 0.05, so the observed average is significant. The value of the t statistic is 10.638, which is larger than the critical value of 1.96. Both the upper and lower bounds of the confidence interval are somewhat greater than zero (positive) and the claims of the test is confirmed. Based on each of these statistical findings, with 95% confidence, it can be said that customer orientation is important.
The average of responders’ views in the flexibility dimension was 3.7184, which is larger than the midpoint of the Likert spectrum. A significance value of 0 is obtained which is smaller than the error level of 0.05, so the observed average is significant. The value of the t statistic is 11.252, which is larger than the critical value of 1.96. Both the upper and lower bounds of the confidence interval are somewhat greater than zero (positive) and the claims of the test is confirmed. Based on each of these statistical findings, with 95% confidence, it can be said that flexibility is important.
The average of responders’ views in the interaction dimension was 3.7931, which is larger than the midpoint of the Likert spectrum. A significance value of 0 is obtained which is smaller than the error level of 0.05, so the observed average is significant. The value of the t statistic is 13.692, which is larger than the critical value of 1.96. Both the upper and lower bounds of the confidence interval are somewhat greater than zero (positive) and the claims of the test is confirmed. Based on each of these statistical findings, with 95% confidence, it can be said that interaction is important.
Discussion
Customer loyalty has a meaningful relation with the success of new Internet services which use IoT. Today, along with the rapid growth of Internet services and technologies which upgrade every day, a customer is one of the key factors for companies to survive. Companies are looking for loyal customers so they can lead the company toward their goals. Loyalty is one of the most important factors in the repetition of purchases which leads to the success and profitability of the organization. Loyal customers have a positive attitude towards the company and are also less sensitive to the company’s prices. Therefore, creating mechanisms based on IoT for customer loyalty can be a way to make services as successful as possible.
Understand demands have a meaningful relation with the success of new Internet services which use IoT. Recognizing the needs of customers and employees as domestic customers is a very important way to provide better services and continuous communication. Efforts to address the needs of customers lead to loyalty, profitability, and consequently success of services. In this regard, the Internet has created many ways such as customer profile, online chats, etc. to identify customer needs and by using them CRM programs can be implemented.
Quality of service has a meaningful relation with the success of new internet services which use IoT. In a competitive environment of Internet businesses, providing quality services to customers results in competition advantage. The range of service quality in the Internet environment includes facilitating efficient and effective purchases, delivery of products and online support services. The quality of service provided through IoT and the virtual environment of the services, is a necessary strategy for the success of these services.
Customer orientation has a meaningful relation with the success of new internet services which use IoT. Clients are the agents of the continuity and survival of all businesses. Developing social networks and the wide variety of choices for customers make customer orientation one of the most important competitive advantages for corporations. So Services can increase their success rate with a customer-oriented approach.
Flexibility has a meaningful relation with the success of new Internet services which use IoT. Flexibility is a key to success in any business, and it means learning. The existence of a flexible view in organizations as well as helping customers to be flexible results in keeping up with changes, and given that in Internet business environment all technologies are changing rapidly, this improve the success of the services.
Interaction has a meaningful relation with the success of new Internet services which use IoT. Relations with customers (and staff as internal customers) are the core of human interactions that can make any business progress or fall. Create new ways to interact and create a pleasant experience for the client within the organization will increase the success of Internet services. The online environment leads to a better customer experience and improved business (Rajabion et al., 2019).
According to the results, using Friedman test, we examined the ranking of customer relationship management components, customer loyalty component has the highest rank among other components. Since customers today have unlimited access to information, creating loyal customer groups play a significant role in the success of Internet services.
Application of Research Results
The more digitalized the world is today, the more opportunities it has for businesses to improve their business (Zare et al., 2020). Based on the results of the first hypothesis test and the existence of a positive relation between customer loyalty and the success of Internet services it is suggested that new internet business owners develop their business strategies in such a way that by using IoT and online environment they create customer loyalty, including: creating a personalized profile for customers, considering customer as an ambassador, paying attention to all customers, creating a sense of being special in the customer. As well as based on the results of the second hypothesis test and the existence of a positive relation between understanding demands and the success of Internet services, it is suggested that business owners and employees, as consulters, create sense of proximity for the customers and by designing forms and entertaining games elicit customers’ needs. Also based on the results of the third hypothesis test and the existence of a positive relation between the quality of service and the success of Internet services it is suggested that business owners always pay attention to the fact that customer's satisfaction is achieved when the received service meets his expectations, for example, designing a process that the customer be noticed at the time of decision, order, payment, order receipt, and his comments and reactions always be recorded.
Based on the results of the fourth hypothesis test and the existence of a positive relationship between the customer orientation and the success of Internet services it is suggested that business owners should be able to lead their customer to his target in the shortest possible time and deliver the best user experience when using your products or services, like bringing special offers to the customer, implementing a system that allows the customer to design his order’s package with his personal taste. And based on the results of the fifth hypothesis test and the existence of a positive relation between the flexibility and success of Internet services it is suggested that business owners, due to the rapid changes in the products and services of organizations, invest in research and development to keep pace with market changes, they can also add individuals with good background in entrepreneurship to the organization so, with a creative vision, plan the customer's reaction to changes and his flexibility and add related services to the organization. And finally based on the results of the sixth hypothesis test and the existence of a positive relation between the interactivity and the success of the Internet services it is proposed that business owners adopt methods that encourage all customers to share their opinions with the company, because the result of continuous interaction with the customer can create a pleasant experience for him and therefore results in company's profit. In this regard, for example, one can design entertaining games and organizing online tournaments, as well as creating different groups and the possibility of joining the group for the customer, customer's tastes and opinions are achievable and customer satisfaction will be achieved through these interactions.
Because this research was conducted in Iran, it may not be generalizable to other countries; also the time period used in this research is considered as a limitation.
As a suggestion for future work, this research can be done in other businesses and the results can be compared.
References
- Agnihotri, R., Dingus, R., Hu, M. Y., & Krush, M. T. (2016). Social media: Influencing customer satisfaction in B2B sales. Industrial Marketing Management, 53, 172-180.
- Agnihotri, R., Trainor, K. J., Itani, O. S., & Rodriguez, M. (2017). Examining the role of sales based CRM technology and social media use on post-sale service behaviors in India. Journal of Business Research, 81, 144-154.
- Ashton, K. (2009). That ‘internet of thing’s thing. RFiD Journal, 22(7), 97-114.
- Belias, D., Velissariou, E., Kyriakou, D., Vasiliadis, L., Mantas, C., Sdrolias, L., Aspridis, G., & Kakkos, N. (2018). The importance of CRM and social media in the Greek wine tourism industry. In: Katsoni, V., & Velander, K. (eds) Innovative approaches to tourism and leisure. Springer.
- Esmaeil, S. (2016). A survey on Reliability in Grid compating system. Proceedings of 1th international conference on computer Engineering And IT.
- Fang, J., George, B., Shao, Y., & Wen, C. (2016). Affective and cognitive factors influencing repeat buying in e commerce. Electronic Commerce Research and Applications, 19, 44-55.
- Gao, Q., & Feng, C. (2016). Branding with social media: User gratifications, usage patterns, and brand message content strategies. Computers in Human Behavior, 63,868-890.
- Hollensen, S. (2015). Marketing management: A relationship approach. Pearson Education.
- Katsoni, V., & Velander, K. (2017). Innovative approaches to tourism and leisure. Springer.
- Ketkar, S., & Sett, P. K. (2010). Environmental dynamism, human resource flexibility, and firm performance: analysis of a multi-level causal model. The International Journal of Human Resource Management, 21(8), 1173-1206.
- Law, A. K. Y., & Hui, Y. V. (2014). Modeling repurchase frequency and customer satisfaction for fast food outlets. International Journal of Quality & Reliability Management, 21(5), 545-63.
- Rajabion, L., Mokhtari, A. S., Khordehbinan, M. W., Zare, M., & Hassani, A. (2019). The role of knowledge sharing in supply chain success. Journal of Engineering, Design and Technology, 17(6), 1222-1249.
- Sen, S., & Lerman , D. (2007). Why are you telling me this ? An examination in to nemgagtive consumer reviieus on the web. Journal of Interactive Marketing, 21(4), 76-94.
- Shen, J., Li, B., & Xie, Z. (2017). Interaction between crumb rubber modifier (CRM) and asphalt binder in dry process. Construction and Building Materials 149, 202-206.
- Wenge, R., Zhang, X., Dave, C., Chao, L., & Hao, S. (2014). Smart city architecture: A technology guide for implementation and design challenges. China Communications, 11(3), 56-69.
- Yerpude, S., & Singhal, T. K. (2018a). Internet of things based customer relationship management–a research perspective. International Journal of Engineering Technology, 7(2.7), 444-450.
- Yerpude, S., Singhal, T. K., & Rathod, H. (2018b), Achieving service process excellence with connected customer: A winning approach. International Journal of Information Systems and Supply Chain Management (IJISSCM), 12(1), 66-80.
- Zare, M., Shakeri, H., & Mahmoudi, R. (2020). Ecommerce: An efficient digital marketing data mining framework to predict customer performance. Journal of the International Academy for Case Studies, 26(5), 1-8.
- Zhang, M. J. (2005). Information systems, strategic flexibility and firm performance: An empirical investigation. Journal of Engineering and Technology Management, 22(3), 163-184.