Research Article: 2020 Vol: 24 Issue: 1
Investors Herding Behavior And Pandemic-Risk Related In The Gcc Stock Markets
Marwan Mohamed ABDELDAYEM, Cairo University
Saeed Hameed AL DULAIMI, Applied Science University
Abstract
The decline in global markets and oil prices on the rear of coronavirus (COVID 19) spread caused a decrease in the indices of all Gulf Cooperation Council (GCC) securities exchanges. Therefore, the question that arises is the extent, if any, to which the pandemic-risk related has influenced the investors herding behavior in the GCC stock markets, but given the inherent difficulty of measuring investors herding behavior, it is clearly going to be difficult to obtain conclusive answers to this question. The study was undertaken in two stages, first, it was felt necessary to obtain a broad overview of the effect of the pandemic related to the risk of COVID-19 on investors' herding in the GCC. This was achieved by analyzing secondary data (i.e. daily historic prices of five GCC country market indices). In analyzing the secondary data, the study follows Christie and Huang (1995) and employs the cross-sectional standard deviation (CSSD) of returns to detect investors' herding behavior. Second, in an attempt to obtain a more precise understanding of the impact of pandemic related risk, a questionnaire survey was distributed and collected from 318 investors from the GCC stock markets. A confirmatory factor analysis (CFA) was also used as the primary analysis between the two variables: i.e. expectations of pandemic risk and herding behavior. The findings reveal that expectations of pandemic risk have a significant positive impact on the herding behavior in the GCC stock markets during the coronavirus crisis in the first quarter of 2020. Finally, the results of this study are robust to a range of model specifications.
Keywords
COVID-19, GCC Stock Markets, Investor Herding, Pandemic-Risk Related Cross- Sectional Standard Deviation (CSSD), Confirmatory Factor Analysis (CFA).
JEL Classifications
G11; G15; G18; I18
Introduction
Herding impact is obvious when individuals do what others are doing as opposed to utilizing their data or settling on autonomous choices. Herding has a long history in principle and gathering mind science. It is particularly appropriate in the region of reserve, where it has been discussed equivalent to the total unreasonableness of money related experts, including protections trade bubbles (Banerjee, 1992). In different territories of dynamic, for example, governmental issues, science, and mainstream society, crowd conduct is in some cases alluded to as 'data falls' (Bikhchandi et al., 1992). Herding behavior can be expanded by different variables, for example, dread (for example Economou et al., 2018), vulnerability (for example Lin, 2018), or a mutual character of leaders (for example Berger et al., 2018).
The coronavirus emergency has uncovered buyer conduct at its generally extraordinary, as lack fears have brought about individuals storing tissue and food. Nevertheless, among speculators, we see the inverse to accumulating. There has been far-reaching dumping of risked resources and a trip to quality in resources like gold and government securities, trailed by times of sharp market rises. In any case, the COVID 19 impact is comparative. Pictures of uncovered store racks feed more frenzy purchasing among customers, while steep decreases in advertising lists and the apparition of circuit breakers being activated – which happened a few times in March 2020–sparkle further selling.
The purpose of this study is to examine the causal association between expectations of pandemic risk and herding behavior in the GCC stock markets. The main question of this research effort is: “would we be able to assume that speculator conduct is correspondingly unreasonable?” In this study, we consider:
1. Whether financial specialists in the GCC are carrying on normally in light of a phenomenal occasion;
2. What we would be able to make of the inconsistent market bobs over the main quarter of 2020;
3. Also, why speculators ought to stand up to their predispositions take a functioning, diagnostic approach, and consider if opposing the compulsion to pull back from the market could be advantageous.
The rest of this paper is organized as follows: Literature review is presented in section (2). Section (3) introduces the methodology. Discussion and results of statistical analysis are explained in section (4), while conclusions are in section (5).
Theoretical Framework & Literature Review
While the coronavirus pandemic is unsettling, we have survived some wild occasions in the course of recent decades, including multiple sickness flare-ups (SARS in 2002-2003, avian influenza in 2006, Swine influenza in 2009, Ebola in 2014, Zika in 2016, among a few others) such as: the Black Monday financial exchange crash in 1987; the blasting of the tech-stock air pocket in 2000; September 11, 2001 fear monger assaults; the 2008-2009 worldwide financial crisis and Great Recession; the 2016 Brexit vote; and the U.S. – China exchange war. Every one of these occasions activated extreme market stuns that went on for a considerable length of time or years. However, during this time from 1980 to 2019, the S&P 500 record has posted a normal yearly return of 11.8%. The worldwide markets likewise showed their flexibility during that time, with the MSCI World list posting an 8% normal yearly return and the MSCI Emerging Markets list posting a 10.7% normal yearly return (Abdeldayem & Aldulaimi, 2020).
History has demonstrated the benefit of staying contributed during earlier scenes of market unrest. The COVID-19 pandemic presents an incredibly troublesome transient emergency, however almost all drawn out speculators will have a venture skyline past this pandemic. Concentrating on that skyline, will assist financial specialists with utilizing risk models better; and will eventually assist them with performing better as well. Markets in chaos are the place long haul financial specialists bring in their cash. Contributing counter consistently, when numerous others without long haul liquidity are selling, is a reasonable preferred position for long haul financial specialists. Financial specialists that play out the best over the drawn-out will have faced determined and intentional challenges and set cash to work during emergencies like this one. During circumstances such as the present, a drawn-out speculator will comprehend that the world has moved outside of likelihood and that human conduct will influence both the reaction to the pandemic and the risk and return that monetary markets produce. Long haul speculators perceive that this emergency presents an administration chance to add to results that would satisfy their associations' motivations.
In addition, Abdeldayem et al. (2020) argue that during the COVID 19 pandemic time, volatility has dialed down to some degree in the course of the most recent seven day stretch of March 2020 (see figure 1). This could be because of market weakness or ebbing vulnerability as the new reality becomes standardized and most pessimistic scenario situations are evaluated in. As indicated by specialists who are following how responsive market risk is to reports of new coronavirus cases, the flexibility of instability will in general die down in light of infection news or on the other hand, maybe, the mix of the expanded gravity of the infection and the "no restrictions" responsibility of specialists to relieving the monetary impact is having a nonpartisan mental effect.

Figure 1 Volatility has Subsided in March 2020
Source: Bloomberg, as at March 2020.
Another explanation behind the sharp beginning swings could be the significant increment in alternatives being used before the COVID 19 pandemic (see figure 2). In February 2020, speculators utilized more alternatives either to support their portfolios or addition convexity.

Figure 2 The Volume of Options in use Soars
Source: CBOE, as in March 2020.
For the most part, financial specialists bought out-of-the cash alternatives to support against surprising business sector moves (this is the point at which the hidden resource's cost is underneath the strike cost). In any case, as the market fell strongly huge numbers of these alternatives became at-the-cash (ATM) choices – as such, the ones with the most noteworthy gamma (which means the cost of the choice is the most receptive to changes in the cost of the hidden resource). Regardless of whether speculators decided to clutch ATM choices or expected to get them to consider the risk of their portfolios, the cost of alternatives comparative with their strike cost demonstrated that financial specialist interest for ATM choices was higher than expected – something that brought about a supercharged market. The higher the volume of choices extraordinary, the higher the measure of delta supporting required by the choice vender. At the end of the day, whatever heading the market takes on some random day, its developments are probably going to be raised by the delta supporting of alternatives dealers. This elevated transient energy is to some extent liable for the size of the day-by-day swings we have seen. In the result of steep market falls, the cost of choices, like any protection after an occasion, has expanded pointedly, which should quiet their enhancing impact going ahead (see Abdeldayem & Sadeek (2018); Abdeldayem & El-Sherbiney (2018), and Shaker & Abdeldayem (2018)).
To start with, the exploration that inspects the impacts of pandemic emergencies on monetary resource valuations has been an early stage (Baker et al., 2020). Two prominent special cases are (I) Donadelli et al. (2017), who study if the financial specialist state of mind, driven by news on internationally risky maladies (for example SARS, Influenza A (H1N1), Polio and Ebola) is evaluated in 2 pharmaceutical stocks in the US and (ii) Ichev and Marinc (2018), who report that the Ebola episode occasions were trailed by raised apparent risk in the US monetary markets. According to the COVID-19, just barely as of late, Onali (2020) looks at the COVID-19 cases and passing on the US securities exchange and finds that there is no effect on the US financial exchange returns. Baker et al. (2020) and that the instability connection between the Chinese securities exchanges and cryptographic forms of money advanced essentially during the pandemic. In a comparable Salisu, Akanni & Raheem (2020) recommend that COVID-19 does not enhance crowding in digital currency markets. Uddin et al. (2020) inspect the associated elements of Asian monetary markets and find solid, positive reliance among the explored showcases because of the flare-up of COVID-19. Such uncommon occasions give an unedited chance to find out about speculator conduct (Wagner, 2020). Along these lines, our exploration intends to this void by considering 5 Gulf financial exchanges during the COVID-19 pandemic. In particular, we ask whether the ongoing far-reaching securities exchange breakdown is related to the nearness of grouping conduct in Gulf financial exchanges.
Second, in contrast to past examinations on grouping conduct in universal financial exchanges (Chiang & Zheng, 2010; Gebka & Wohar, 2013; Lin, 2018; Chen et al., 2019; Yarovaya et al., 2020), this investigation gauges the conceivable effect of pandemic-related risk (COVID-19 pandemic) on herding behavior in the GCC securities exchanges
Methodology
The goal of this study is to explore the impact of the pandemic related danger of COVID- 19 on financial specialists' grouping in the Gulf Cooperation Council (GCC) securities exchanges. To this end, we center around five financial exchange files from the GCC (see Table 1 below). Day by day memorable costs on five GCC nation advertise records were made accessible by Reuters Middle East, Shuaa Capital in UAE, and from some online sauces, for example, Bayan speculation organization: http://www.bayaninvest.com and MENAFN.COM: http://www. MENAFN.com. The information extend is from 1 January 2020, when the COVID- 19 pandemic began spreading far and wide, to 31 March 2020 for the securities exchanges of Bahrain (BAX), Kuwait (KWSE), Oman (MSM30), Saudi Arabia (TASI), and the United Arab Emirates (ADX and DFMG).
| Table 1 GCC Stock Market Indices | ||
| Gulf Country | Index | Description |
| Bahrain | BAX | It includes 39 listed stocks |
| Saudi Arabia | TASI | It includes 168 listed stocks |
| UAE | DFMGI ADX |
It includes 33 listed stocks It includes 41 listed stocks |
| Kuwait | KWSE | It includes 187 listed stocks |
| Oman | MSM30 | It has the most liquid 30 stocks in the market |
Measuring Herding Behavior
To measure investor herding, we follow Christie and Huang (1995), who recommend the utilization of cross-sectional standard deviation (CSSD) of profits to distinguish speculator group conduct in a global market setting. In particular, CSSDi;t for the nation I on day t is characterized as:
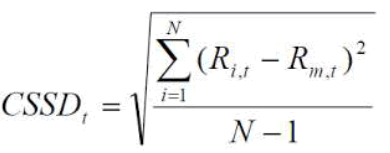
Where Ri,t is the arrival in the nation I on day t and Rm,t is the GCC advertise return, which is determined as the cross-sectional worth weighted normal come back from the 5 Gulf nations. CSSDi,t is a unique proportion of grouping conduct in the nation I, which is determined as a 20-day (N= 20) moving window standard deviation of nation's I come back from the Gulf showcase return m on day t. Within the sight of grouping conduct, during huge swings in stock costs and returns, the nation's I return should go astray 'less' from the worldwide market return than during less unstable periods. As such, 'little' CSSDi;t values signal more grounded proof of crowding conduct, though 'enormous' values signal more fragile proof.
In addition, the instrument used to collect the primary data is an online questionnaire survey. The questionnaire is consisting of 14 items to assess the two subscales (6 items to measure expectations of pandemic risk and 8 items to measure herding behavior). Further, there are 5 items to measure the demographic variables of the participants. The participants received an electronic version of the questionnaire using the google doc. online format. Several emails were sent to participants including the invitation to participate along with a link of the web page to guide them to the questionnaire survey. 318 questionnaires were usable out of the 406 received due to some incomplete responses.
Analysis and Empirical Findings
Table 2 reports elucidating insights into the factors utilized. CSSD shows that an arrival on the financial exchange record of the nation I go astray on normal from the GCC showcase return by 0.6232%. The standard deviation of CSSD is 0.2077%. The GCC Index takes on values from 0 to 100. It midpoints 11.6921index focuses and goes amiss from the mean on normal by 14.6152 file focuses. We additionally note that both Ri and Rm highlight negative normal qualities, - 0.2926% and - 0.2956%, individually, which delineates the emergency of value estimation of organizations over the globe. Estimations of Ri and Rm veer off from the GCC advertise return on normal by 1.6204% and 0.9398%, separately. Thinking about individual Gulf nations. Since, 'little' CSSDi;t values signal more grounded proof of grouping conduct, and 'huge' values signal more vulnerable proof, these outcomes demonstrate that there is a proof of financial specialist herding behavior in the GCC securities exchanges during the coronavirus emergency in the primary quarter of 2020. This finding concurs with past research, for example, Miller (1977); Avery & Zemsky (1998); Gill et al. (2018) and Kizys et al. (2020).
| Table 2 Descriptive Statistics | |||||
| Variable | Observation | Mean | Std. Dev. | Minimum | Maximum |
| CSSD | 2,493 | 0.6232 | 0.2077 | 0.1038 | 4.1557 |
| GCC index | 1,670 | 11.6921 | 14.6152 | 0 | 100 |
| Ri | 2,368 | -0.2926 | 1.6204 | -10.6561 | 8.2885 |
| Rm | 2,420 | -0.2956 | 0.9398 | -4.2352 | 1.8150 |
As far as the primary data is concerned, a questionnaire survey was distributed and collected from 318 investors from the GCC stock markets (Bahrain, Kuwait, Saudi Arabia, UAE, and Oman). The demographics of the 318 investors who participated in this research effort are shown in figure (3) below. Figure (3) shows that 68% of participants are females (216) and 32% males (102)). 67% of the respondents (213) are highly qualified (having a Master or PhD). 26.4% (84) have attended the stock markets for 10 years or more and 41.5% (132) are with an average age of 45 ± 5.

Figure 3 Demographics Including Age, Gender, Marital Status, Education Level, and the Experience of Dealing with the Stock Market
In addition, a confirmatory factor analysis (CFA) has been considered as a proper method for estimating to assessing the two variables: i.e. expectations of pandemic risk and herding behavior utilizing AMOS 25 software. "The going with six fundamental measures were used to assess the model's general respectability of fit: Chi-Square/Degree of Freedom extent, Normed Fit Index (NFI), Non-Normed Fit Index (NNFI), Comparative Fit Index (CFI), and Root Mean Square Error of Approximation (RMSEA) and Standardized Root Mean Square Residual (SRMSR)" (Kline, 2010; Hair et al, 2010 P.19). Moreover, the study utilized structural equation modeling (SEM) for the factual examination of information gathered to look at collaborations between the two subscales: SEM result presents the way examination of the guessed model of desires for pandemic risk and herding behavior.
The first step of analysis is the reliability test of items which was conducted using Cronbach’s alpha Coefficient for every construct and it should be equal to or higher than 0.6 (Nunally and Bernstein, 1994). Table (3) shows the value of Cronbach’s alpha of every construct. It can be seen from this table that all values of Cronbach’s alpha are acceptable indicating a high-reliability level to all constructs (α > 0. 80).
| Table 3 Model Fitting Analysis for Primary and Modified Measurement Models of Herding Behavior and Expectations of Pandemic Risk | |||
| Fit Index | Primary Model | Critical (Acceptable) Value | Modified Model |
| “Normed fit index” (NFI) | 0.935 | >/=0.9 | 0.987 |
| “Comparative fit index” (CFI) | 0.926 | >/=0.9 | 0.989 |
| “Tucker Lewis index” (TLI) | 0.915 | >/=0.9 | 0.978 |
| “Incremental fit index” (IFI) | 0.906 | >/=0.9 | 0.965 |
| “Goodness of fit index” (GFI) | 0.889 | >/=0.9 | 0.954 |
| “Root means square error of approximation” (RMSEA) | 0.085 | <0.08 | 0.065 |
Employing the SEM Model
Structural Equation Modeling (SEM) is composed of the measurement model and the structural model.
Measurement Model
The objective of the measurement model is to describe how the indicators have seen work as a tool for measuring underlying variables, and the emphasis analysis is used to estimate the adequacy of the measurement model for each structure, and the efficiency and indicator (square- Chi) is determined to align the model from the defect of several indicators for good conformity. A confirmatory factor analysis was conducted using AMOS 25 software to validate the instruments.
In terms of the validity test, this study uses the factor loading and it must be equal to or higher than 0.5 (Argyris & Schön 1997). The evidence of confirmative factor analysis CFA contains two types: convergence and covariance. The results of the measurement model are shown in figure (4) below. We simply notice the ideal factor loading of the items. Referring to figure (5) design (a) represents the measurement model of expectations of pandemic risk, while the design (b) represents the herding behavior. All items are valid as the results of the factor loading is equal to/ or higher than 0.5.

Figure 4 Primary and Modified Measurement Model of the two main Variables

Figure 5 A Primary Structural Model
Structural Model
Structural modeling is applied next to identify the hypothesized connection among research constructs (exogenous or endogenous), which is linked to the assumed model’s concept. The main hypothesis is tested to examine whether the expectations of pandemic risk is affecting herding behavior. This relation of exhibits perfect model fit to the given data ([NFI] = 0.935, [CFI] = 0.926, [TLI] = 0.915, [IFI] = 0.906, [GFI] = 0.889, and [RMSEA] = 0.085). As presented in Figure (5), expectations of pandemic risk have a significant positive impact on herding behavior (β = 0.95; p-value < 0.001). Several modifications have been suggested by the AMOS software to improve the model fit. Thus, the model improved after removing two items as shown below in Table 3 and illustrated in Figure 6.

Figure 6 Modified Structural Model
Concluding Comments
The purpose of this study is to examine the causal association between expectations of pandemic risk and herding behavior. This study, therefore, seeks to add to our knowledge of the herding phenomenon in developing countries in general, and the GCC in particular. The study was undertaken in two stages. First, it was felt necessary to obtain a broad overview of the effect of the pandemic related risk of COVID-19 on investors' herding in the GCC. This was achieved by analyzing secondary data (i.e. daily historic prices on five GCC country market indices). In analyzing the secondary data, the study follows Christie and Huang (1995) and employs the cross-sectional standard deviation (CSSD) of returns to detect investors' herding behavior. Second, in an attempt to obtain a more precise understanding of the impact of pandemic related risk, a questionnaire survey was distributed and collected from 318 investors from the GCC stock markets.
The secondary data provided in this study, which relied on daily historic prices on five GCC country market indices i.e. Bahrain (BAX), Kuwait (KWSE), Oman (MSM30), Saudi Arabia (TASI), and the United Arab Emirates (ADX & DFMG), proved very helpful and informative. CSSD shows that an arrival on the financial exchange record of nation I goes astray on normal from the GCC showcase return by 0.6232%. The standard deviation of CSSD is 0.2077%. The GCC Index takes on values from 0 to 100. It midpoints 11.6921index focuses, and goes amiss from the mean on normal by 14.6152 file focuses. We additionally note that both Ri and Rm highlight negative normal qualities, - 0.2926% and - 0.2956%, individually, which delineates the emergency of value estimation of organizations over the globe. Estimations of Ri and Rm veer off from the GCC advertise return on normal by 1.6204% and 0.9398%, separately. Thinking about individual Gulf nations. Since, 'little' CSSDi;t values signal more grounded proof of grouping conduct, and 'huge' values signal more vulnerable proof, these outcomes demonstrate that there is a proof of financial specialist herding behavior in the GCC securities exchanges during the coronavirus emergency in the primary quarter of 2020. This finding concurs with past research, for example, Miller (1977); Avery & Zemsky (1998); Gill et al. (2018) and Kizys et al. (2020).
In addition, the views of 318 investors from the GCC offer a useful starting point for an assessment of the impact of the pandemic related risk of COVID-19 on investors' herding in the GCC stock markets. A confirmatory factor analysis (CFA) was used as the primary analysis between the two variables: i.e. expectations of pandemic risk and herding behavior. Further, structural modeling is applied next to identify the hypothesized connection among research constructs (exogenous or endogenous), which is linked to the assumed model’s concept. The main hypothesis is tested to examine whether the expectations of pandemic risk is affecting herding behavior. This relation of exhibits perfect model fit to the given data ([NFI] = 0.935, [CFI] = 0.926, [TLI] = 0.915, [IFI] = 0.906, [GFI] = 0.889, and [RMSEA] = 0.085). The findings reveal that expectations of pandemic risk have a significant positive impact on herding behavior (β = 0.95; p-value < 0.001). Several modifications have been suggested by the AMOS software to improve the model fit. Thus, the model improved after removing two items.
To conclude, contributing is not generally agreeable. In any case, it is critical to recollect that, without risk, there are no profits. In this condition, on the off chance that we move our cash into money, we are probably going to pass up the best gains in the market, making it considerably harder to recuperate our misfortunes. Presently like never before, it is fundamental for all investors to follow the essential precepts of contributing: i.e. to remain diversified, remain focused, and remain calm especially in the time of crisis.
Finally, our study has significant commonsense ramifications for speculators, strategy producers, budgetary controllers, just as organizations. It ought to be noticed that, during the financial crisis, objective valuation happens to principal significance for organizations, which try to source value capital. Our investigation additionally adds to the continuous open discussion, which spins around the compromise between general wellbeing also, the economy. Our outcomes show that the legislature and administrative restrictions forced to control the transmission of COVID-19 inside and across nations can lighten the nearness of financial specialist herding behavior in the GCC stock markets.
References
- Abdeldayem, M.M., & Sedeek, D.S. (2018). Managerial behavior and capital structure decisions: Do overconfidence, optimism and risk aversion matter? Asian Economic and Financial Review,8 (8), 1115-1136.
- Abdeldayem, M.M., & El-Sherbiney, R.A. (2018). A comparative study of the financial performance of the three banking modes in Egypt: Islamic, conventional and mixed banks. Archives of Business Research, 6(5), 286-308.
- Abdeldayem, M.M., Aldulaimi, S.H., & Nekhili, R. (2020). Cryptocurrency as a Fin Tech instrument and islamic finance: The GCC perspective. Journal of Xi'an University of Architecture & Technology, 12 (2), 2736-2747.
- Abdeldayem, M.M., & Aldulaimi S.H. (2020). Cryptocurrency in the GCC Economy. International Journal of Scientific and Technology Research, 9(2), 1739-1755.
- Abdeldayem, M.M., & Aldulaimi S.H. (2020). Trends of global fintech education practices and the GCC perspective. International Journal of Advanced Science and Technology, 29 (3), 7150 – 7163
- Abdeldayem, M.M.,& Aldulaimi, S.H. (2020). Cryptocurrency in the time of coronavirus. Strad Research, 7(8), 729-744.
- Aldulaimi, S.H., & Sailan, M.S. (2012). The national values impact on organizational change in public organizations in GCC. International Journal of Business and Management, 7(1), 182.
- Argyris, C., & Schön, D. (1997). Organizational learning: A theory of action perspective. Reis 77 (78), 345–348.
- Avery, C., & Zemsky, P. (1998). Multidimensional uncertainty and herd behavior in financial markets. The American Economic Review, 88(4), 724-748.
- Babilis, S., & Fitzgerald, V. (2005) Risk appetite, home bias and the unstable demand for emerging market assets. International Review of Applied Economics, 19 (4), 459-476.
- Bailey, W., Kumar, A., & Ng, D. (2008). Foreign investments of us individual investors: Causes and consequences. Management Science, 54(3), 443-459.
- Baker, S.R., Bloom, N., Davis, S.J., Kost, K.J., Sammon, M.C., & Viratyosin,T. (2020). The unprecedented stock market impact of covid-19. Working Paper 26945, National Bureau of Economic Research.
- Banerjee, A. (1992). A simple model of herd behavior. Quarterly Journal of Economics, 107, 797-817.
- Berger, S., Feldhaus, C., & Ockenfels, A. (2018). A shared identity promotes herding in an information cascade game. Journal of the Economic Science Association, 4(1), 63-72.
- Bikhchandi, S., Hirschleifer, D., & Welch, I. (1992). A theory of fads, fashion, custom and cultural change as informational cascades. Journal of Political Economy, 100, 992-1026.
- Blasco, N., Corredor, P., & Ferreruela, S. (2012). Market sentiment: A key factor of investors’ imitative behaviour. Accounting & Finance, 52(3), 663-689.
- Bloomberg (2020). Bloomberg Markets: The close. Full show (3/31/2020).
- Bloomberg (2020). Crypto Freeze Continued Last Year as Deals Plunged. PwC Says by Eric Lam (4/6/2020).
- Brahmana, R., Hooy, C.W., & Ahmad, Z. (2012). The role of herd behaviour in determining the investor’s Monday irrationality. Asian Academy of Management Journal of Accounting & Finance, 28 (8), 236-257.
- Chang, C. (2012). Order imbalance and daily momentum investing: Evidence from Taiwan. Financial Review, 47(4), pp. 697-718.
- Chen, Z., Matousek, R., Stewart, C., & Webb, R. (2019). Do rating agencies exhibit herding behaviour? Evidence from sovereign ratings. International Review of Financial Analysis, 64, 57-70.
- Chiang, T.C., & Zheng, D. (2010). An empirical analysis of herd behavior in global stock markets. Journal of Banking & Finance, 34(8),1911-1921.
- Choe, H., & Eom, Y. (2009. The disposition effect and investment performance in the futures market. Journal of Futures Markets, 29(6), 496-522.
- Christie, W.G., & Huang, R.D. (1995). Following the pied piper: Do individual returns herd around the market? Financial Analysts Journal, 51(4), 31-37.
- Conrad, J., Cornell, B., Landsman, W.R., & Rountree, B.R. (2006). How do analyst recommendations respond to major news?. Journal of Financial and Quantitative Analysis, 41(1), 25-49.
- Das, A. (2012). Estimating the loss from the disposition effect: A simulation study. Journal of Behavioral Finance, 13(1), 1-10.
- Deshpande, S., & Svetina, M. (2011). Does local news matter to investors? Managerial Finance, 37(12), 1190-1212.
- Donadelli, M., Kizys, R., & Riedel, M. (2017). Dangerous infectious diseases: Bad news for main street, good news for Wall Street? Journal of Financial Markets, 35, 84-103.
- Durand, R., Newby, R., Tant, K., & Trepongkaruna, S. (2013). Overconfidence, overreaction and personality. Review of Behavioral Finance, 5(2), 104-133.
- Economou, F., Hassapis, C., & Philippas, N. (2018). Investors’ fear and herding in the stock market. Applied Economics, 50(34-35), 3654-3663.
- Ekholm, A. (2006). How do different types of investors react to new earnings information? Journal of Business Finance & Accounting, 33(1/2), 127-144.
- Gebka, B., & Wohar, M.E. (2013). International herding: Does it differ across sectors? Journal of International Financial Markets, Institutions and Money, 23, 55-84.
- Ghalandari, K., & Ghahremanpour, J. (2013). The effect of market variables and herding effect on investment decision as factor influencing investment performance in Iran. Journal of Basic and Applied Scientific Research, 3 (3), 313-318.
- Giannetti, M., & Koskinen, Y. (2010). Investor protection, equity returns, and financial globalization. Journal of Financial and Quantitative Analysis, 45(1), 135-168.
- Gill, S., Khurshid, M.K., Mahmood, S., & Ali, A. (2018). Factors effecting investment decision making behavior: The Mediating role of information searches. European Online Journal of Natural and Social Sciences, 7(4), pp-758.
- Goo, Y.J., Chen, D.H., Chang, S.H.S., & Yeh, C.F. (2010). A study of the disposition effect for individual investors in the Taiwan stock market. Emerging Markets Finance and Trade, 46(1), 108-119.
- Hair, J.F.B., Babin, W.C., & Anderson, R.E. (2010). Multivariate data analysis (7th Edition.). Pearson Prentice Hall.
- Hassan, T., Mohamad, S., Ariff, M., & Nassir, A. (2007). Stock index futures prices and the Asian financial crisis. International Review of Finance, 7 (3/4), 119-141.
- Hoitash, R., & Krishnan, M.M. (2008). Herding, momentum and investor over-reaction. Review of Quantitative Finance and Accounting, 30(1), 25-47.
- Hur, J., Pritamani, M., & Sharma, V. (2010). Momentum and the disposition effect: The role of individual investors. Financial Management, 39(3), 1155-1176.
- Ichev, R., & Marinc, M. (2018). Stock prices and geographic proximity of information: Evidence from the ebola outbreak. International Review of Financial Analysis, 56,153-166.
- Kaustia, M. (2010). Prospect theory and the disposition effect. Journal of Financial and Quantitative Analysis, 45(3), 791-812.
- Kim, K.A., & Nofsinger, J.R. (2007). The behavior of Japanese individual investors during bull and bear markets. The Journal of Behavioral Finance, 8(3), 138-153.
- Kirchler, E., Maciejovsky, B., & Weber, M. (2005). Framing effects, selective information, and market behavior: an experimental analysis. The Journal of Behavioral Finance, 6(2), 90-100.
- Kizys, R., Tzouvanas, P., & Donadelli, M. (2020). From COVID-19 herd immunity to investor herding in international stock markets: The role of government and regulatory restrictions. Available at SSRN 3597354.
- Kline, R. (2010). Principles and practice of structural equation modeling. The Guilford Press
- Kufepaksi, M. (2010). The effect of feedback on overconfident investors, experimental evidences of self deception in Indonesian capital market. International Journal of Management & Innovation, 2(2), 24-44.
- Kumar, A., & Lim, S.S. (2008). How do decision frames influence the stock investment choices of individual investors?. Management Science, 54(6),1052-1064.
- Kumar, S., & Goyal, N. (2015). Behavioural biases in investment decision making: A systematic literature review. Qualitative Research in Financial Markets, 7(1), 88-108.
- Kuo, M.H., & Chen, S.K. (2012). Prospect theory and disposition patterns: Evidence from Taiwan investors. Studies in Economics and Finance, 29(1), 43-51.
- Lai, S., & Teo, M. (2008). Home-biased analysts in emerging markets. Journal of Financial and Quantitative Analysis, 43(3), 685-716.
- Lehenkari, M., & Pertunnen, J. (2004). Holding on to the losers: Finnish evidence. Journal of Behavioural Finance, 5(2), 116-126.
- Li, K. (2004). Confidence in the familiar: an international perspective. Journal of Financial and Quantitative Analysis, 39(1), 47-68.
- Lin, C.Y., Rahman, H., & Yung, K. (2010). Investor overconfidence in REIT stock trading. Journal of Real Estate Portfolio Management, 16(1), 39-57.
- Lin, H.W. (2012). How herding bias could be derived from individual investor types and risk tolerance?. Proceedings of World Academy of Science, Engineering and Technology (No. 66), World Academy of Science, Engineering and Technology, 32, 831-836.
- Lin, M. C. (2018). The impact of aggregate uncertainty on herding in analysts’ stock recommendations. International Review of Financial Analysis, 57, 90-105.
- Lin, M.C. (2005). Returns and investor behavior in Taiwan: does overconfidence explain this relationship? Review of Pacific Basin Financial Markets and Policies, 8 (3), 405-446.
- Lu, Y.C., Fang, H., & Nieh, C.C. (2012). The price impact of foreign institutional herding on large-size stocks in the Taiwan stock market. Review of Quantitative Finance and Accounting, 39(2), 189-208.
- Miller, E.M. (1977). Risk, uncertainty, and divergence of opinion. The Journal of Finance, 32(4), 1151-1168.
- Mishra, A.V. (2008). Australia’s equity home bias. Australian Economic Papers, 47 (1), 53-73.
- Mishra, A.V. (2011). Australia’s equity home bias and real exchange rate volatility. Review of Quantitative Finance and Accounting, 37 (2), 223-244.
- Nikiforow, M. (2010). Does training on behavioural finance influence fund managers’ perception and behaviour?. Applied Financial Economics, 20(7), 515-528.
- Nunally, J.C., & Bernstein, I.H. (1994). Psychometric Theory. McGraw-Hill: New York, NY, USA
- Oehler, A., Rummer, M., & Wendt, S. (2008). Portfolio selection of German investors: on the causes of home-biased investment decisions. The Journal of Behavioral Finance, 9(3), 149-162.
- Onali, E. (2020). Covid-19 and stock market volatility. Available at SSRN 3571453.
- Ottaviani, M., & Srensen, P. (2000). Herd behavior and investment: comment. American Economic Review, 90(3), 695-704.
- Pang, K. (2011). Equity home bias, incomplete financial markets, and nominal rigidities. Canadian Journal of Economics/Revue Canadienne d’Economique, 44(1), 340-363.
- Parwada, J.T. (2008). The genesis of home bias? The location and portfolio choices of investment company start-ups. Journal of Financial and Quantitative Analysis, 43(1), 245-266.
- Richie, N., & Madura, J. (2006). Evidence of overreaction among international exchange-traded funds. Journal of Financial Service Professionals, 60(5), 66-79.
- Rubaltelli, E., Pasini, G., Rumiati, R., Olsen, R.A., & Slovic, P. (2010). The influence of affective reactions on investment decisions. Journal of Behavioral Finance, 11(3), 168-176.
- Salisu, A. A., Akanni, L., & Raheem, I. (2020). The COVID-19 global fear index and the predictability of commodity price returns. Journal of Behavioral and Experimental Finance, 100383.
- Schnabel, J.A. (2012). Consumption hedging and home-country bias in a model of international capital market equilibrium. Studies in Economics and Finance, Vol. 29 No. 1, pp. 4-10.
- Shafran, S., Benzion, U. and Shavit, T. (2009). Investors’ decision to trade stocks-an experimental study. The Journal of Behavioral Finance, Vol. 10 No. 2, pp. 81-88.
- Shaker M. A. and Abdeldayem Marwan M (2018). Examining asset pricing models in emerging markets: evidence from Egypt. Corporate Ownership and Control, 16(1), 50-57
- Shu, P.G., Chiu, S.B., Chen, H.C., & Yeh, Y.H. (2004). Does trading improve individual investor performance?. Review of Quantitative Finance and Accounting, 22(3), 199-217.
- Tourani-Rad, A., & Kirkby, S. (2005). Investigation of investors’ overconfidence, familiarity and socialization. Accounting & Finance, 45(2), 283-300.
- Uddin, G.S., Yahya, M., Goswami, G.G., Ahmed, A., & Lucey, B.M. (2020). Stock market contagion of covid-19 in emerging economies. Available at SSRN 3573333.
- Visaltanachoti, N., Lu, L., & Luo, H. (2007).Holding periods, illiquidity and disposition effect in the Chinese stock markets. Applied Financial Economics, 17(15), 1265-1274.
- Wagner, A.F. (2020). What the stock market tells us about the post-covid-19 world. Nature Human Behaviour.
- Yarovaya, L., Matkovskyy, R., & Jalan, A. (2020). The effects of 'black swan' event (COVID-19) on herding behavior in cryptocurrency markets: Evidence from cryptocurrency USD, EUR, JPY and KRW Markets. Available at SSRN 3586511.
- Yung, K., & Liu, Y.C. (2009). Implications of futures trading volume: Hedgers versus speculators. Journal of Asset Management, 10(5), 318-337.