Research Article: 2020 Vol: 24 Issue: 6
Is the Currency Auction at Gateway to Corruption in Iraq?
Hayder Abbas Drebee, University of AL-Qadisiyah
Nor Azam Abdul Razak, University Utara Malaysia
Abstract
Corruption is an economic phenomenon that has implications for both developed and developing countries, especially those in difficult circumstances. Iraq is in the top list of the most corrupt countries. Therefore, investigating the causes of corruption and combating it, is the objective for all decision-makers in this country. This study aims to present an equilibrium relationship between the currency auction and corruption in Iraq for the period (2004-2018) in the short and long run. To achieve this objective, Co-integration and VECM methods were used. The results indicate that the currency auction is a gateway to corruption where the currency auction explains almost half of the changes in the corruption, and there is an equilibrium relationship between these variables in the long run. Accordingly, currency auction should be eliminated and be used only in exceptional cases. It is necessary to coordinate between economic policies to develop a strategy of action by the Central Bank in the future to achieve the economic objectives and to establish a sophisticated banking system like in other developed countries.
Keywords
Currency Auction, Corruption, Co-integration, VECM
JEL Classifications Numbers
C57, C58
Introduction
Corruption is one of the economic phenomena that have serious repercussions on both developed and developing countries. All economic policymakers have considered corruption as their priority to face. It has serious implications for the overall construction of the state and society, which is growing in countries that have difficult circumstances. Iraq is one of those countries that have gone through very difficult circumstances, especially since the eighties and nineties of the last century. Iraq has witnessed a period of turbulent transition at the political and economic levels, including the deterioration of security. Therefore, a fertile environment has been created for political and economic corruption. According to the international index of the most corrupt countries, they respectively are Iraq, Venezuela, North Korea, Libya, Sudan, Yemen, Afghanistan and Syria (Transparency International).
Although the foreign currency auction, which was specifically applied in 2004 by the Central Bank of Iraq, is one of the important tools of monetary policy attributed to achieving monetary stability in the Iraqi economy, it is a new form of economic corruption associated with the process of money laundering in Iraq. The currency auction has become a means of smuggling money from Iraq. Billions of dollars were wasted during the period of (2004-2018).
The use of currency auction in many countries of the world is a very exceptional case, including the creation of balance and stability of the currency. The most dangerous part of this mechanism is the cash sale of the dollar, which annually reached record amounts of 15 billion dollars. It is a very large number compared to Iraq's imports of dollars. Iraq's daily oil imports are less than the volume of currency auction. Consequently, the central bank resorted to withdrawing money from the currency's cash reserves instead of strengthening them, reducing the reserve from 71 billion dollars to below 50 billion dollars. According to the Institute of Governance in Basel (Switzerland), Iraq ranks sixth in the world in the corruption list. According to local and international reports, the amount of money smuggled and stolen under the phenomenon of money laundering has reached billions of dollars. There are dozens of government officials between a minister, a deputy minister, and a general director who practice these methods. The monthly rate of money lost according to international experts amounted to (4) billion dollars, reflecting the devastating effects on the economic, political and security situation and the most horrible deterioration in the standard of living of people, which increased the poverty rate to (30) percent.
There are several studies dealt with the currency auction, mostly with the relationship between the currency auction and the exchange rate of the Iraqi dinar. A study by Ammar Abdul Jabbar Musa (2007), concluded that the Iraqi Ministry of Finance raised the value of the Iraqi dinar because it paid a large number of dollars in the auction of foreign currency. The study of Walid Idi Abdul Nabi (2009) has concluded that the auction of foreign currency has an effective role in raising the value of the Iraqi dinar after the year of 2003. A study by Jalil Shaaban ligature (2012) concluded that the inefficiency of the monetary policy of the Central Bank of Iraq and its focus only on economic stability and neglect the cycle in the restructuring of the economy. The study of Omar Mohammed Akkawi & Zuhair Hamid Salman (2014) reached a significant role of the currency auction in stabilizing the value of the Iraqi dinar against the dollar and the use of the exchange rate of the dinar as a tool to combat inflation. Saad Farhan & Subhi Jarwan's (2013) study discussed the impact of this auction on economic stability. Dagher, Mahmoud Mohammed & Mohammed, Bilal Qasim (2017) and Hodan, Sawsan Karim (2017) studies dealt with the impact of the currency action on the exchange rate in Iraq, but these studies did not address any impact of this action on corruption and this what distinguishes this current study from studies Previous.
This study derives its importance from the currency auction impact on the rampant corruption in Iraq for the period of (2004-2018), which knowing its causes and control is very important for economic development. The position of Iraq is at the bottom of the corruption perception index, raising questions about the seriousness of policymakers fighting corruption. Currency auction is one of the effective methods of crossing the transitional phase experienced by Iraq after 2003 in a step towards the market mechanisms of the economy and monetary policy. It is a new form of economic corruption. The currency auction in Iraq has become a means of smuggling money from Iraq. Therefore, this study aims to study the auction of currency and whether or not it is a gateway to corruption in Iraq in the short and long term.
The rest of this study includes six parts. The second presents a literature review. Part three shows a brief overview of the currency action in the Central Bank of Iraq. The fourth part presents the used standard model, data and statistical methods. The fifth part deals with the presentation and analysis of the results, and finally, part six provides a summary of the findings and recommendations of the study.
Literature Review
Many emerging economies that have gone transition phases as a result of an economic crisis or their desire to integrate into the global economy have followed new trends in the management of the monetary policy. This is done through the use of quantitative methods commensurate with the evolution of their financial systems. Therefore, the economic systems, especially rentier, which suffers from underdeveloped financial systems and heavy reliance on imports to meet domestic demand is the exchange rate the main tool to target the exchange rate and inflation. Therefore, the currency auction was used to influence the currency rate and achieve economic stability.
Therefore, previous studies dealt with the impact of such auction on the exchange rate or economic stability. Goldberg, Tenorio (1997) examines the impact of foreign exchange markets on trading volume and exchange rates, especially in emerging markets, where these countries use auctions in the exchange market to finance their foreign trade. Thus, it contributes to the efficient allocation of productive factors and the minimization of trade distortions to develop their economies by affecting the exchange rate of their currency. The study suggests that although trials are relatively low, they have proved effective in many of these countries over the long term. The Nigerian experience in the two-way auction mechanism and the participation of banks in the auctions and the division of shares between them basis on competition led to the failure of banks to obtain the full foreign exchange needed to affect the volume of trading and prices or strengthen their reserves.
The study of Lami, Hussein Nuri (2012) considered the currency auction is a modern quantitative tool used by the Central Bank of Iraq, which aimed to control the money supply and thus the exchange rate of the Iraqi dinar. The study found the impact of the US dollar sales by the Central Bank of Iraq on the exchange rate of the Iraqi dinar against the US dollar for the period from (2010-2010). It also concluded that the Central Bank of Iraq was able, through sales of the US dollar, to affect the exchange rate of the Iraqi dinar by 36%.
However, the direction of the relationship appeared positive while the logical direction is negative, ie, the research has reached a diagnosis of a defect in the result of using this tool. However, Farhan, Saad Abdul Karim Hammad & Jarwan, Subhi Abdul Ghafour (2013) and by analyzing the volume of cash sold in the currency auction showed that auction sales of foreign currency are much larger than the imports of the private sector. The rise did not have an impact on the exchange rate because it was basically a fixed exchange rate. It also did not affect the stability of the market exchange rate but contributed to raising the prices of imported goods and services. This rise in dollar sales did not have a clear impact on the rate of inflation, for several reasons, primarily the large monetary mass and the decline in the number of other revenues, except oil revenues, which became the main source of financing the public budget. The amount of withdrawn money of the auction does not compare with the size of the large cash issue to be such an increase in sales of the auction unjustified and waste of foreign currency.
The study Akkawi, Mahmoud & Salman, Zuhair Hamid (2014) showed that the Central Bank of Iraq succeeded through the currency auction in raising the value of the Iraqi dinar by about (38)% than in 2003 in the parallel market. This rise and the accompanying stability in the value of the Iraqi dinar against the dollar created attractive retention of individuals for the Iraqi dinar. Thus, the increased demand for individuals on the Iraqi dinar, which reflected on the phenomenon of dollarization. Dagher, Mahmoud & Mohammed, Bilal Kassem's study (2017) refers to the success of the monetary authority in Iraq by using the currency auction in controlling the exchange rate and reducing the exchange gap between the official rate and the parallel price and then maintaining a relatively stable exchange rate for the period (2004-2015). Thus, price stability and purchasing power the economy. However, this success was at the expense of international reserves at the Central Bank of Iraq and thus will become the Iraqi currency threatened to collapse.
Despite the impact of corruption on all aspects of life and considered as one of the most serious obstacles facing development, all previous studies dealt with the currency auction in the Central Bank of Iraq did not address the relationship with the corruption in Iraq.
A Brief Overview of the Currency Auction in Iraq
Government revenues from foreign currency derived from the sale of oil are managed by the Central Bank after deducting 5% of war reparations on Kuwait. These revenues than are divided into two parts. The first section is used to cover government imports and other government requirements.
The second section is used to finance private sector imports through the currency auction and the remainder is added to the international reserve at the Central Bank. A currency auction can be defined as a foreign exchange market where the demand for this currency meets supply and the exchange rate is then formed. For banks to carry out their tasks on the demand side, they open accounts in the Central Bank used for monetary policy in general and auction foreign currency in particular.
Figure 1 presents the rise of central bank sales of foreign currency. This reflects the growing demand for foreign currency to cover import needs as well as to maintain the exchange rate of the Iraqi dinar against those currencies. Sales rose from (558,000)$ in the first quarter of 2004 to (8507,000)$ in the fourth quarter of 2008. It continued to rise to (15,661,000)$ in the third quarter of 2013. Due to the high oil prices, which was reflected in the increase in imports from abroad, then the sales from the currency auction declined continuously and fluctuating. This is due to the low oil prices on the one hand and Iraq to go to war with terrorism on the other hand.

Figure 1 Auction Sales of the Dollar for the Period of (2004-2018)
Econometric Model
The statistical model used to test the impact of the currency auction on corruption in Iraq can be represented as follows:
CORR = f (CUAC)
Where: CORR is an annual corruption rate; CUAC foreign currency sales in dollars by the Central Bank of Iraq.
Given the deficiencies in the objective measure of corruption (such as the number of individuals convicted of committing a corrupt act), CPI, which ranges from 0 (very corrupt) to 10 (very clean), was used in many studies as a study of Abu et al. (2015) and Drebee & Azam, (2019). The reliability of CPI cannot be questioned for its close association with economic variables (Blackburn et al. 2010). Data on the sales of the window of sale of foreign currency were obtained from the annual bulletins of the Central Bank of Iraq (2004-2018), Directorate General of Statistics and Research. To test the equilibrium relationship between a currency auction and corruption in the long and short -run in Iraq the following stages have been used:
1. Test the stationary of the time series.
2. Test the Co-integration of study variables and
3. Using VECM after identifying the appropriate lag length.
These stages are illustrated below:
Stationary Test
The study of the stationary of the time series is a prerequisite in the study and analysis of economic time series (Drebee & Azam, 2019). It is characterized by its un stationary and the absence of stationary from time series. The obtained regression is a spurious regression, as well as problems in the standard analysis (Granger & Newbold, 1974). Thus misleading results will be obtained such as a higher value of R2, or t value.
The time series (y1, y2,………., yt-1, yt) stationary if:
1. (Yt)=μ
2. Var(Yt)=E(Yt-μ)2=σ2
3. Cov(t,t+k)=E(Yt-μ)(Yt+k-μ) (Gujarati, 2008; Drebee & Azam, 2019).
There are several ways to test the stationary of time series:
1. Graphical analysis
2. Autocorrelation function (ACF)
3. Correlogram and
4. Unit root test which can be conducted in several ways including:
1. Augmented Dickey-Fuller Test (ADF): The ADF test estimates the regression equation for the following formula:
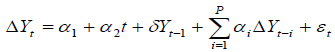
Where: α1 is a constant, t is time, Δyt is the first difference of the series t, Δyt-i the first differences covered for y.
The hypotheses in the ADF test are as follows:
The problem of serial-correlation in estimation is treated by adding the first slowing variants of the dependent variable as explanatory variables because it converts the residue series into stable noise white chains without affecting distribution. The optimal lag length p is obtained by applying one of the following tests:
Akaike Information Criterion (AIC): It is calculated according to the following equation:
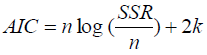
Where: n: the number of observations in the sample, SSR: the sum of squares of error limits, k: number of coefficients in the equation.
Schwarz Information Criterion (SIC): In this criterion, the time lag period that achieves the lowest SIC is selected in addition to determining the length of the appropriate hedging period and the formula is as follows:
SIC = -2 InL + k InN
Where: N is the sample size and K is the length of the time lag.
If the absolute value of the calculated t-statistic is less than the corresponding absolute tstatistic value calculated in Mackinnon (1991) at a significant level, it does not reject the null hypothesis that non-dwelling is at its level. If the absolute value of the calculated t-statistic is greater than the absolute value of the tabular t-statistic, then the null hypothesis is rejected and the time series is devoid of the root of the unit.
2. Phillips-Perron Test (PP): The PP test is based on the same equations used in the ADF test. It an unparalleled correction in obtaining a value unlike the ADF test, which faces heterogeneity and correlation by adding the first differences. The following formula is used to estimate the PP test is:
Where εt represents the state of stationary.
The preference of the PP test over the ADF test is due to taking into account the possibility of errors due to the stability of the variance in the estimate used and then correcting the standard errors of the estimated parameters.
3. KPSS Test: This test addresses some of the weaknesses of the ADF and PP tests if there is a subjective correlation of contrast. This test uses the following formula:
The critical values for this test are based on LM statistic values compared to KPSS values.
Co-Integration Test
Co-integration is a method to address in stationary in time series. If two or more time series are unstationary, the linear structure of these time series is stationary. That is, the two chains will be shared common stochastic trend. Joint integration states that economic variables that presuppose economic theory are long-term equilibrium. Do not diverge significantly from each other in the long run with the possibility of this imbalance in the short term, where this imbalance is corrected by economic forces are returning these variables to move towards equilibrium in the long trun. The most common tests of Co-integration are:
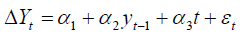
Engle-Granger (1987): The first step of this method is to check the stationary of the time series of the variables under study. If these variables are stable in their levels, then these variables are co-integrated and then estimate the regression equation of cointegration regression using the least-squares method (OLS):
If the time series of the variables are unstationary at their levels and are stationary after the first or second difference, the stationary of the estimated residue series is tested. This series is unstationary, this indicates that there is no co-integration between the time series of the study variables. If these residues are stationary, this indicates a co-integration between time series variables.
Second step is the Error Correction Model: This model is estimated by inserting the residuals estimated in the long-run regression as an independent variable lined for one period.
Johnson & Juselius (1990): This method is considered one of the most important tests of co-integration to distinguish it with small samples as well as proportionality with samples containing more than two variables. Even if there are only two variables, they allow for the reciprocal effect between the variables under study, which is assumed not to exist in the two-step Engle-Granger method. Johansen & Juselius (1988) and Johansen (1988) proposed two tests to test whether there was a Co-integration between the time series under study and to determine the number of vector co-integration r statistically significant.
The first test is the impact test Trace test (λtrace) that calculated statistically with the following relationship:
Where: T is the sample size, r is the number of co-integral vectors, λi is the eigenvalues, n is the number of variables.
The null hypothesis provides for a number of vectors of co-integration equal to r. The null hypothesis of this test is that the number of co-integral vectors is less than or equal to r versus the alternative hypothesis r ≤ n.
The second test is the Maximum Eigenvalue Test (λmax), which is calculated according to the following relationship:
The null hypothesis, which provides for r of co-integration vectors, is tested against the alternative hypothesis r+1 of co-integration vectors. In general, the null hypothesis is tested in both tests by comparing the values of the calculated test with the corresponding table test statistic values given in Johansen & Juselies (1990) at a certain significant level. The null hypothesis that there is a co-integration between the variables of the study is rejected if the calculated test statistic value is greater than the tabular test statistic value.
Vector Error Correction Model (VECM)
VECM is used to verify the shape of short or long-term equilibrium relationships and can be applied in the case of small samples other than statistical methods. The long-term relationship is separated from the short-term and the parameter estimated under this model is more consistent than other methods (Johansen, 1988). This model is only applicable after the Johannesburg Joint Integration Test has been successful. VECM is a special case of the VAR self-regression model for first-order stable time series that is used to describe the dynamic correlation between these series. If we have two series, the following equations form the VAR model:
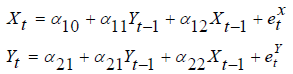
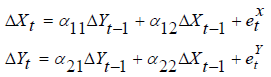
It is clear from the above equation that each series depends on one subjective slowing period and one slowing period for the other series so that we have one class, VAR (1). If the two series are stable in the plane, the equations above can be estimated using the least-squares method. If they are not stable in the level but stable in the first difference, the model is estimated as follows:
If the two series Xt and Yt are complementary of class 1, VECM can be written as follows:
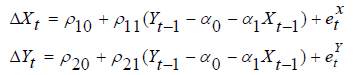
Where: ρ1 and ρ2 the correction factor in the two equations.
Results and Discussion
The Pearson correlation coefficient was used to measure the strength and direction of the relationship between the variables as shown in Table 1.
| Table 1 Correlation Matrix | ||
| CORR | CU-AU | |
| CORR | 1.000 | |
| CU-AU | -0.328 (0.0106) |
1.000 |
It is clear from Table 1 that there is a strong negative relationship statistically significant below the level of significance 1% between study variables. The highest correlation coefficient between corruption and currency auction is (-0.328), therefore, it is less than the (0.9), then there is no multicollinearity problem among the study variables (Hair Black, Babin, Anderson, & Tatham, 2006). The following is a description of these variables as shown in Table 2.
| Table 2 Summary of Variables Description | ||
| Corruption | Currency-Auction | |
| Mean | 1.713333 | 8306.417 |
| Median | 1.700000 | 8996.500 |
| Maximum | 2.200000 | 15661.00 |
| Minimum | 1.300000 | 558.0000 |
| Std. Dev. | 0.209492 | 4079.845 |
| Observations | 60 | 60 |
Table 2 presents that the average corruption was (1.713). The lowest value was (1.3), while the highest value was (2.2). The average currency-auction was (8,306,417) thousand dollars. Differences in the currency auction were noticed, which was the highest (15,661) thousand dollars in the quarter, while the lowest value of (558) thousand dollars.
Lag Length Selection
This test means finding the optimal lag length. The appropriate lag length for each of the study variables is selected depending on the SIC standard. This is done by estimating the unrestricted serial-regression vector of each variable and of a lag length one by one, then choosing the lag length at the lowest SIC value. Table 3 shows the results of determining the optimal lag length for each of the variables. Table 3 shows that the minimum value of SIC is at the oneth lag length.
| Table 3 VAR LEG Order Selection Criteria | ||||||
| Lag | LogL | LR | FPE | AIC | SC | HQ |
| 0 | -507.102 | NA | 375896.0 | 18.513 | 18.586 | 18.541 |
| 1 | -405.341 | 192.422 | 10746.24 | 14.958 | 15.177* | 15.043 |
| 2 | -404.814 | 0.95768 | 12202.57 | 15.084 | 15.449 | 15.225 |
| 3 | -390.107 | 25.670* | 8281.967 | 14.695 | 15.206 | 14.892* |
| 4 | -385.655 | 7.44812 | 8172.542* | 14.678* | 15.335 | 14.932 |
| 5 | -383.647 | 3.2124 | 8830.540 | 14.751 | 15.554 | 15.061 |
| * indicates lag order selected by the criterion | ||||||
| LR: sequential modified LR test statistic (each test at 5%level) | ||||||
| FPE: Final prediction error | ||||||
| AIC: Akaike information criterion | ||||||
| SC: Schwarz information criterion | ||||||
| HQ: Hannan-Quinn information criterion | ||||||
Stationary Test Results
Table 4 shows the stationary results by using ADF and PP. It was applied to the variables used in the study according to the following criteria (Intercept, Trend and intercept, None). It turns out that all the variables were unstationary at the level but were stationary at the first difference, ie, I (1).
| Table 4 Results of unit root test (ADF and PP Test) | ||||||||||||
| Augmented Dickey-Fuller (ADF) Test | Phillips-Perron (PP) Test | |||||||||||
| Level | 1st difference | Level | 1st difference | |||||||||
| Intercept | Trend and Intercept | None | Intercept | Trend and intercept | None | Intercept | Trend and intercept | None | Intercept | Trend and intercept | None | |
| Corruption | -0.117** (0.024) |
-0.11 (0.134) |
-0.004 (0.363) |
-0.527** (0.031) |
-0.628** (0.040) |
-0.518*** (0.000) |
-0.076 (0.255) |
-0.066 (0.695) |
-0.004 (0.406) |
-0.963*** (0.000) |
-1.027*** (0.000) |
-0.958*** (0.000) |
| Currency Auction | -0.09 (0.427) |
-0.107 (0.914) |
0.016 (0.868) |
-2.043*** (0.000) |
-2.107*** (0.000) |
-1.631*** (0.000) |
-0.107 (0.375) |
-0.246 (0.183) |
-0.002 (0.772) |
-1.103*** (0.000) |
-1.108*** (0.000) |
-1.087*** (0.000) |
Therefore, any attempt to characterize the dynamic model of variables at the level would be inappropriate because they could lead to spuries regression. Each variable is considered a first-order integrator as long as the first difference is a zero-order integral.
Co-Integration Test Results
The Johansen & Juselius (1990) method is used, which includes two tests: the trace test (λTrace) and Maximum Eigenvalue test (λMax). SIC was used to determine the appropriate time gap as shown in Table 5.
| Table 5 Co-Integration Test Results | |||
| Unrestricted Cointegration Rank Test (Trace) | |||
| Hypothesized | Trace | 0.05 | |
| No. of CE(s) | Eigenvalue | Statistic | Critical Value |
| None * | 0.301643 | 22.13868 | 15.49471 |
| At most 1 | 0.042564 | 2.392326 | 3.841466 |
| Trace test indicates 1 cointegrating eqn(s) at the 0.05 level | |||
| * denotes rejection of the hypothesis at the 0.05 level | |||
| **MacKinnon-Haug-Michelis (1999) p-values | |||
| Unrestricted Cointegration Rank Test (Maximum Eigenvalue) | |||
| Hypothesized | Max-Eigen | 0.05 | |
| No. of CE(s) | Eigenvalue | Statistic | Critical Value |
| None * | 0.301643 | 19.74635 | 14.26460 |
| At most 1 | 0.042564 | 2.392326 | 3.841466 |
| Max-eigenvalue test indicates 1 cointegrating eqn(s) at the 0.05 level | |||
| * denotes rejection of the hypothesis at the 0.05 level | |||
| **MacKinnon-Haug-Michelis (1999) p-values | |||
It is clear from Table 5 that the calculated value for both trace statistics and max eigenvalue is greater than its critical value at 5% level. This suggests a long-term equilibrium between corruption and currency auction. As shown in Table 5, there is one co-integration equation that can explain its parameters as estimators of the long-run co-integration relationship between these variables (Hallam & Zanoil, 1992).
VECM Estimation
After ensuring that the time series of the variables of the study model is unstationary in the level and stationary in the first difference and that all the variables are co-integration, and in order to reveal a long-term equilibrium relationship between currency auction and corruption, these variables should be represented in the Engle and Granger (1987) Error correction model (ECM), which includes the possibility of testing and estimating the short and long-run relationship between model variables. Standard problems caused by spurious regression can also be avoided In the light of the results of the error correction model in Table 6, the significance of the error correction limit at the level of 5% with the expected negative sign. This confirms the existence of a long-term equilibrium relationship in the model, which means that the currency auction and corruption do not move far apart from each other in the long run. The error correction coefficient of -15.83% indicates that corruption is adjusted towards its equilibrium value in each time period by 15.82% of the remaining imbalance in the long run.
| Table 6 Results of Vector Error Correction Estimates | |
| Error Correction: | D(CORRUPTION) |
| CointEq1 | -0.158251 |
| (0.03902) | |
| D(CORRUPTION(-1)) | -0.199258 |
| (0.13134) | |
| D(CORRUPTION(-2)) | 0.389140 |
| (0.15794) | |
| D(CORRUPTION(-3)) | 0.190179 |
| (0.15198) | |
| D(CORRUPTION(-4)) | 0.136124 |
| (0.14736) | |
| D(AUCTION_CUURENCY(-1)) | -3.80E-06 |
| (5.0E-06) | |
| D(AUCTION_CUURENCY(-2)) | -8.18E-06 |
| (5.2E-06) | |
| D(AUCTION_CUURENCY(-3)) | -1.03E-05 |
| (5.2E-06) | |
| D(AUCTION_CUURENCY(-4)) | -2.21E-06 |
| (5.7E-06) | |
| C | 0.001506 |
| (0.00764) | |
| R-squared | 0.479204 |
| Pro(F-statistics) | 0.0002 |
The equivalent of 15.82% of this deviation or imbalance in the duration of t is corrected. On the other hand, this correction ratio reflects an appropriate adjustment rate towards equilibrium. This means that corruption takes approximately 6.32 years towards its equilibrium value after the impact of the shock in the model due to the change in its specificity.
Table 6 shows that the R2 value is 0.48. This indicates that the currency auction accounts for 48% of the changes in corruption in Iraq during the study period. Referring to the currency auction has a significant impact on the response to corruption and 52% of unexplained factors responsible for variables not included in the model and represented by the random variable. It is also noted that the probability of the statistics of Feshr does not differ from zero and hence we conclude that the value of the calculated Feshr statistics is greater than its tabular value, which indicates the model is suitable to represent the linear relationship.
Short-run parameters are not significant, Table 7. This indicates that there is no short-run equilibrium relationship between the currency-auction and corruption in Iraq during the study period.
| Table 7 Wald Test Results | |||
| Test Statistic | Value | df | Probability |
| F-statistic | 1.477604 | (4, 45) | 0.2249 |
| Chi-square | 5.910415 | 4 | 0.2059 |
Diagnostic Tests
Diagnostic tests indicate that the model has passed standard tests. Figure 2 shows that the estimated model achieves stability conditions. If all the coefficients are smaller than one and all the roots are located within a single circle, which means that the model does not suffer from the problem of misstatement errors or inconsistency of discrepancy.

Figure 2 Inverse Roots AR Characteristics Polynomail
Inverse Roots of AR Characteristic Polynomial
Table 8 shows that the model is not serial-correlated using the LM test.
| Table 8 Results of Serial Correlation | ||
| VEC Residual Serial Correlation LM Tests | ||
| Null Hypothesis: no serial correlation at lag order h | ||
| Lags | LM-Stat | Prob |
| 1 | 1.056120 | 0.9012 |
| 2 | 1.495687 | 0.8274 |
| 3 | 2.395361 | 0.6635 |
| 4 | 1.411971 | 0.8421 |
| Probs from chi-square with 4 df. | ||
The Breusch-Pagan-Godfrey test showed that there is no problem of Heteroskedasticity with a probability value of 0.9238, as shown in Table 9.
| Table 9 Results of Heteroskedasticity Test: Breusch-Pagan-Godfrey | |||
| F-statistic | 0.388947 | Prob. F(10,44) | 0.9448 |
| Obs*R-squared | 4.466970 | Prob. Chi-Square(10) | 0.9238 |
| Scaled explained SS | 6.704722 | Prob. Chi-Square(10) | 0.7530 |
Finally, the Cumulative Sum of Square of Recursive Residuals (CUSUMSQ) test indicates that the estimated coefficients of the model used are static during the study period. The graph of the test census mentioned for this pattern has fallen within the critical limits at a significant 5% level as shown in Figure 3.

Figure 3 Test Results of the Cumulative Summation of the Residual Squares.
Conclusion
The transitional situation experienced by the Iraqi economy after 2003 and the adoption of new trends in the management of monetary policy in a step towards the market mechanisms led to the use of the currency auction as one of the effective methods used to cross that transition.
The auction of foreign currency, which was applied in 2004 by the Central Bank of Iraq is one of the important tools of monetary policy attributed to the achievement of monetary stability in the Iraqi economy. It is the only source of foreign currency to cover private-sector activities. However, this auction is a new form of economic corruption. Currency auction in Iraq has become a means of smuggling money from Iraq.
Corruption is an obstacle to the development process and a major cause of the problems and crises in the world in recent years. Most Arab countries, including Iraq, have ranked last in the corruption perception index. Therefore, the study aimed to indicate whether the currency auction causes corruption in Iraq for the period (2004-2018). To achieve this goal, ADF and PP tests were used to test the stationary of these variables and the VECM test to test whether there was an equilibrium relationship between them in the short and long run. Using PP and ADF tests, the study was found to be unstationary in its levels but stationary at the first differences at 5%, ie I (1).
Using the Johansen & Juselius method, there is a co-integration between the of currency auction and corruption. A long-run equilibrium relationship was found between these variables by using VECM, i.e., they change together in the long run. The current values of corruption are influenced by their previous values and the values of the currency auction, while there is no relationship between them in the short run.
The results also pointed to the significant contribution 48% to the currency auction in the interpretation of changes in corruption, which shows that currency auction is a gate to corruption in Iraq during the period (2004-2018). Accordingly, the decision-makers in Iraq should cancel the auction currency and use it only in exceptional cases and for urgent necessity. Also, reducing the volume of foreign remittances by limiting imports, which is an element of smuggling of foreign currency abroad.
References
- Abu, N., Karim, A., & Aziz, A. (2015). Corruption, political instability and economic development in the economic community of West African states (ECOWAS): Is there a causal relationship?. Contemporary Economics, 9 (1), 45-60.
- Akkawi, O.M., & Salman, Z.H. (2014). The role of foreign currency auction in stabilizing the value of the Iraqi dinar for the period 2003-2011. Journal of Administration and Economics, 101, 62-76.
- Blackburn, K., Bose, N., & Haque, E. (2010). Endogenous corruption in economic development. Journal of Economic Studies, 37(1), 4-25.
- Central Bank of Iraq. General Directorate of Research and Statistics. Various annual bulletins.
- Drebee, H.A., Azam, A., & Razzaq, T.H. (2019). The impact of governance indicators on corruption in Arab countries. Contemporary Economics, 14(3), 354-366.
- Drebee, H.A. (2016). The causal relationship between economic growth and financial development in Iraq for the period (1970-2013). AL-Qadisiyah Journal for Administrative and Economic Sciences, 18(4), 169-184.
- Drebee, H.A. (2016). The impact of financial depth and exchange rate on inflation in Iraq during the period (1970-2014). Muthenna Journal of Administrative and Economic Sciences, 6(2), 1-16.
- Dickey, A., & Fuller, A. (1979). Distributions of the estimators for autoregressive time series with a unit root. Journal of the American Statistical Association, 74, 427-431.
- Dickey, D.A., & Fuller, W.A. (1981). Likelihood ratio statistics for autoregressive time series with a unit root. Econometrica, 49, 1057-1072.
- Dmd, J.D. (2012). Iraqi dinar between the central bank auction and the depletion of reserves and the illusion of fixing the exchange rate. Qadisiyah Journal of Administrative and Economic Sciences, 14, 2.
- Engle, R.F., & Granger, C.W. (1987). Cointegration and error-correction representation, estimation and testing. Econometrica, 55, 251-276.
- Farhan, S.H., & Jarwan, S.A. (2013). The continued rise of the foreign currency auction sales of the Central Bank of Iraq and its impact on achieving economic stability for the period (2003-2011). Tikrit Journal of Economic and Administrative Sciences, 10, 30.
- Granger, C.W.J. (1969). Investigating causal relations by econometric models and cross-spectral methods. Econometrica, 37(3), 424-438.
- Granger, C.W., & Newbold, P. (1974). Spurious regression in econometrics. Journal of Econometrics, 2, 111-120.
- Goldberg, L., & Tenorio, R. (1997). Strategic trading in a two-sided foreign exchange auction. Journal of International Economics, Elsevier, 42, 3-4.
- Hair, J.F., Black W.C., Babin B.J., Anderson R.E., & Tatham R.L. (2006). Multivariate Data Analysis. 6th Edition, Pearson Prentice-Hall, Inc. Upper Saddle River, USA.
- Johansen, S. (1988). Statistical analysis of cointegration vectors. Journal of Economics, Dynamics and Control, 12, 231-254.
- Johansen, S., & Juselius, K. (1990). Maximum likelihood estimation and interference on cointegration with application to the demand for money. Oxford Bulletin of Economics and Statistics, 52, 169-210.
- Lami, H.L. (2016). US dollar sales and their effect in real exchange price for Iraqi dinar an applied research at the central bank of Iraq. Journal of AL-Turath University College, 20, 348-360.
- Musa, A. (2007). The financial implications of the appreciation of the Iraqi dinar for the period 2003-2007. An analytical study.
- Mahmoud, D. (2017). The impact of currency auction on the variability of the exchange rate in Iraq 2004-2015. Journal of Economics and Administrative Sciences, 23(99), 295.
- Transparency International. (2018). Corruption Perception Index. Retrieved from: http://www.transparency.org/research/cpi/overview.
- Walid, E.N. (2009). Foreign currency auction and its role in Iraqi dinar exchange rate stability, central bank of Iraq. General Directorate of Banking and Credit Control. Retrieved from: https://cbi.iq/.