Research Article: 2023 Vol: 26 Issue: 4
K−Means Nonhierarchical Cluster and Dbscan Outlier Detection in the Grouping of Stock Issuers
Atiek Iriany, Brawijaya University
Henida Ratna Ayu Putri, Brawijaya University
Harry Maringan Tua, Brawijaya University
Citation Information: Iriany, A., Ratna Ayu Putri, H., & Maringan Tua, H. (2023). K-means non hierarchical cluster and dbs can outlier detection in the grouping of stock issuers. Journal of Management Information and Decision Sciences, 26 (S4), 1-14.
Abstract
Group analysis aims to group objects based on similar characteristics so that they are in one group homogeneous and between groups heterogeneous. Study this aim group issuer share in Indonesia based on volatility, liquidity, and market capital. This study uses the non-hierarchical K-Means Clustering method, because the number of samples is big and the number of groups are known. The K-Means Clustering grouping method produces as many as 6 groups with different characteristics. 2. Group 1 consists of stock issuers with quite high volatility and liquidity. The characteristic of group 2 is that it consists of stock issuers with the lowest volatility. Big Capital is the nickname for group 3 because it has market capital or the asset value is very large among all groups and the volatility is very small, and liquid. In Group 4, stock issuers have the highest volatility and the lowest liquidity. Results of profile interpretation in group 5, issuer’s stocks have the highest liquidity and market capital is quite low. Share issuers in group 6 have the volatility highest. Group 3 is recommended as an option for investing. Because, having market capital or large asset values, liquid, and volatility is low enough to minimize risk. The originality of this research is that there is no combination of methods between grouping in fields with k-means clustering and detection of sales with DBSCAN, especially in the field of issuer share in Indonesia
Keywords
Clustering, Stock Issuers, K-Means, Liquidity, Volatility.
Introduction
Group analysis is a method used to classify data by trying to separate component data into several groups. Group analysis is a multivariate grouping technique used for grouping objects into groups based on their characteristics (Hair et al., 1998). Homogeneity within the group was high while between groups was heterogeneous.
Stocks are the best choice used by the younger generation and investors to invest because they are attractive and can be obtained with small capital. In addition, stocks also tend to be liquid and not time-bound, such as long-term deposits, so stocks are considered one of the most popular investment instruments in the world. Shares are areas or accounts that are valued for various financial instruments related to the ownership of a company. Companies that are listed on the Indonesia Stock Exchange or have submitted an initial public offering (IPO) can sell their shares to the public. As many as 680 issuers of shares were listed on the Indonesia Stock Exchange in March 2020, and it continues to increase from time to time. All listed shares have different characteristics, both in terms of company origin and share price movements in the (technical) market. Based on IDX's annual report, it was found that the Indonesia Stock Exchange experienced unexpected things in the last few years. In 2020, the JCI was very low due to a decrease in sales volume that occurred during the Covid-19 pandemic. Currently, Indonesia is still being affected by the Covid-19 pandemic, and this has resulted in the stock market experiencing volatility high enough. This study uses the non-hierarchical K-Means Clustering method, because the sample size is large and the number of groups is known. Syakur et al., 2018. Reported that the use of the elbow method in K-Means Clustering helps determine the number of groups based on the decrease in the number of squared largest deviations. Research by Patel et al. (2011) explains that data standardization and elimination of outliers produce an average minimum squared deviation and increase clustering efficiency. The Elbow method and DBSCAN can be an option for overcoming the weaknesses of K-Means Clustering so that the group profile interpretation results are better. Based on this description, grouping needs to be done to see how the character of each group of stock issuers is formed.
The variables in this study are volatility, liquidity, and market capital. This study aims to classify stock issuers in Indonesia using K-Means Clustering with two auxiliary methods to improve the quality of grouping results, namely the elbow method and Density-based spatial clustering of applications with noise (DBSCAN). The use of these two methods in combination has never been done before, especially when applied to grouping stock issuers. It is hoped that this research can be used as a consideration for investors in allocating funds to certain stock issuers that have good ratings or are by the profile. The limitation in this study is when determining the optimal number of groups using only the elbow method and in determining the maximum distance between two objects in one group that is allowed to use the K-distance graph. The originality of this research is that there is no combination of methods between grouping in fields with k-means clustering and detection of sales with DBSCAN, especially in the field of issuer share in Indonesia. The originality of the research can be further explained in the following table. The following table 1 will explain some of the previous studies by comparing the pluses, minuses, along with the shortcomings of the methods that can be completed in this study.
| Table 1 Plus Minus Interesting Facts This Research |
|||
|---|---|---|---|
| Title | Plus | Minus | Interesting |
| Integration K-Means Clustering Method and Elbow Method For Identification of The Best Customer Profile Cluster (Syakur et al., 2017) | Indonesian SMEs still do not have customer mapping. This research helps map customers using the K-Means method | This study has not implemented outlier detection. It is important to carry out outlier detection before clustering because it can affect the results of clustering. | This study has not performed outlier detection. |
| Optimization of Data Grouping in the K-Means Method with Outlier Analysis (Ariawan, 2019) | Research has done outlier detection before cluster analysis. | Outlier detection does not use the DBSCAN method. DBSCAN has advantages that are adjusted to the distance. | This study has not performed outlier detection using the DBSCAN method. |
| Impact of Outlier Removal and Normalization Approach in Modified K-Means Clustering Algorithm (Mehta dan Patel, 2011) | This study uses a different outlier method, namely using R-estimators. | The R-estimator method utilizes the rank value, and does not pay attention to the distance from each object | Research has not done outlier detection using the DBSCAN method. |
Literature Review
K-Means Clustering
K-Means clustering is a distance based non-hierarchical grouping method that seeks to partition data into two or more groups. Objects that have the same characteristics will be grouped into one group and if they are different they will be grouped into another group. The purpose of this grouping is to minimize the variance within a group and maximize the variance between groups. Before the grouping process, determine the number of groups. Each object will be calculated as the the distance to each group center, the smallest distance is used to determine the group. The K-Means procedure is:
1. Specifies k as the number of clusters you want to form
2. Allocate objects into clusters randomly
3. Determine the cluster center ( centroid ) from the existing data in each cluster with equation (2.1).
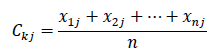
Remarks:
 th cluster centers on th variable
n : a lot of data in the cluster to-
4. Determine the distance between each object and each centroid by calculating the distance between each object and each centroid using the distance measure square Euclidean distance with equation (2.2).

Remarks :
dkj : Square Euclidean Distance cluster ke- for variable to-j
k : cluster index
j :the index of the variable
xij :the value of the th object in the cluster that for the variable j
νkj :cluster centroids ke- k for variable to-j
5. Calculating the objective function with the formula (2.3)
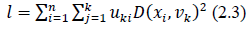
Description
n : amount of data
c : the number of clusters
uik :membership data object to-th i and cluster-th k
 : square Euclidean distance space between object ke- to the cluster centroid to-k
6. Allocating each data to the nearest centroid /average which is formulated in equation (2.4).
7. Repeat steps 3-6 until there is no movement of the object or no change in the objective function.
Euclidean Distance
The Euclidean distance is the most commonly used measure of similarity distance. Euclidean distance between objects i and the center of the group k which is in P the variable dimension, then it is defined in equation (2.5).
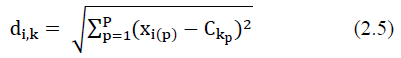
Information
dik =distance of the object to the center of the group k
xi(p) = the value of the object to the variable to-i
Ckp =center of group to - on variable to –P
I =1,2,...,n
P =1,2,...,p
k =1,2,...,K
K = the number of groups
n =many objects
P =number of variables
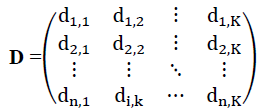
These distances can be formed into an ordered matrix into matrix with the order n×m
According to Dillon & Goldstein (1984) before calculating the Euclidean distance, the original data should be standardized first if it has different unit sizes, which can lead to high standard deviation values, which can result in invalid group analysis calculations. Standardize data in the form of a z-score, with the formula shown in equation (2.6) below.

Information:
Zi =the standard value-i
Xi =data value to-i
 =average
s =standard deviation
Elbow Method
Moment determines the number of groups, methods Elbows own method with count score the sum of the squared deviations in each group. At a certain point, there will be a graph of the largest decrease with a curve called the elbow criterion, then it becomes the number the best group (Bholowalia & Kumar, 2014). The equation for the sum of squared deviations could be shown in the following equation (2.7).

Description:
k= 1,2,...,K
K= the number of groups
xi= value of the th object
Ck= center of the group –k
DBSCAN
The Density-based Spatial Clustering of Application with Noise (DBSCAN) method is a density-based clustering method from the position of the observed data with the principle of grouping objects that are relatively close together. In this method, two inputs (input values) are required before clustering. The first input is the epsilon value which is the maximum distance between two objects in one allowed cluster, and the second input is the minimum number of objects to form a cluster (minPts). According to Sander et al. (1998) if the data has more than two variables, the minPts is twice the number of variables. The epsilon value can be chosen using a k-distance graph where k equals minPts. The optimal epsilon value is obtained at the point of maximum curvature. The distance method used in the DBSCAN method is the Euclidean distance. A pair of objects is said to be neighboring if the distance between the two objects is less than the epsilon value.
In addition, there are two conditions for object adjacency, namely directly density-reachable and density-reachable. Object " x " is said to be directly density-reachable (directly connected) with object " p " if object " x " is adjacent to object " p " and the number of neighbors of object " p " is more than equal to minPts. An object is said to be density-reachable if there is another object “ x ” that connects object “ p ” with observations “ q ”, but object “ x ” must be directly density-reachable (Yuwono et al., 2015). An illustration of the condition of neighboring objects can be seen in Figure 1.

Figure 1: Illustration Of Directly Density-Reachable And Density-Reachable Observations.
DBSCAN clustering results can be divided into three types, namely core points, border points, and noise points. Core points are objects that are in a cluster. Border points are objects that are between two clusters. Noise points are objects that are neither core points nor border points and are outside the cluster (Tan et al., 2016). In practice, in this study the DBSCAN method was used to identify objects detected as noise.
Volatility
Volatility is measurement statistics for fluctuation prices during a period certain Firmansyah (2006) Size the show decrease and increase prices in a short period and no measure level price, however level variations from one period to period next. High volatility reflects characteristics that supply and demand are not normal. Market volatility occurs consequence entry of information new to in the market or stock exchange. As a result, market participants do evaluation return to their assets trade. In an efficient market, the level price will do the adjustment with fast so that formed price reflect information new the Anton (2006). Based on some of these explanations, it can be concluded that stock price volatility is an important variable where this variable measures the distance between stock price fluctuations, if it is too high, it is certain that the stock price will rise or fall very quickly. Stock price volatility is calculated using the standard deviation of the percentage change in price.
Liquidity
Liquidity is the price and how easily an asset is converted into cash by selling it (Bodie, & Marcus, 2009). From the perspective of market participants, a market is a liquid when the market has a high volume, which can be traded instantly with minimal price impact. Harris (2003) defines liquidity as the ability to carry out commercial transactions in large quantities, which can be done quickly and at low cost if desired. Liquidity is an important characteristic of the market as a function of providing information about the possibility of trading at a certain size, at a certain price and at a certain time, in which market functions the market is running well (well-functioning market). This characteristic provides an opportunity for traders to consider factors other than size, price, and timing that affect the probability of a trade. The greater the volume of a stock traded every day, the more liquid the stock will be. The median of stock volume is used as an indicator of the liquidity of a stock. The choice of the median as an indicator is due to its robustness against outliers (unlike the mean) so that the results obtained are not biased.
Market Capital
Market capitalization is necessary to calculate because is one of the usual criteria, investors use to decide is will buy a share something a company, as well as reflect the total value of the company or the price aggregate share of something a company. Becomes investors target disbursing investment funds. Market value, also known as market price, is price of stock on the current market this. If the stock market or the exchange is closed, the market price is price closing. If the market price is multiplied by the total issued shares or circulate, then obtained market value or market capitalization (Nasution & Sulistyo, 2016). Market capitalization is the size of outstanding shares to the public, counted from the total outstanding shares multiplied by the price share end (May, 2013). Then, the market capitalization is score total company public that has record shares on the stock exchange (Fakhruddin, 2008). Next market capitalization is the market value of shares issued (shares outstanding) by stock issuer (Raharjo, 2006). Based on the opinions that have been stated above, can taken conclusion that market capitalization is the score magnitude share circulated that has been listed on the stock exchange. Market capital got through multiplication between total shares with price share. The more big the Italian market cap so the more difficult for price share played by a handful of people.
Methodology
Data Source
Data obtained from stock market transactions through the yahoo finance website from 2017 to 2021. A total of 471 issuers shared used in the study of this. There are 11 variables used in the study is Liquidity, Volatility and Market Capital (Rp). Because there is different unit variables so need to conduct standardization.
Method Analysis
Stages analysis performed for complete problem in this study.
1. Do preprocessing data and statistics descriptive with present data in shape table with count minimum, average, maximum, and IQR values in the data.
2. Look if there are different units for the variables used. If there is a difference unit, then conducted based on data standardization the following equation (3.1).
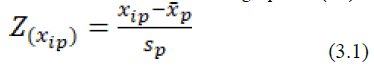
Information:
 = the standard value of each data i of the each variable p
 = the data value i of the each variable p
 = the average of the each variables p
 = standard deviation of each variable p
3. Do DBSCAN for detect issuer share outlier with inputs minPts = 22, and epsilon which will searching for use k-distance graph. If there is outlier so issuer share eliminated. The DBSCAN procedure is presented in Figure 2. following.

Figure 2: Dbscan Procedure.
4. Do the elbows method to get the optimal number of groups, by calculating the sum of the squared deviations every many groups using the following equation (3.2).

Description :
k = 1,2,… ,K
K = many groups
Xi= value object i
Ck= center group k
5. Do method K-Means Clustering with the number of groups obtained from the previous stage. K-Means Clustering produce served on the following diagrams Figure 3.

Figure 3: K-Means Clustering Procedure.
6. Get profile group which formed and interpreted the result.
Results and Discussion
Results Analysis Descriptive
The results of the descriptive analysis obtained, namely, most of the issuer's stock volatility is 4%. Issuer share ATIC or PT. Anabatic Technologies Tbk, and MASA, that is PT. Multistrada Arah Sarana Tbk has volatility highest as big 286% as well as 131% because of change in price. Part big issuer shares have liquidity big 0.067% with a maximum of 2.68% owned by ERAA or PT. Erajaya self-sufficiency Tbk. On variable market capital, Most of the stock issuers have asset values as big IDR 11.8 trillion, with the lowest as big IDR 22.1 billion owned by PT. Century Textiles Industry Tbk and the highest Rp. 501.8 trillion is owned by PT. Bank People Indonesia (Persero) Tbk figure 4.

Figure 4:Volatility Per Year (Maximum).
Results Application DBSCAN
Method DBSCAN with python software produces output in the form of labels group of each issuer of stock, with -1 as category noise or outlier and other numbers as a particular group category. Stock issuers who get the label 1 are stock issuers categorized noise or outliers. Based on the results DBSCAN as many 24 issuer shares detected as an outlier. Issuer share which was detected as outlier on method DBSCAN served in Table 2.
| Table 2 Outlier Share Issuer |
|---|
| Issuer share which detected as an outlier |
| ACST, AKRA, ANTM, ASII, ATIC, BBCA, BBNI, BBRI, BMRI, BOGA, BULL, BYAN, CPIN, ELSA, ERAA, HMSP, ICBP, MAPI, MASA, MDKA, SMA, TLKM, TPIA, UNVR |
Results Application Elbows Method
Results from the total square deviation of every many groups were visualized to determine the number of groups (k) that have scored optimal. Results visualization served in Figure 5.

Figure 5:Results Of The Elbow Method.
The information obtained from Figure 5 is k with the score which optimal is at one moment many groups = 6, which is the point with a decrease in high JKD values, and slope perfect. So in the application elbows method, it can be concluded that the optimal value for applying multiple groups is 6.
Results Application K-Means Clustering
Analysis results group on issuer share in Indonesia, use method non-hierarchical K- Means Clustering with many groups (k) = 6, the results obtained are the number of stock issuers in every group as presented in Figure 6.

Figure 6:The Results Of Grouping With The K- Means Clustering.
Based on Figure 2, obtained the conclusion is that many issuer share every group enough diverse. The order of grouping from smallest to largest is group 6 as much 1 issuer share, group 3 as much 27 issuer share, group 5 as many as 35 stock issuers, group 1 as many as 68 issuers of shares, group 4 as many 130 issuer share, and group 2 as much 186 stock issuers. The details issuers formed in 6 groups the shown in Table 3.
| Table 3 Details Member Issuers In The 6 Groups Formed |
|---|
| Group 1 |
| ACES, AGII, AISA, ALDO, APLN, ASRI, ASSA, BABP, READ, FATHER, BBYB, BEST, BFIN, BHIT, BIMA, BJBR, BKSL, BNBA, BRMS, BSDE, BWPT, CINT, CTRA, DGIK, DKFT, DSFI, DYAN, EMTK, ESSA, FREN, GJTL, GPRA, IKAI, IMAS, INDX, ISSP, ITMG, JPFA, KAEF, KBLI, KRAS, LPKR, MAIN, MBSS, MCOR, MPMX, MPPA, PANR, PBRX, PNBS, POLY, PTRO, PWON, RAJA, RALS, RBMS, SDMU, SMDR, SMRA, SOCI, SRTG, TKIM, TMAS, TRIS, WINS, WSBP, WTON, ZBRA |
| Group 2 |
| AALI, ABDA, ABMM, ADES, ADMF, ADMG, AKKU, ALTO, AMAG, AMFG, ANJT, APIC, ARGO, ARNA, ARTI, ASDM, ASGR, ASMI, ASRM, AUTO, BALI, BATA, BAYU, BBMD, BBRM, BCAP, BCIC, BDMN, BEKS, BIPI, BIPP, BIRD, BISI, BJTM, BLTA, BNGA, BNII, BOLT, BPFI, BPII, BRNA, BSIM, BSSR, BTEK, BTPN, BUDI, BUKK, CASS, CEKA, CENT, CFIN, CITA, CLPI, CMNP, CNKO, CPRO, CSAP, CTBN, CTTH, DEFI, DEWA, DILD, DLTA, DMAS, DSNG, DUTI, DVLA, ECII, EKAD, EMDE, EPMT, FAST, GAMA, GDYR, ECHO, GMTD, GZCO, HADE, HEROES, HEXA, HOTL, IATA, IGAR, IKBI, IMPC, INAI, INCI, INDS, INPC, INTA, IPOL, JECC, JGLE, JIHD, JKON, JRPT, JSPT, JTPE, KDSI, KIAS, KIJA, KINO, KKGI, KOPI, KPIG, LINK, LMPI, LPCK, LPGI, LPPS, LTLS, MAGP, MAYA, MBAP, MDLN, MDRN, MERK, META, MFIN, MICE, MIDI, MIRA, MITI, MKNT, MLBI, MMLP, MRAT, MSKY, MTFN, MTLA, MYOH, NIRO, NISP, NOBU, NRCA, PANS, PJAA, PNBN, PNIN, PNLF, POWR, PPRO, PRAS, PRDA, PSAB, PSKT, PTSP, RANC, RICY, BREAD, RUIS, SCCO, SGRO, SHID, SHIP, SIDO, SILO, SIMP, SIPD, SKLT, SMAR, SMCB, SMSM, SPMA, SRSN, STAR, STTP, SULI, SUPR, TAXI, TBLA, TCID, TGKA, TIRT, TOBA, TOTL, TOTO, TRST, TSPC, TURI, ULTJ, UNIC, UNSP, VIVA, VOKS, WOMF |
| Group 3 |
| ADRO, AGRO, AMRT, BNLI, BRPT, CASA, DNET, DSSA, EXCL, GEMS, GGRM, HRUM, INCO, INDF, INKP, INTP, ISAT, JSMR, KLBF, MEGA, MIKA, MYOR, PTBA, SMGR, TBIG, TOWR, UNTR |
| Group 4 |
| AGRS, AHAPS, AIMS, AKPI, ACTION, ALKA, ALMI, AMIN, APEX, APII, APLI, ARII, ARTA, ASBI, ASJT, STEEL, BBHI, BBLD, BIKA, BINA, BKDP, BKSW, BLTZ, BMAS, BMSR, BNBR, BRAM, BTON, BVIC, CANI, CNTX, DART, DAYA, DNAR, DPNS, ERTX, ESTI, fish, FMII, FORU, FPNI, GDST, GLOB, GOLD, GSMF, GWSA, HDFA, HITS, IBFN, IBST, ICON, IDPR, IMJS, INAF, INCF, INDR, INPP, INRU, INTD, ITMA, JAVA, KARW, KBLM, KBLV, KICI, KOBX, COINS, KONI, LION, LMAS, LMSH, LPIN, LPLI, LRNA, MBTO, MDIA, MFMI, MLPT, MREI, MTSM, MYTX, NELY, NIKL, OASA, OKAS, OMRE, PADI, PALM, PBSA, PDES, PEGE, PGLI, PICO, PNSE, PSDN, PTIS, PTSN, PUDP, PYFA, RDTX Rally, RIGS, WHEEL, SAFE, SDPC, SDRA, SKBM, SMBR, HR, SMMT, SONA, SQMI, SRAJ, SSTM, TALF, TBMS, TFCO, TIFA, TIRA, TMPO, TPMA, TRIM, KEEP GOING, VICO, VINS, VRNAs, WAPO, WICO, YPAS, YULE |
| Group 5 |
| ABBA, ADHI, ARTO, BBKP, BBTN, BCIP, BGTG, BMTR, EARTH, DOID, ENRG, INDY, KREN, LEAD, LPPF, LSIP, LET, MEDC, MLIA, MLPL, MNCN, MTDL, PGAS, PKPK, PTPP, SAME, SCMA, SSIA, SSMS, TARA, TINS, WEHA, WIIM, WIKA, WSKT |
| Group 6 |
| ELTY |
Result of analysis group consider similarity volatility, liquidity, as well market capital on each issuer stock.
Interpretation Profile Group
After getting results grouped and has know the issuer share member in every group, next is to interpret the characteristics of each group by comparing Q1, median, Q3, and IQR using data origin.
Group 4 with the member as much 130 issuer share have volatility Very spread among all groups. A total of 65 issuer shares in group 4 have volatility from 4% to 5.5%. Gap highest median volatility by 20%. Because ELTY did a stock split or split the shares into more shares many with a score nominal more low per sheet. Group 5 with 35 members of issuer shares has liquidity which is highly dispersed among all groups. A total of 18 issuer shares in group 5 have liquidity from 0.2% to 0.35%. Group 5 has the highest liquidity median among all groups. Issuer share on group 5 tends easy traded. Group 3 with the member of as much 27 issuer share which served on Attachment 8. have market capital Very spread in Among all group. As much 14 issuer shares in group 3 has a market capital between IDR 35.8 trillion to IDR 57.9 trillion. This matter evidenced by stock issuers in group 3 is companies big with score asset tall, that is Warehouse Salt (GGRM), Semen Indonesia (SMGR), Jasamarga (JSMR), and united Tractors (UNTR).
Conlcusion
Based on the results and discussion obtained conclusion is as follows
1. Application K-Means Clustering with distance euclidean on stock issuer data in Indonesia obtained results that many member group 1 as much 68 issuer shares, group 2 as much 186 issuer shares, group 3 as much 27 issuer shares, group 4 as much 130 issuer shares, group 5 as much 35 issuer shares, and group 6 as many as 1 shares issuer.
2. Group 1 members issuer shares with volatility and liquidity enough tall. Characteristic from group 2, that is members stock issuers with volatility Lowest. big Capital is a nickname for group 3, because have market capital or score asset very big in Among all groups as well as volatility very small, and liquid. In Group 4, stock issuers have volatility high and the lowest liquidity. Interpretation results from profile on group 5, issuer shares have liquidity highest and market capital enough low. Issuer shares in group 6 has the volatility highest.
Acknowledgement
Thank you to all parties for their support and input in the preparation of this research. All the support and input given is very useful for the perfection of this research. This research did not receive any specific grant from funding agencies in the public, commercial, or not-for-profit sectors. The authors report there are no competing interests to declare.
References
Anton, A. (2006). Analysis of stock return volatility models (Case Study on LQ 45 Stocks at the Jakarta Stock Exchange) (Doctoral dissertation, Diponegoro University).
Bholowalia, P., & Kumar, A. (2014). EBK-means: A clustering technique based on elbow method and k-means in WSN.International Journal of Computer Applications,105(9).
Bodie, K, & Marcus. (2009). Investments. (6th ed.). Jakarta: Salemba Empat.
Dillon, W.R., & Goldstein, M. (1984).Multivariate analysis: Methods and applications. New York (NY): Wiley, 1984.
Indexed at, Google Scholar, Cross Ref
Fakhruddin, H.M. (2008).AZ capital market terms: contains a collection of popular capital market terms, especially in the Indonesian capital market, covering various terms related to trading in stocks, bonds, mutual funds, derivative instruments and various other related terms. Elex Media Komputindo.
Firmansyah. (2006). Analysis of international coffee price volatility. New York: Entrepreneur.
Hair, J. F, Anderson, R.E, Tantham, R. L, & Black, WC. (1998). Multivariate data analysis. Fifth edition. Prentice hall international, inc. Upper saddle river, new jersey.
Harris, L. (2003).Trading and exchanges: Market microstructure for practitioners. OUP USA.
May, E. (2013). Smart Trader Rich Investor.Jakarta: PT Gramedia Pustaka Utama.
Nasution, LZ, & Sulistyo, S. (2016). The influence of stock trading volume, stock trading frequency, stock price volatility, and market capitalization on stock returns of food and beverage companies listed on the indonesia stock exchange. Accounting st.
Patel, V.R., & Mehta, R.G. (2011). Impact of outlier removal and normalization approach in modified k-means clustering algorithm.International Journal of Computer Science Issues (IJCSI),8(5), 331.
Raharjo, S. (2006). Wealth Asset Building Tips. Elex Media Komputindo.
Sander, J., Ester, M., Kriegel, H.P., & Xu, X. (1998). Density-based clustering in spatial databases: The algorithm gdbscan and its applications.Data Mining and Knowledge Discovery,2, 169-194.
Indexed at, Google Scholar, Cross Ref
Syakur, M. A., Khotimah, B.K., Rochman, E.M. S., & Satoto, B.D. (2018). Integration k-means clustering method and elbow method for identification of the best customer profile cluster. InIOP conference series: materials science and engineering, 336,012017.
Indexed at, Google Scholar, Cross Ref
Tan, P.N., Steinbach, M., & Kumar, V. (2016).Introduction to data mining. Pearson Education India.
Indexed at, Google Scholar, Cross Ref
Yuwono, A., Oslan, Y., & Dwijono, D. (2015). Implementation of the density-based spatial clustering of applications with noise method to find the direction of the spread of dengue fever outbreaks. Exploration Journal of Information Systems and Science, 2 (1).
Received: 03-Apr-2023, Manuscript No.JMIDS-23-13420; Editor assigned: 05-Apr-2023, Pre QC No. JMIDS-23-13420 (PQ); Reviewed: 17-Apr-2023, QC No. JMIDS-23-13420; Revised: 19-Apr-2023, Manuscript No. JMIDS-23-13420(R); Published: 25-Apr-2023