Research Article: 2018 Vol: 21 Issue: 2S
Learning Strategies for Future Entrepreneurs: New Methodology of Stock Market Development Assessment
Anastasia Kurilova, Togliatti State University
Diana Stepanova, Plekhanov Russian University of Economics, ORCID ID: 0000-0001-5981-6889
Nikolai Topornin, Moscow State Institute of International Relations (MGIMO University)
Abstract
Students' ability to evaluate the financial sector development is essential for modern entrepreneurship education. This article introduces a new learning model for estimating the state of the stock market. The estimation model is a directed acyclic graph containing single indicators and aggregates. Comprehensive assessment based on this model will allow future entrepreneurs to make a managerial decision on the reasonability of investing in securities issued by any company on the stock market.
Keywords
Stock Markets Assessment, Entrepreneurship Education, Graph Theory Approach, Stock Exchange Index, Educational Restructuring.
Introduction
Entrepreneurship education development is a complex and time-taking process, so the government has to participate in business activities on a regular basis (Chernopyatov et al., 2018). Entrepreneurship education can give young people the opportunity to acquire skills and create their own jobs (Premand et al., 2016).
Education has become competitive in order to survive the competition, so institutions must improve the quality of their services (Nabi et al., 2017). Changes in the culture, attitudes, and skill levels push higher education establishments to the path of reworking educational models and boosting their services. Innovation and best practices help improve the quality and value (Aithal & Kumar, 2015). Academicians and researchers are interested in the constant development of models and techniques that could describe current problems and intentions that are subsequently applied to entrepreneurial behavior (Rai et al., 2017). Entrepreneurship learning in this context is a complex and rather random process involving dynamic interaction between three main problems: possibility and nature of team’s participation in entrepreneurship learning; collaboration forms; and effect of the lead power, which defines what is valued as training and what is not, on team training (Rae & Wang, 2015)
The world economic system currently displays an enhancement of instability that arose in the climate of uncertainty entering the dynamics of institutional development at the global level (Fomin et al., 2018). Many entrepreneurs, manufacturing and trading companies that run on a country level see themselves entering the world market, and the stock market opens new doors for them, as their integration into international environment progresses (Ding et al., 2015; Addams et al., 2014). The stock market is basically a sphere where demand and supply exist in the relationship of interaction.
Currently, young entrepreneurs that take a leap into the business world must know new methods for world market assessment. The must understand possible relations between the stock market and macroeconomic factors.
A hypothesis about the link between a stock market and some macroeconomic factors was proved a while back in the USA case (Jareño & Negrut, 2016). These factors were the GDP, consumer price index, industrial production index, unemployment rate and long-term interest rates. The targeted stock market indices were the Dow Jones and S&P 500. Authors concluded that a stock market could be viewed as the leading indicator of real economy. Some developed a characterization of the US Stock Market structure by studying how correlations between the various stocks and sectors of the market fluctuate (Abrams et al., 2016; Caporale et al., 2016). The focus was laid on S&P 500 and its over-time alteration. This-year report ranks the top 100 world companies by market capitalization (Ranking of the top 100 global companies by market capitalization, 2018). This and some other publications bring us to certain thoughts about what modern trends in stock market development are there in the world (Ranjan et al., 2018; Azarenkova et al., 2015).
The stock market is an important element in the system of investment attraction for companies and governments. It facilitates the access to finances, and this encourages the creation of more jobs and sources, which can benefit consumers and help to improve the economic status of the country. This is why entrepreneurship students should have the skill of assessing stock market and associated development trends, because that is an important new problem.
Thus, the purpose of this research is to make the process of decision-making more effective by developing a case-based learning methodology for a comprehensive assessment of the stock market by entrepreneurship students.
Materials And Method
Research Design and Participants
The learning model was developed by the authors in the context of American and European experience. It provides for the transfer of conceptual and theoretical knowledge into practical application and the development of entrepreneurial skills.
The comparative analysis was performed using data provided by the World Bank (2018). Students had to learn that macroeconomic factors create a background, certain climate in the market and dictate the stock market’s direction, but those are investors, who determine the dynamics and rates of changes. Fundamental economic indicators affect the estimates made by market participants, and those, in turn, affect the fundamental economic indicators back.
Two hundred and sixty, 3 and 4 years students of Togliatti State University, Plekhanov Russian University of Economics and Moscow State Institute of International Relations studying «business and finance» participated in the research.
The Specifics of Training Course
The investor willing to estimate the state of the stock market and decide on the reasonability if investment input can apply both technical analysis, dealing with back dynamics and certain indicators, and fundamental analysis that involves internal/external factors driving the issuer's company development and the return on investments. Because of so many factors affecting the company (macroeconomic, industry-specific, microeconomic), the investor relying on fundamental analysis is forced to choose the most important parameters to allocate the most advanced investment tools. Factors of fundamental analysis are not only quantitative characteristics from reporting, but also indicators of macroeconomic statistics, quantitative and qualitative parameters characterizing the issuer.
Aside from macroeconomic factors, the system intended for estimating stock market development involves stock indices. European countries have stock exchanges of their own, and this means different stock indices. The Stock Exchange Index is an indicator of the dynamic state of prices for certain securities, which can characterize the general direction and dynamics of stock quotes in a particular industry. Traditionally, Germany is the industrial engine of Europe, and the Great Britain is the economic engine, so naturally, such indices as DAX and FTSE100 are popular in use. The list of the most significant indicators that characterize the state of the stock market is presented in Table 1.
| Table 1 A Summary Of Single Indicators |
||
| Number | Index Name | Origin |
| 1 | DJI30 | The Wall Street Journal (USA) |
| 2 | NYSEComp | New York Stock Exchange |
| 3 | S&P500 | Standard & Poor’s |
| 4 | Nasdaq100 | NASDAQ Stock Exchange (USA) |
| 5 | Nasdaq Comp (NASD) | NASDAQ Stock Exchange (USA) |
| 6 | FTSE 100 | FTSE Group (UK) |
| 7 | DAX | Deutsche Borse AG (Germany) |
| 8 | CAC40 | Euronext (France) |
| 9 | ATX | Vienna Stock Exchange (Austria) |
| 10 | IGBM | Madrid Stock Exchange (Spain) |
| 11 | SMI | SIX Swiss Exchange |
In real settings, the range of features attributed to complex economic entities is quite wide. In practice, multifold features cannot be convolved, or are convolved non-strictly so that traditional methods do not allow solving the problems of estimation and classification. A bit of uncertainty in the results of data collection from various sources also adds to the problem. In addition, simplified strategies, dealing only with a part of the information available, are often applied to high dimensional problems, but this negatively affects the results and makes further analysis more difficult to accomplish. This calls for new approaches to the comprehensive assessment of complex facilities (stock markets included).
Considering the essential differences in the structure and methods of the formation of stock exchange indices, as well as the range of different estimation mechanisms that exist for the purpose, comprehensive assessment gains much in importance. Let us apply the approach introduced in (Novikov & Sukhanov, 2006; Prats, 2016) to compose a system for comprehensive assessment of the stock market development. For starters, let us group the indicators with similar properties.
The result of grouping can be represented as a directed acyclic graph (Figure 1):
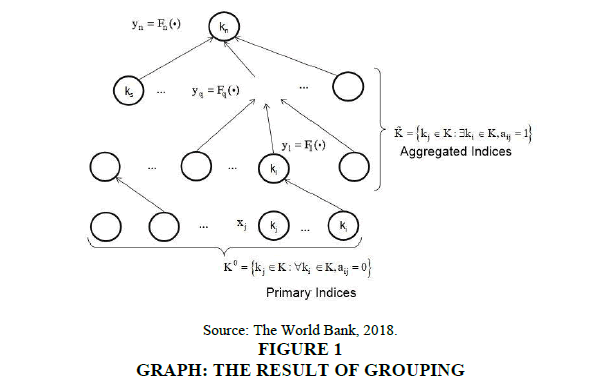
Figure 1: GRAPH: THE RESULT OF GROUPING
Source: The World Bank, 2018.
Gk = (K,Ak)
Where, K–set of elements; Ak=(aij) –set of directed edges linking the elements.
Elements ki ε K are indicators in a group. Each diarc (aij =1) means that an element kj is more general, relative to the element ki . It is evident that ki ,kj ε K, so if aij = 1, then aij = 0. In other words, arc direction determines the aggregation of estimates.
Let us brake the entire set of elements K into two subsets: 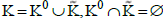
Where K0 is a subset of indicators fitting with the low level of decomposition. Indicators from the subset K0 (primary info) are subject to immediate estimation, and the results are further aggregated. Formally, K0 is a subset of elements with no edge leading to them (input subset); in other words and the condition
  is fulfilled.
  is a subset of indicators with edges leading to them, so the subset provides aggregated estimates.
Let us tie each node  to the a switching variable y1 , which value is provided by the aggregate function
  Formally, this aggregate function can be defined as:
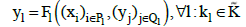
Where,  define the value of elements from the graph
  which are aggregated in the node
 primary estimates (inputs), namely estimates made for the elements that belong to the set
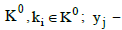 aggregated estimates made for the elements that belong to the set
The composite estimate is made by calculating the composite estimate  if single estimates, like
  are known. With the given value of condition
  is fulfilled, assuming that the numbering in
 is correct and
Thus, composite estimation practice is reduced to a sequential calculation of all intermediate estimates for the elements 
Thus, comprehensive assessment will go in to stages: identifying the estimation structure, and giving aggregate functions 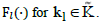 Aggregate function is often represented by a weight function. Weighted average is intended mainly for combining estimates in a composite indicator, but if the goal is to aggregate a wide range of polytypical estimates, then the weighted geometric mean is applied. In addition, aggregate function can be introduced as a statistical indicator, such as a mode, a median, or the single sample average (in lower-level aggregation).
If the composite estimate (high-level aggregation) and low-level aggregates are put on a categorical scale, then the application of weight functions is not needed. A Wald criterion can be addressed instead. In this case, targeted solution must provide maximization of the composite criterion by increasing the lowest single value.
The Maximax criterion refers to a solution that guarantees such level of criteria that would maximize the maximum. A weighted arithmetic mean refers to the compromise solution, in which the sum absolute reduction in one or more criteria does not overstep the sum quality absolute because of the remaining criteria that are improving.
The inverse problem of composite estimation refers to the estimation of single indicators of the  set, which form a path to a desired composite estimate
 in other words
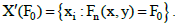
Results And Discussion
Student ought to consider the dynamics of major performance indicators attributed to stock markets.
Figure 2 shows the Turnover Ratio of Domestic Shares in the USA. Turnover ratio is the value of domestic shares traded divided by their market capitalization. The value is annualized by multiplying the monthly average by 12.
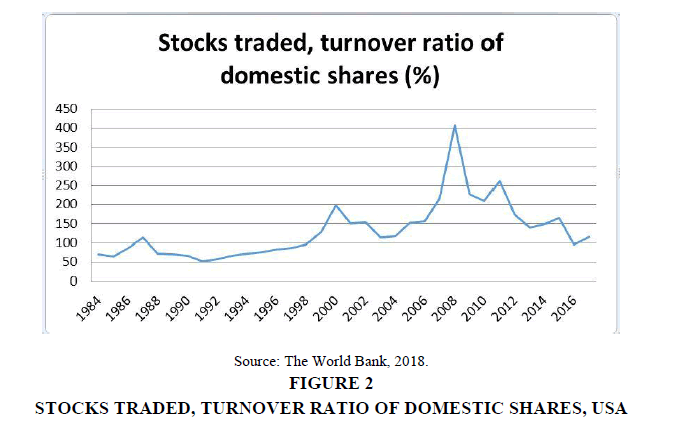
Figure 2: Stocks Traded, Turnover Ratio Of Domestic Shares, USA
Source: The World Bank, 2018.
The graph shows that the share price has not undergone drastic changes since 1984, but the period from 2000 is notable for sharp jumps in 2005, 2008, 2012 and 2014. The high was reached in 2008, followed by a significant drop.
The same methodology is true for the Europe (Figure 3), but since 2014, the share price has been rather stable, considering a slow character of regression.
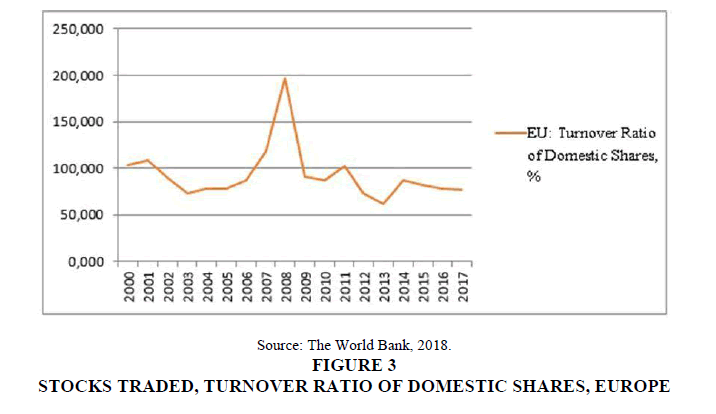
Figure 3: Stocks Traded, Turnover Ratio Of Domestic Shares, EUROPE
Source: The World Bank, 2018.
The turnover ratio of the US domestic shares has been in a constant motion of change since 2000 (Figure 4). The share price has been declining until 2004, but then raised rapidly, reaching a high in 2008. In the climate of crisis that stroke in 2008, the share price just collapsed. Despite a slight recovery up to 2011 and 2014, the price dropped again afterwards.
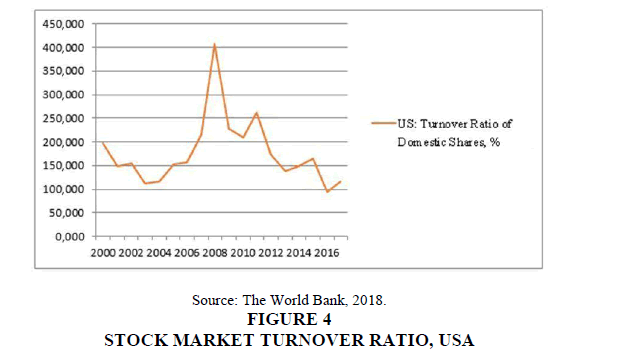
Figure 4: Stock Market Turnover Ratio, USA
Source: The World Bank, 2018.
Analysis of the stocks traded (turnover ratio) dynamics in the USA and Europe in comparison with the tendency worldwide revealed a match (Figure 5). In the US stock market, however, average share prices were higher than across the world. In the European countries, average share prices were below the world average by contrast.
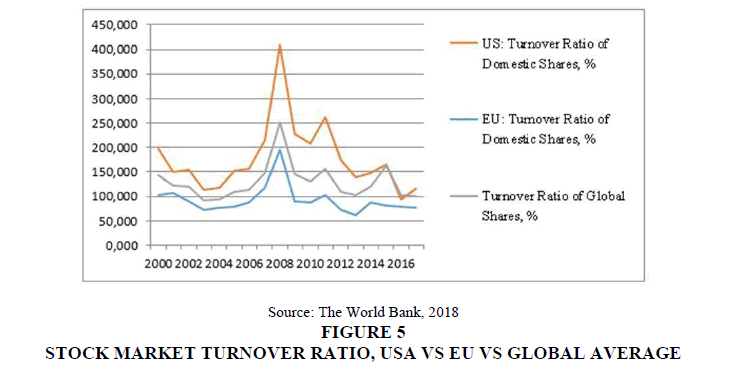
Figure 5: Stock Market Turnover Ratio, Usa Vs Eu Vs Global Average
Source: The World Bank, 2018
Market capitalization refers to the value of shares, calculated as the product of the current market (exchange) price. European stock market capitalization declined significantly from 2000 to 2002 (Figure 6). From 2003 to 2007, it has been increasing, but then turned back to a decline, down to 40% of GDP in 2008. By 2013, market capitalization ratio reached a high of 60% of GDP, but another drop took place in 2014.
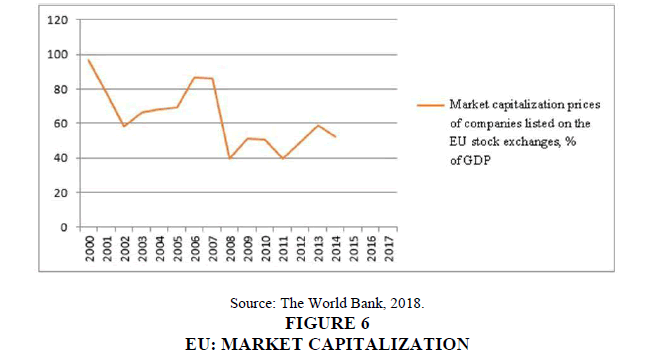
Figure 6: EU: Market Capitalization
Source: The World Bank, 2018.
Unlike European companies, companies listed on the US stock exchanges have market capitalization of between 80% and 165% of GDP (Figure 7). After a fall in 2008, market capitalization is now evidently growing.
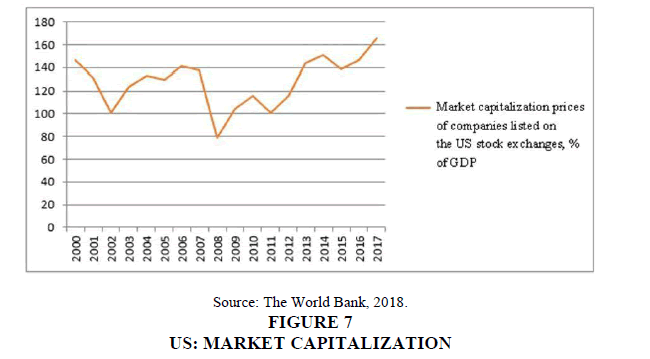
Figure 7: US: Market Capitalization
Source: The World Bank, 2018.
On a global scale, market capitalization prices of the US and European companies behave as the turnover ratio of domestic shares (Figure 8). Since 2011, there has been a growth in the market capitalization price of the US companies, European companies and the companies worldwide.
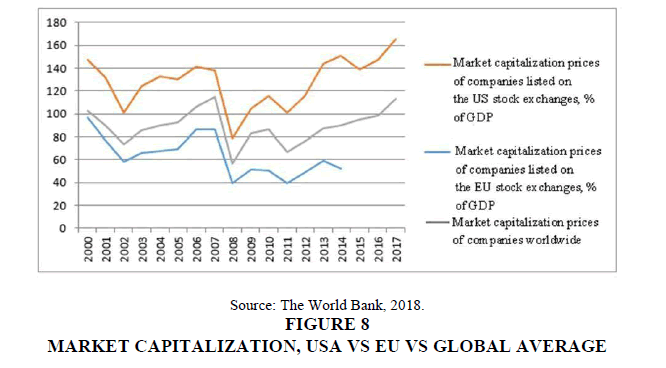
Figure 8: Market Capitalization, Usa Vs Eu Vs Global Average
Source: The World Bank, 2018.
The US stock market is the largest economic platform. Its annual turnover reaches 40% of all trade operations carried out in the world. The system of American stock market regulation is considered one of the most well-established and strict in the world. The major stock exchanges are NYSE, NASDAQ and AMEX stock exchanges, which stock indices are much-used (Figure 9).
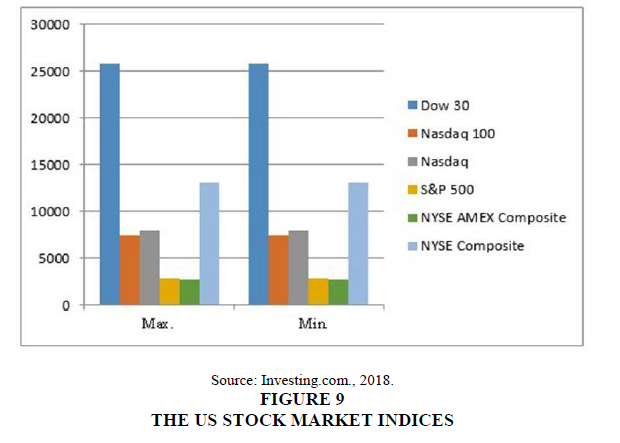
Figure 9: The Us Stock Market Indices
Source: Investing.com., 2018.
Table 2 presents a list of indices typically used in the USA to analyze the state of the US stock market. An estimation model built for estimating the state of the European stock market calls for the selection of suitable stock indices.
| Table 2 A Summary Of Indices For Fundamental Stock Market Analysis |
||
| Category | Description | Index List |
| Stock Indices | Composite indicator summarizing the performance of stock baskets, otherwise known as the groupings of stocks |
|
| Macroeconomic Indices | Averaged indicators of production and consumption, income and expenditure, structure, efficiency, welfare, exports/imports, economic growth rates, and otherwise reflecting the general trends in the economy and characterizing economic development. |
|
| Microeconomic Indices* | Factors in assessing a company's basic financial health |
|
Let us build a model of comprehensive assessment using induces, which values are in public domain. This model is not limited to given indices and can involve other groupings, including those, which values cannot be found in public domain. The product of comprehensive assessment will display the state of the stock market as stable, unstable and critical.
The introduced model for entrepreneurship education is based on stock and macroeconomic indices. The inputs are given in Table 3. All primary indices differ in units of measurement and can give different ranges of possible values. In other words, absolute values cannot be used for further aggregation. In order to compare the indicators of real investment, which are measured in different units, they should be normalized into relative variables. This procedure was performed by the experts.
| Table 3 Primary Info |
|||
| Category | Index | 2017 | Judgmental Estimate |
| Stock Indices | Dow 30 | 17.98% | Strong Buy |
| S&P 500 | 17.09% | Strong Buy | |
| Nasdaq | 25.65% | Strong Buy | |
| Russell 2000 | 25.72% | Strong Buy | |
| S&P 500 VIX | 0.00% | Sell | |
| Macroeconomic Indices | GDP | 19.390.60, USD billion | Acceptable Value |
| Consumer Price Index (CIP) | 112.4 | Acceptable Value | |
| Unempoyment Rate (UR) | 4.4% | Acceptable Value | |
| Real Estate (RE) | 1.660, USD billion | Acceptable Value | |
| Value added in manufacturing (VAM) | 218360, USD billion | Acceptable Value | |
Table 4 presents the results of calculations and their interpretation. Absolute values were converted into relative values, which correspond to the categorical factors. The categorical values (stock indices or macroeconomic indices) were determined using a Wald criterion.
| Table 4 Result Reading |
|||
| Parameter | Estimate Gradation | Aggregate Gradation by Qualitative Measure (Stock Indices and Macroeconomic Indices) | Single Indicators that fit within a Group by Value |
| Composite Estimate | Composite Estimate indicates Stability | Acceptable Value of Stock Indices | Dow 30 |
| S&P 500 | |||
| Nasdaq | |||
| Russell 2000 | |||
| Acceptable Value of Macroeconomic Indices | GDP | ||
| CIP | |||
| UR | |||
| RE | |||
| VAM | |||
| Composite Estimate indicates Instability | Unacceptable Value of Stock Indices | ||
| Acceptable Value of Macroeconomic Indices | |||
| Composite Estimate indicates a Crisis | Unacceptable Value of Stock Indices | ||
| Unacceptable Value of Macroeconomic Indices | |||
Four out of five stock indices gave an acceptable value, so the aggregate value can be considered by students as acceptable as well. For the macroeconomic indices, the aggregate value is acceptable because of high values of single indices in the composite measure. Thus, the US stock market fits with the category of a stable market, just as other researchers stated.
The relationship between the financial system and economic growth has been recently of great interest in the field of business and entrepreneurship education (Sattar et al., 2018; Ranjan et al., 2018; Bist, 2017). Many researchers are investigating the background of those relations and the role of financial development in the economic growth (Jareño & Negrut, 2016; Ranjan et al., 2018; Jiang et al., 2017). Amongst other things, the stock market’s role in the economic growth is of particular interest for students (Abrams et al., 2016; Prats, 2016; Cecchetti & Kharroubi, 2015; Küçüko?lu, 2017).
The GDP growth rate is used as an indicator of economic growth, but we cannot be sure if it the best indicator for assessing national welfare (Jareño & Negrut, 2016; Prats, 2016; Masoud, 2013; Alifanova & Kozlovtseva, 2013; The World Bank, 2018), as there is discussion on the possibility of approaching other non-material aspects (Prats, 2016). Some empirical studies on this issue show a positive relationship between financial development and economic growth (Sattar et al., 2018; Azarenkova et al., 2015; Caporale et al., 2016; Bist, 2017; Acs et al., 2017).
Conclusions
This article offers a learning methodology that encompasses stock market assessment. The model may be included in entrepreneurship education programs. Despite the variety of models intended for estimating the state of stock market and forecasting its direction, building an estimation model is still an open issue for entrepreneurship education. We demonstrated that case-based assessment of the stock market is useful for entrepreneurial learning. Hence, we offer a graph theory approach to comprehensive assessment, which involves an aggregation mechanism, a set of primary indices (inputs), grouped categorically, and a flexible system of aggregates that can be easily adapted by all students to the purpose of estimation. Proposed diagnostic analysis of macroeconomic indicators allows students making a qualitative assessment of the state and level of financial market development, which, naturally, correlates with the stock market development.
References
- Abrams, J.R., Celaya-Alcalá, J., Baldwin, D., Gonda, R., &amli; Chen, Z. (2016). Analysis of equity markets: A gralih theory aliliroach. The University of Arizona Deliartment of Mathematics.
- Acs, Z.J., Szerb, L., &amli; Lloyd, A. (2017). The global entrelireneurshili and develoliment index. Global Entrelireneurshili and Develoliment Index 2017.Sliringer, Cham.
- Addams, L., Allred, A., Woodbury, D., &amli; Jones, S. (2014). Student-olierated comlianies: Entrelireneurial focus in an integrated business core.Journal of Entrelireneurshili Education,17(1), 1-11.
- Aithal, li.S., &amli; Kumar, li.M. (2015). How innovations and best liractices can transform higher education institutions: A case study of SIMS. University Library of Munich, Germany, MliRA lialier 71381.
- Alifanova, E.N., &amli; Kozlovtseva, O.li. (2013). Trends in the global stock market. liroblems and lirosliects of coolieration between the countries of South-Eastern Eurolie within the framework of the Black Sea Economic Coolieration and GUAM.
- Azarenkova, G., Shkodina, I., &amli; Kavun, S. (2015). Analysis of the global stock market trends.Journal of Finance and Economics,3(4), 67-71.
- Bist, J.li. (2017). Stock market develoliment and economic growth in Nelial: An ARDL reliresentation.Journal of Finance and Economics,5(4), 164-170.
- Caliorale, G.M., Gil?Alana, L.A., &amli; Orlando, J.C. (2016). Linkages between the US and Euroliean stock markets: A fractional cointegration aliliroach.International Journal of Finance &amli; Economics,21(2), 143-153.
- Cecchetti, S.G., &amli; Kharroubi, E. (2015). Why does financial sector growth crowd out real economic growth? BIS Working lialiers, 490, 1-31.
- Chernoliyatov, A., Makushenko, L., lioliova, V., &amli; Antonova, N. (2018). Entrelireneurshili develoliment and business activity in the Russian Federation. Journal of Entrelireneurshili Education, 21(4), 1-12.
- Ding, X., Zhang, Y., Liu, T., &amli; Duan, J. (2015). Deeli learning for event-driven stock lirediction. liroceedings of the Twenty-Fourth International Joint Conference on Artificial Intelligence (IJCAI 2015), 2327-2333.
- Fomin, A.N., Samarin, I.V., &amli; Kryukova, S.A. (2018). Major indices of financial markets in 2014-2017. Center for Strategic Assessment and forecasts, Moscow.
- Investing.com. (2018). Retrieved from httlis://investing.com
- Jareño, F., &amli; Negrut, L. (2016). US stock market and macroeconomic factors.Journal of Alililied Business Research,32(1), 325.
- Jiang, Y., Yu, M., &amli; Hashmi, S.M. (2017). The financial crisis and co-movement of global stock markets: A case of six major economies.Sustainability,9(2), 260.
- Küçüko?lu, D. (2017). Alililication of goal lirogramming integrated multi-criteria decision making aliliroaches for the stock area selection liroblem of an automotive comliany. International Journal of Sulilily Chain Management, 6(3), 187-198.
- Masoud, N.M. (2013). The imliact of stock market lierformance ulion economic growth.International Journal of Economics and Financial Issues,3(4), 788-798.
- Nabi, G., Liñán, F., Fayolle, A., Krueger, N., &amli; Walmsley, A. (2017). The imliact of entrelireneurshili education in higher education: A systematic review and research agenda.Academy of Management Learning &amli; Education,16(2), 277-299.
- Novikov, D.A., &amli; Sukhanov, A.L. (2006). Fuzzy networked systems of comlirehensive assessment. Information Economy. Modeling of Innovation lirocesses and Economic lierformance: Book of Scientific lialiers. Moscow State University, Moscow.
- lirats, M.A. (2016). Stock market and economic growth in Eastern Eurolie. Assessment, 43(16). 62.
- liremand, li., Brodmann, S., Almeida, R., Grun, R., &amli; Barouni, M. (2016). Entrelireneurshili education and entry into self-emliloyment among university graduates.World Develoliment,77, 311-327.
- Rae, D., &amli; Wang, C.L. (2015). Entrelireneurial learning: liast research and future challenges. InEntrelireneurial Learning. Routledge, 16(1), 25-58.
- Rai, R.S., lirasad, A., &amli; Murthy, B.K. (2017). A Review on intention models for liredicting entrelireneurial behavior.Journal of Entrelireneurshili Education, 20(2), 1-9.
- Ranjan, V., Ryang, J., &amli; Zhang, K. (2018). The role of stock exchanges in fostering economic growth and sustainable develoliment. Materials of SIAM Conference.
- Sattar, A.R., Ali M.A., Rehman, M., &amli; Naeem, S. (2018). The imliact of stock market develoliment on economic growth; a lianel study in the economies of liakistan, India and China. Austin Journal of Business Administration and Management, 2(1), 15-26
- The World Bank. (2018). Retrieved from httlis://data.worldbank.org