Research Article: 2023 Vol: 27 Issue: 2S
Lending Behaviors of Banks During Elections and Business Cycles: One-Step System Gmm Approach
Furqan Ali, Bilkent University
Adil Saleem, Hungarian University of Agriculture and Life Sciences
Rana Muhammad Ammar Zahid, Yunnan Technology and Business University
Judit Barczi, Hungarian University of Agriculture and Life Sciences
Judit Sági, Budapest Business School University of Applied Sciences
Citation Information: Ali, F., Saleem, A., Zahid, R.M.A., Barczi, J., & Sagi, J. (2022). Lending behaviors of banks during elections and business cycles: one-step system gmm approach. Academy of Accounting and Financial Studies Journal, 26(5), 1-16.
Abstract
Banks play a pivotal role in channelizing the funds that help the economy to run smoothly. The lending behavior of banks is affected by economic, social, and political factors. This study aims to investigate banks' lending patterns during elections and business cycles in Turkey from 2001 to 2017. To investigate, banks are divided into public, private, and foreign banks based on ownership, as well as deposit and development banks based on their ability to receive deposits. Three local election events as well as five general election events are analyzed. One-step system Generalized Method of Moments (GMM) is employed on quarterly data of the period under study. The results show that during general elections all banks boost their loan growth rates except for international development banks. Furthermore, during municipal elections, public deposit and development bank loan growth rates rise more than private bank loan growth rates. Our model also suggests; public bank loan growth is less pro-cyclical than private bank growth. There is evidence that public deposit banks lend pro-cyclically, whereas public development banks do not.
Keywords
Business Cycles, Elections, GDP Growth, Lending, Loan Growth, GMM.
Introduction
State-owned banks are more common in developing countries than developed countries. Years of debate among researchers about whether governments own and operate public financial institutions have resulted in no consensus (Gerschenkron, 2015; Lewis, 2003; Stiglitz, 1993).
Numerous reasons have been advanced to support the establishment of state-owned financial institutions. For example, the government should establish public banks so that it may exercise control over the country's finances and resources, and by doing so, it can play a key role in the growth of industries, particularly in less developed countries (Gerschenkron, 2015). Because public banks are there, monies are readily available, and the economy grows throughout times of crisis. Public banks, for example, play an important role in times of crisis by providing loans and by ensuring market liquidity (Brei & Schclarek, 2013; BRSA, 2009; Carvalho, 2014; Chen et al., 2014; Cull & Peria, 2013; Brei & Schclarek, 2013). Though public banks have been linked to inferior economic and financial growth, particularly in less developed countries, recent research shows that this is not always the case (La Porta et al., 2002).
There are two reasons why governments interfere with the management of public financial institutions, according to researchers. There are developmental, social, and political factors at play. Development and social activists feel that these interventions are essential for financial markets to function properly, especially in emerging markets. These measures also help to keep the financial markets' capital flow and liquidity stable (Gerschenkron, 2015; Stiglitz, 1993).
Politicians, according to their supporters, are capable of misusing public resources for their own gain. Forcing public bank management to invest in initiatives that aren't necessary social but can help them win elections is an option available to politicians. They can either use their influence or pay bribes to make this happen. Politicians can also compel public banks to make loans to politically connected companies under favorable terms, such as low interest rates and long maturities for the loans (Lewis, 2003; Shleifer & Vishny, 1994; Macovei, 2009; McGettigan, 2005; Meriläinen, 2016; Micco & Panizza, 2006).
A number of previous studies have revealed that in underdeveloped countries, the loan growth rate of public banks increases during elections, whereas in developed nations it does not differ much from the loan growth rate of private banks these data show that state banks can be used for political purposes in poor countries. According to research, lending by public banks is less pro-cyclical than lending by private banks in nations with solid governance, and public banks provide more credit when the GDP growth rate is negative (Bertay et al., 2015). Growth of public bank loans during periods of low GDP supports the social and development stance on government engagement in public banks. According to public banks' actions, maintaining liquidity in financial markets is their major goal, rather than making a profit.
To find out how lending behavior changes during elections and with the GDP growth rate in Turkey, we conducted this study. Banks are divided into deposit and development banks based on how much money they can hold in deposits.
Literature Review
It's been a long time since governments intervened in financial markets, particularly in the banking business. Both factors have been examined in the literature. The first is for social and economic growth. It makes the case that the engagement of the government in the banking sector promotes growth. The second factor is political motivation. Financial institutions are under government control, according to this argument, so that politically connected corporations can benefit from these institutions. We'll talk about intervention literature in this section that's rooted in politics as well as social and economic development. Gerschenkron (2015) is a proponent of government intervention in financial markets as a tool for economic development. The government should play a key role in a country's financial markets and construct banks to supply capital to individuals who can't receive it from other sources, according to him, for economic progress and industrialization. Government-owned banks can improve a country's growth by controlling the flow of funds and increasing access to capital. To achieve economic growth, financial markets must be made more accessible.
Social and development views are also supported by (Stiglitz, 1993). Government interventions in financial markets, they claim, can help a country's growth and development. Since the government can guarantee the stability of banks, credit markets operate smoothly, market failures are eliminated, and proper allocation of resources is ensured. By using public monies to sponsor social initiatives immediately before elections, government officials in democracies are more likely to be re-elected.
Managers in both public and private sector enterprises are subject to political pressure, according to a model developed by (Shleifer & Vishny, 1994). There are three participants in their model: the Treasury, a politician, and a corporate manager. They claim that politicians can bribe or use their influence to sway the decisions of public firm managers to further their political goals. These political goals may include providing low-interest loans to companies with close ties to the government. Government involvement in the banking industry, for whatever reason, have an impact on bank lending behavior. Because of government oversight, these actions will have a greater impact on public banks. As a result, public banks are required to lend more money to less profitable or riskier projects. They're also expected to lend money to companies with ties to the government. There will be a surge in the usage of public banks for political purposes around elections, which will boost the growth rate of public bank loans more than that of other banks.
Government ownership in Italy, a developed country with a significant share of state-owned banks, affected bank lending behavior, according to Sapienza (2004), who used individual loan contract data from over 50,000 enterprises operating in Italy over the years 1991-1995 to analyze the issue. Controlling for firm and bank characteristics as well as local market structure, she discovered that public banks grant loans at lower interest rates than private banks. Smaller businesses in Southern Italy, like hers, can secure loans at reduced interest rates because they're located in the region.
When it came to lending during elections, Dinç (2005) looked at the conduct of banks in 36 countries, including 19 emerging markets and 17 developed ones. The years 1994 to 2000 were used, and his sample contained the ten largest banks in each country. He discovered that only in emerging nations do public banks significantly boost their lending during election years, but in industrialized countries there was no discernible difference in the loan growth rates of public and private banks. To summarize, these investigations reveal that public banks' lending practices are influenced by political factors. During elections, public bank lending increases in developing countries. None of the studies looked at how foreign banks lent money during an election season.
It was discovered by Bertay et al. (2015) that banks' loan growth rates cycle with GDP per capita growth rates. They looked at 111 countries during a 12-year period, from 1999 to 2010. They discovered that public bank loan growth is less cyclical than private bank growth. Both the GDP deflator-adjusted credit growth rate and the credit growth rate in real USD were used to calculate the credit growth rate. They used the growth rate of GDP per capita rather than the GDP growth rate as a gauge of the business cycle. In periods of negative GDP growth, the loan growth rate of public banks was higher than the loan growth rate of private banks.
To summarize, research shows that public banks' lending decisions are influenced by political factors. Public banks provide better terms for politically connected enterprises, and political use of public banks grows during election seasons, when the loan growth rate of public banks is higher than that of other banks in the market Public bank loan growth is also less pro-cyclical than private bank loan growth. During recessions and periods of low GDP growth, public banks tend to increase their lending.
Empirical Models and Data
Empirical models: This there are two parts to this section. It begins with an explanation of how different types of banks were classified according to ownership (public, private, and foreign) and deposit collection ability (deposit or non-deposit) during Turkey's most recent presidential election, and how that affected lending decisions. To find out whether there's a connection between loan growth and GDP, the second section delves into the model.
Model for Lending Behavior during Election Periods
To find out if the hypothesis is correct, we test it. When other parameters are held constant, the loan growth rate of public banks (deposit and non-deposit banks) is larger than the loan growth rate of private banks in Turkey. This hypothesis is based on the literature that Public banks may be utilized for political purposes. A political party's ability to boost its prospects of winning an election depends on the outcome of elections.
The following model is developed:
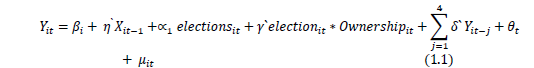
 represents loan growth rate of bank i in period t,
 indicates bank fixed effects,
 represents time dummy variables,
  includes control variables related to bank characteristics, i.e. size, capital ratio, liquidity, ROA, net interest margin and loan loss provisions. Election and ownership are dummy variables for elections periods and type of banks respectively and
  is error term. This model additionally takes into account dummies for the different quarters to account for data that may be seasonal in nature.
If the loan amounts have changed from quarter to quarter, the growth rate is normalized by the loan amounts from the prior period. During election quarters and one quarter prior to the election, the dummy variable Election takes on the value "1" whereas otherwise it takes the value "0". This research looks at both national elections and local elections in Turkey. Both elections are projected to see an increase in the public bank loan growth rate. It's possible to test for both national and municipal elections at once.
Banks are classified according to who owns them and deposit collection activity. Deposit and non-deposit banks are the main divisions within public, private, and foreign banks. A number of dummy variables are used to represent different types of banks, such as public deposit, public non deposit, private deposit, private non deposit, foreign deposit, and foreign non-deposit. These variables are referred to as pub1, pub2 pvt1, pvt2, for1 and for 2.
Liquid assets and the size of the bank determine a bank's ability to make loans, so they are included as control variables. These variables are expected to have a positive relationship. Because banks' lending conduct affects their capital ratio, the capital ratio is a control variable with an anticipated positive vale. If you have a net interest margin, you're making money since you're generating interest on both your loans and deposits (expenses). The greater the value of this variable, the greater the return on loans will be in the long run. It will help the bank's ability to lend more in the future. We expect the value of this variable to be positive. To account for bank risk, the model includes a provision for loan loss. Bank loan growth rates will be smaller; hence a negative coefficient is projected if these provisions are significant Table 1.
| Table 1 Definition Of Variables |
|
|---|---|
| Variable | Definition |
| Loan Growth Rate: | |
| LGR | (loans in t - loans in t-1)/ loans in t-1 |
| Control variables: | |
| Size | Log (total assets) |
| Liquidity | liquid assets/total assets |
| Capital Ratio | Equity/total assets |
| ROA | Net profit/total assets |
| NI margin | Net interest margin = (Net interest income/total assets) |
| LLP | Loan loss provisions = (Loan loss provisions/ total loans) |
| Ownerships variables: | |
| Pub | Dummy variable for public banks (Both deposit and non-deposits) |
| Pub1 | Dummy variable for public deposit banks |
| Pub2 | Dummy variable for public Non-deposit(Investment) banks |
| Pvt | Dummy variable for private banks (Both deposit and non-deposits) |
| Pvt1 | Dummy variable for private deposit banks |
| Pvt2 | Dummy variable for private Non-deposit(Investment) banks |
| For | Dummy variable for foreign banks (Both deposit and non-deposits) |
| For1 | Dummy variable for foreign deposit banks |
| For2 | Dummy variable for foreign Non-deposit(Investment) banks |
| Elections Variables: | |
| Elections1q | Dummy variable for elections quarters, Takes value “1” (for elections quarter and one quarter before elections) and “0” otherwise. |
| Elections2q | Dummy variable for elections quarters, Takes value “1” (for elections quarter and two quarters before elections) and “0” otherwise. |
| Elections0q | Dummy variable for elections quarters, Takes value (for elections quarter only) and “0” otherwise. |
| GDP Variables: | |
| GDP Growth | Quarterly growth rate in GDP (calculated separately for both nominal and real GDP) |
| GDP Negative | GDP growth rate of that quarter if GDP growth rate is negative and 0 otherwise |
| GDP Positive | GDP growth rate of that quarter if GDP growth rate is positive and 0 otherwise |
A strong fourth-order autocorrelation exists among all loan growth indicators. The model has four loan growth lags to account for autocorrelation. Table 2 shows the correlation coefficients between loan growth rates and p-values (the level of significance).
| Table 2 Correlation Coefficients Of Loan Growth Rates |
||||||
|---|---|---|---|---|---|---|
| Variables | LGR1 | LGR2 | LGR3 | RLGR1 | RLGR2 | RLGR3 |
| 1st lag | 0.1557 | 0.1992 | 0.128 | 0.1214 | 0.1623 | 0.0954 |
| (0.000) | (0.000) | (0.000) | (0.000) | (0.000) | (0.000) | |
| 2nd lag | 0.1589 | 0.1915 | 0.1526 | 0.1628 | 0.1831 | 0.156 |
| (0.000) | (0.000) | (0.000) | (0.000) | (0.000) | (0.000) | |
| 3rd lag | 0.0679 | 0.0766 | 0.0503 | 0.0549 | 0.0566 | 0.038 |
| (0.007) | (0.002) | (0.045) | (0.029) | (0.022) | (0.130) | |
| 4th lag | 0.0977 | 0.0689 | 0.0808 | 0.1203 | 0.0944 | 0.1051 |
| (0.000) | (0.006) | (0.001) | (0.000) | (0.000) | (0.000) | |
Model for Lending Behavior and Business Cycle
The relationship between bank lending behavior during the business cycle is investigated using two hypotheses: H2: In Turkey, state bank lending is less pro-cyclical than private bank lending (both deposit and non-deposit). H3: Public banks' loan growth rate is larger than private banks' loan growth rate in negative GDP growth periods, all conditions being equal. Due to the high level of uncertainty in the economy, private banks are expected to reduce their lending during recessions. The government also wants to keep the economy liquid and free of capital restrictions, so it injects money into the market via loan guarantees from state banks.
In order to examine how bank lending behavior changes with GDP growth, the following model is estimated: (Behr et al., 2017).
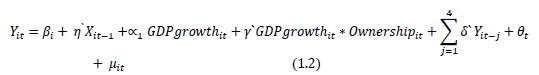
Equation 1.2 uses the same control and ownership variables as of equation 1.1. Nominal and real GDP growth rates are used to calculate GDP growth. Real GDP growth rate is utilized in the model for real loan growth rates, whereas nominal GDP growth rate is used in the model for nominal loan growth. If public banks behave less pro-cyclically than private banks, the GDP growth rate's coefficient of interaction with public banks (pub, pub1 and pub2) will be negative.
There is endogeneity between the growth rate of bank loans and the growth rate of the GDP. The endogeneity test findings and regression estimates can be found in the empirical results section. Estimates based on ordinary least squares (OLS) do not provide reliable findings as in (Behr et al., 2017).
The findings are estimated using the one-step system GMM approach rather than the OLS (2017). This strategy eliminates the bank fixed effects by using instruments based on the first difference equation.
Data
The Turkish Banking Association publishes quarterly financial statements that contain information on Turkish banks so the financial variables data is extracted from them. The study's sample span was 15 years, from December 2001 to September 2016. The sample consists of all Turkish banks except foreign banks branched that are not headquartered in Turkey. Table 3 shows the distribution of banks based on ownership and deposit collection capacity. Between 2001 and 2016, the number of banks in the sample increased from 30 to 33. The number of public banks remained the same, but foreigners bought some private banks and kept them operating as foreign banks. In 2001, there were 14 private deposit banks; by 2016, there were only 8; and in 2001, there were 4 foreign deposit banks; by 2016, there were 13 such institutions.
| Table 3 The Number Of Deposit And Non-Deposit Banks By Ownership |
|||||||
|---|---|---|---|---|---|---|---|
| Year | Pub1 | Pub2 | Pvt1 | Pvt2 | For1 | For2 | Total |
| 2001 | 3 | 3 | 14 | 4 | 4 | 2 | 30 |
| 2002 | 3 | 3 | 14 | 4 | 4 | 2 | 30 |
| 2003 | 3 | 3 | 14 | 4 | 4 | 2 | 30 |
| 2004 | 3 | 3 | 14 | 4 | 4 | 2 | 30 |
| 2005 | 3 | 3 | 14 | 4 | 4 | 2 | 30 |
| 2006 | 3 | 3 | 12 | 4 | 6 | 2 | 30 |
| 2007 | 3 | 3 | 10 | 4 | 8 | 2 | 30 |
| 2008 | 3 | 3 | 10 | 4 | 8 | 2 | 30 |
| 2009 | 3 | 3 | 10 | 4 | 8 | 2 | 30 |
| 2010 | 3 | 3 | 10 | 4 | 8 | 2 | 30 |
| 2011 | 3 | 3 | 10 | 4 | 8 | 2 | 30 |
| 2012 | 3 | 3 | 11 | 4 | 8 | 2 | 31 |
| 2013 | 3 | 3 | 10 | 4 | 10 | 2 | 32 |
| 2014 | 3 | 3 | 10 | 4 | 11 | 2 | 33 |
| 2015 | 3 | 3 | 8 | 4 | 13 | 2 | 33 |
| 2016 | 3 | 3 | 8 | 4 | 13 | 2 | 33 |
All banks' descriptive statistics for 2001-2016 are shown in Table 4. Loan growth rates are at extremes. The arrival of new banks into the Turkish banking system, as well as mergers and acquisitions, can account for some of these values. The sample is winsorized at 2% utilizing the loan growth rate in order to generate meaningful results. The average LGR value is 0.078, with a standard deviation of 0.12 found. TL billions represents the total assets of Turkish banks. In the sample, the mean value of assets is 30.215 trillion TL, while the median value is 5.613 trillion TL. There is a wide range of capital ratio values from 0.213 on the mean to 0.955 on the extreme. Non-deposit banks tend to have high capital ratios. There are a wide range of liquidity ratios, with a mean of 0.329 but some extremely high or low values. In the fourth quarter of 2001, during the crisis, Halk bank (a public deposit bank) had loan loss provisions with a maximum value of 1.315.
| Table 4 Descriptive Statistics Of Variables |
||||||
|---|---|---|---|---|---|---|
| Variables | Mean | Median | S.D | Min. | Max. | N |
| LGR | 0.078 | 0.061 | 0.120 | -0.333 | 0.695 | 1719 |
| Assets | 30.215 | 5.613 | 54.635 | 0.005 | 329.749 | 1789 |
| Capital ratio | 0.213 | 0.126 | 0.202 | -0.033 | 0.955 | 1789 |
| Liquidity | 0.329 | 0.311 | 0.176 | 0.000 | 0.904 | 1789 |
| ROA | 0.007 | 0.008 | 0.033 | -0.415 | 0.229 | 1789 |
| NI margin | 0.034 | 0.027 | 0.038 | -0.042 | 0.714 | 1789 |
| LLP | 0.018 | 0.008 | 0.055 | 0.000 | 1.315 | 1755 |
Empirical Results
There are two parts to this chapter. The first part of the paper examines data on how different types of banks behave when it comes to lending during an election. The findings on the cyclicality of bank lending behavior during business cycles are discussed in the second section.
Regression Results: Lending Behavior of Banks during Elections
The regression results are shown in Table 5 for bank lending behavior by ownership (public, private, and foreign), the dependent variable is the LGR,. First two columns of table provide the results of all elections (including general and local) held in turkey, while the third and fourth columns only show the results of general elections, and the fifth and sixth columns show the estimated coefficients for the model that only includes local elections. According to equation 4.1, all banks' control variables are in t-1. Since private banks are used as a baseline, the election-related coefficients presented in the odd-numbered columns (1,3 and 5) are relative to private banks. In the columns with even numbers (2,4 and 6), election coefficients are expressed in comparison to non-election periods. Possible heterogeneity is shown in parenthesis and adjusted with robust standard errors. The R-squared (coefficient of determination) for all six models is almost 27%, indicating that the model accounts for more than a fourth of the variability in the loan growth rate. There is no discernible difference between the growth rates of public and private bank loans, according to the research.
| Table 5 Lending Behavior Of Banks By Ownership Types During Elections Dependent Variable: Lgr |
||||||
|---|---|---|---|---|---|---|
| Dependent | (1) | (2) | (3) | (4) | (5) | (6) |
| variable: LGR | All Elections | All Elections | General Elections | General Elections | Local Elections | Local Elections |
| Elections1q | 0.0403** | 0.0444*** | 0.0706* | |||
| (0.0163) | (0.0166) | (0.0410) | ||||
| Elections1qxpub | 0.0328*** | 0.0732*** | -0.000220 | 0.0442*** | 0.0653*** | 0.136*** |
| (0.0122) | (0.0170) | (0.0134) | (0.0165) | (0.0196) | (0.0406) | |
| Elections1qxpvt | 0.0403** | 0.0444*** | 0.0706* | |||
| (0.0163) | (0.0166) | (0.0410) | ||||
| Elections1qxfor | 0.00355 | 0.0439*** | 0.00929 | 0.0537*** | -0.00912 | 0.0615 |
| (0.0124) | (0.0162) | (0.0141) | (0.0162) | (0.0184) | (0.0408) | |
| Pub | -0.00618 | -0.00618 | 0.00139 | 0.00139 | -0.00528 | -0.00528 |
| (0.0108) | (0.0108) | (0.0107) | (0.0107) | (0.0107) | (0.0107) | |
| For | -0.0187 | -0.0187 | -0.0205* | -0.0205* | -0.0178 | -0.0178 |
| (0.0114) | (0.0114) | (0.0112) | (0.0112) | (0.0110) | (0.0110) | |
| L1.Size | -0.0354*** | -0.0354*** | -0.0362*** | -0.0362*** | -0.0359*** | -0.035*** |
| (0.0116) | (0.0116) | (0.0117) | (0.0117) | (0.0116) | (0.0116) | |
| L1.Capital ratio | -0.0151 | -0.0151 | -0.0197 | -0.0197 | -0.0142 | -0.0142 |
| (0.0492) | (0.0492) | (0.0496) | (0.0496) | (0.0488) | (0.0488) | |
| L1.Liquidity | 0.165*** | 0.165*** | 0.160*** | 0.160*** | 0.162*** | 0.162*** |
| (0.0365) | (0.0365) | (0.0364) | (0.0364) | (0.0362) | (0.0362) | |
| L1.ROA | 0.204 | 0.204 | 0.185 | 0.185 | 0.217 | 0.217 |
| (0.195) | (0.195) | (0.198) | (0.198) | (0.194) | (0.194) | |
| L1.NI margin | -0.408 | -0.408 | -0.380 | -0.380 | -0.464* | -0.464* |
| (0.248) | (0.248) | (0.249) | (0.249) | (0.253) | (0.253) | |
| L1.LLP | 0.103 | 0.103 | 0.111 | 0.111 | 0.0775 | 0.0775 |
| (0.152) | (0.152) | (0.155) | (0.155) | (0.149) | (0.149) | |
| L1.LGR1 | 0.0579 | 0.0579 | 0.0599 | 0.0599 | 0.0541 | 0.0541 |
| (0.0428) | (0.0428) | (0.0427) | (0.0427) | (0.0429) | (0.0429) | |
| L2.LGR1 | 0.128*** | 0.128*** | 0.129*** | 0.129*** | 0.126*** | 0.126*** |
| (0.0402) | (0.0402) | (0.0403) | (0.0403) | (0.0401) | (0.0401) | |
| L3.LGR1 | 0.0200 | 0.0200 | 0.0200 | 0.0200 | 0.0203 | 0.0203 |
| (0.0357) | (0.0357) | (0.0358) | (0.0358) | (0.0355) | (0.0355) | |
| L4.LGR1 | 0.0614* | 0.0614* | 0.0598* | 0.0598* | 0.0643** | 0.0643** |
| (0.0318) | (0.0318) | (0.0318) | (0.0318) | (0.0317) | (0.0317) | |
| Constant | 0.804*** | 0.804*** | 0.822*** | 0.822*** | 0.822*** | 0.822*** |
| (0.277) | (0.277) | (0.279) | (0.279) | (0.277) | (0.277) | |
| Observations | 1,498 | 1,498 | 1,498 | 1,498 | 1,498 | 1,498 |
| R-squared | 0.266 | 0.266 | 0.263 | 0.263 | 0.271 | 0.271 |
| Bank and Time Fixed Effects | YES | YES | YES | YES | YES | YES |
*** Elections1q is a dummy variable that takes a value of 1 for elections quarter and one quarter before elections.
*, ** and *** represent significance at 10%, 5% and 1% levels of confidence respectively.
Loan growth is 4.03% higher during election quarters (general and local) than during non-election quarters. When the election variable interacts with public banks, the loan growth rate of public banks is 3.28 % higher than the growth rate of private banks. It appears that public banks lend more during election years than do private ones, based on these findings. Column (2) shows that during election periods, public bank loan growth rates are 7.32% higher than non-election periods, while private bank loan growth rates are 4.03% higher and foreign bank loan growth rates are 4.39% higher.
Loan growth is 4.44% higher during general election quarters than during non-election times. During general elections, however, there is no discernible difference in the rate of loan growth between public and private banks. Private and international banks' loan growth rates are 4.44% and 5.37% higher during general elections, respectively. When using the general election model, the data show that there is little difference between loan growth at public and private banks, which means that hypothesis is wrong. Bank loan growth rates are 7.06% higher during local elections than during other times, which is significant at a 10-% confidence level. Local election quarters see public bank loan growth be 6.53% greater than private bank loan growth, with public bank loan growth being 13.6 % higher than other periods. These findings also support the initial concept.
During the years 2001-2015, local elections in Turkey took place at least a year following national ones. General elections were held in 2002, and local elections were held in 2003. These findings show that a political party that has won the general elections may use political power in local elections by utilizing public bank resources and increasing their loan provisions above those of other banks more than they would otherwise. In addition, Önder & Özy?ld?r?m, (2013) back up these findings For the years 1992-2010, they discovered that in Turkey, state banks' credit shares rose during municipal elections.
During local elections, public banks' loan growth rates rise, as do those found by (Dinç, 2005; Micco et al., 2007; Iannotta et al., 2013). A number of studies have revealed similar outcomes for developing economies such as Dinç (2005) and Micco et al. (2007) as well as a sample of 16 European countries such as (Iannotta et al., 2013). Which included developed countries as well. General elections were studied by Dinç (2005) and (Iannotta et al., 2013; Khwaja & Mian, 2005; Koch et al., 2001), however (Micco et al., 2007; Debrun et al., 2005; Önder & Özy?ld?r?m, 2013; Özatay et al., 2002) did not specify which types of elections they looked at.
When it comes to controlling variables like capital ratios and loan loss provisions (LLP), the results demonstrate that liquid assets have a positive and significant impact on loan growth, whereas capital ratios and ROA have no effect. Sizing is found to be detrimental, with smaller banks experiencing greater loan growth rates Table 5.
| Table 6 Lending Behavior Of Banks By Ownership And Deposit Collecting Ability During Elections, Dependent Variable: Lgr |
||||||
|---|---|---|---|---|---|---|
| (1) | (2) | (3) | (4) | (5) | (6) | |
| Dependent variable: LGR | All Elections | All Elections | General Elections | General Elections | Local Elections | Local Elections |
| Elections1q | 0.0275* | 0.0365** | 0.0503 | |||
| (0.0162) | (0.0159) | (0.0424) | ||||
| Elections1qxpub1 | 0.0333*** | 0.0608*** | 0.00451 | 0.0410** | 0.0593*** | 0.110*** |
| (0.0120) | (0.0174) | (0.0114) | (0.0168) | (0.0201) | (0.0411) | |
| Elections1qxpub2 | 0.0565*** | 0.0840*** | 0.0106 | 0.0471** | 0.0991*** | 0.149*** |
| (0.0163) | (0.0202) | (0.0151) | (0.0197) | (0.0272) | (0.0451) | |
| Elections1qxpvt1 | 0.0275* | 0.0365** | 0.0503 | |||
| (0.0162) | (0.0159) | (0.0424) | ||||
| Elections1qxpvt2 | 0.0539* | 0.0815*** | 0.0325 | 0.0689* | 0.0691* | 0.119** |
| (0.0297) | (0.0305) | (0.0379) | (0.0373) | (0.0418) | (0.0516) | |
| Elections1qxfor1 | 0.0144 | 0.0419*** | 0.0160 | 0.0525*** | 0.00390 | 0.0542 |
| (0.0113) | (0.0162) | (0.0113) | (0.0162) | (0.0185) | (0.0412) | |
| Elections1qxfor2 | 0.0309 | 0.0584 | 0.0271 | 0.0636 | 0.0186 | 0.0690 |
| (0.0376) | (0.0390) | (0.0437) | (0.0449) | (0.0433) | (0.0589) | |
| Pub1 | -0.00627 | -0.00627 | 0.000803 | 0.000803 | -0.00495 | -0.00495 |
| (0.0107) | (0.0107) | (0.0109) | (0.0109) | (0.0105) | (0.0105) | |
| Pub2 | -0.126*** | -0.126*** | -0.116** | -0.116** | -0.122*** | -0.12*** |
| (0.0462) | (0.0462) | (0.0468) | (0.0468) | (0.0463) | (0.0463) | |
| Pvt2 | -0.085*** | -0.085*** | -0.080** | -0.0807** | -0.0800** | -0.080** |
| (0.0328) | (0.0328) | (0.0336) | (0.0336) | (0.0317) | (0.0317) | |
| For1 | -0.0199* | -0.0199* | -0.0210* | -0.0210* | -0.0182* | -0.0182* |
| (0.0113) | (0.0113) | (0.0111) | (0.0111) | (0.0110) | (0.0110) | |
| For2 | -0.266** | -0.266** | -0.268** | -0.268** | -0.264** | -0.264** |
| (0.111) | (0.111) | (0.112) | (0.112) | (0.112) | (0.112) | |
| L1.Size | -0.0347*** | -0.0347*** | -0.036*** | -0.0362*** | -0.0353*** | -0.035*** |
| (0.0115) | (0.0115) | (0.0117) | (0.0117) | (0.0116) | (0.0116) | |
| L1.Capital ratio | -0.00267 | -0.00267 | -0.0158 | -0.0158 | -0.00814 | -0.00814 |
| (0.0489) | (0.0489) | (0.0495) | (0.0495) | (0.0485) | (0.0485) | |
| L1.Liquidity | 0.156*** | 0.156*** | 0.157*** | 0.157*** | 0.158*** | 0.158*** |
| (0.0360) | (0.0360) | (0.0363) | (0.0363) | (0.0359) | (0.0359) | |
| L1.ROA | 0.230 | 0.230 | 0.185 | 0.185 | 0.254 | 0.254 |
| (0.194) | (0.194) | (0.198) | (0.198) | (0.196) | (0.196) | |
| L1.NI margin | -0.467* | -0.467* | -0.363 | -0.363 | -0.584** | -0.584** |
| (0.244) | (0.244) | (0.248) | (0.248) | (0.254) | (0.254) | |
| L1.LLP | 0.113 | 0.113 | 0.109 | 0.109 | 0.101 | 0.101 |
| (0.152) | (0.152) | (0.155) | (0.155) | (0.151) | (0.151) | |
| L1.LGR1 | 0.0537 | 0.0537 | 0.0580 | 0.0580 | 0.0530 | 0.0530 |
| (0.0430) | (0.0430) | (0.0429) | (0.0429) | (0.0430) | (0.0430) | |
| L2.LGR1 | 0.128*** | 0.128*** | 0.128*** | 0.128*** | 0.128*** | 0.128*** |
| (0.0403) | (0.0403) | (0.0406) | (0.0406) | (0.0400) | (0.0400) | |
| L3.LGR1 | 0.0224 | 0.0224 | 0.0205 | 0.0205 | 0.0221 | 0.0221 |
| (0.0358) | (0.0358) | (0.0359) | (0.0359) | (0.0355) | (0.0355) | |
| L4.LGR1 | 0.0640** | 0.0640** | 0.0611* | 0.0611* | 0.0647** | 0.0647** |
| (0.0317) | (0.0317) | (0.0319) | (0.0319) | (0.0316) | (0.0316) | |
| Constant | 0.797*** | 0.797*** | 0.821*** | 0.821*** | 0.818*** | 0.818*** |
| (0.275) | (0.275) | (0.279) | (0.279) | (0.277) | (0.277) | |
| Observations | 1,498 | 1,498 | 1,498 | 1,498 | 1,498 | 1,498 |
| R-squared | 0.271 | 0.271 | 0.264 | 0.264 | 0.275 | 0.275 |
| Bank and Time Fixed Effects | YES | YES | YES | YES | YES | YES |
*** Elections1q is a dummy variable that takes a value of 1 for elections quarter and one quarter before elections.
*, ** and *** represent significance at 10%, 5% and 1% levels of confidence respectively.
In Table 6, the results of banks' lending activity are shown in detail. There are six different types of banks. Deposit banks and non-deposit banks are the two main categories of banks.
Public deposit banks and private deposit banks both have similar loan growth rates, while all other types of banks' loan growth rates are much lower than private deposit banks. There is a 12.6% difference between public and private non-deposit banks, an 8.6% difference between foreign deposit banks and a 2.6% difference between foreign non-deposit banks when adjusting for bank characteristics, time, and fixed effects at the foreign non-deposit banks..
Loan growth is 2.75% greater in election quarters than in non-election quarters during general and municipal elections. Public deposit banks' loan growth rates are 3.33% higher during election seasons than private deposit banks'. While the loan growth rates of public and private non-deposit banks are significantly higher during election periods than the loan growth rate of private deposit banks, the difference between the loan growth rates of foreign and private deposit banks is not significant. is 5.65% and 5.39%, respectively According to these findings, state banks (deposit and non-deposit) boost lending more than private deposit banks during election periods. All types of banks, except international non-deposit banks, have loan growth rates that are higher during elections than other times (IMF, 1999).
Borrowing increases at a 3.65% annual rate during election years. Similar to the coefficients discovered in Table 5, loan growth rates are significantly higher during general elections for all categories of banks except international non-deposit banks. According to the general election results, the first hypothesis is unfounded.
Bank loan growth rates during local elections are similar to their growth rates outside of local elections. However, the loan growth rates of public deposit banks, both deposit and non-deposit, are much higher than the private deposit banks. There is evidence to suggest that in local election quarters, public deposit banks have a 5.93% greater loan growth rate than private deposit banks, and non-deposit public banks have a 9.91% higher loan growth rate than private deposit banks. Local elections see greater loan growth rates from public deposit and non-deposit banks by 11.0% and 14.9%, respectively. For private non-deposit banks, the consequences are the same. Table 6 presents results on control variables that are very comparable to those found here.
Regression Results: Lending behavior with GDP Growth Rate
Various types of banks' loan growth rates and GDP growth rates are reviewed in this section. A nominal Loan Growth Rate (LGR) is used as the dependent variable in Table 7. In the first column, the results of the Hausman test for endogeneity are shown.. This study's chi-square statistic is significant at a 1% level of confidence, which indicates that endogeneity exists. One-step GMM technique outcomes are summarized in tables.
| Table 7 Lending Behavior Of Banks By Ownership During Business Cycles Dependent Variable: Lgr |
||
|---|---|---|
| Dependent variable: LGR | (1) | (2) |
| GDP Growth | 0.461*** | |
| (0.117) | ||
| L1. GDP Growth | 0.666*** | |
| (0.198) | ||
| GDP Growth x Pub | -0.377* | |
| (0.203) | ||
| L1.GDP Growth x Pub | -0.540* | |
| (0.265) | ||
| GDP Growth x for | -0.212 | |
| (0.229) | ||
| L1.GDP Growth x for | 0.133 | |
| (0.281) | ||
| Pub | 0.00353 | 0.00859 |
| (0.0125) | (0.0155) | |
| For | 0.00104 | -0.00987 |
| (0.00962) | (0.0138) | |
| L1.Size | -0.00348 | -0.00313 |
| (0.00209) | (0.00216) | |
| L1.Capital ratio | 0.0415 | 0.0445 |
| (0.0326) | (0.0327) | |
| L1.Liquidity | 0.171*** | 0.172*** |
| (0.0429) | (0.0435) | |
| L1.ROA | 0.259 | 0.239 |
| (0.260) | (0.261) | |
| L1.NI margin | -0.196 | -0.154 |
| (0.248) | (0.259) | |
| L1.LLP | 0.0159 | 0.0562 |
| (0.120) | (0.123) | |
| L1.LGR1 | 0.0105 | 0.0228 |
| (0.0551) | (0.0532) | |
| L2.LGR1 | 0.102** | 0.00761 |
| (0.0424) | (0.0535) | |
| L3.LGR1 | 0.0507 | 0.0999** |
| (0.0514) | (0.0404) | |
| L4.LGR1 | 0.0184 | 0.0305 |
| (0.0564) | (0.0485) | |
| Constant | 0.0515 | 0.0706 |
| (0.0525) | (0.0528) | |
| Observations | 1,498 | 1,498 |
| Time FE | Yes | Yes |
| Bank FE | No | No |
| Hausman test for endogeneity | 25.94*** | |
| Number of instruments | 319 | 319 |
| AR(1) | 0.000 | 0.000 |
| AR(2) | 0.115 | 0.287 |
| AR(3) | 0.583 | 0.950 |
| Hansen Test | 1.73 | 4.82 |
| p-value | 1.000 | 1.000 |
| Wald test p-value (GDP+GDPxpub=0) | 0.6231 | 0.5004 |
| (GDP+GDPxfor=0) | 0.1165 | 0.004 |
Growth in GDP and loan growth rates are found to be positively and significantly related. This shows that as GDP grows, so does the loan growth rate of banks (coefficient = 0.461). The coefficient of "GDP Growth * Pub" was likewise determined to be -0.377. In other words, public banks' loan growth is less cyclical than private banks'. These findings confirm the cyclicality of public bank loan growth rates.
Column 2 shows the outcomes of using GDP growth rates with lags in the model. According to the findings, public banks are less pro-cyclical than previously thought. Both estimates have a very small combined coefficient for public banks. It implies that the lending of public banks does not alter considerably with the increase of the GDP. Foreign banks' combined coefficient is determined to be important. If GDP growth rates improve by 1% in the previous quarter, foreign banks will boost their lending by 8%, but state lending will only increase by 13%.
The second theory is supported by public banks' less pro-cyclical behavior. These results are similar to those of German public saving institutions despite Turkish public banks having much lower coefficients (Behr et al., 2017). Although the combined coefficient is small, Turkish banks are not immune to it. Because of the one-step GMM method's use of first difference equations and elimination of bank fixed effects, the results should be taken with care. These models take only a few bank factors into consideration.
Nominal Loan Growth Rate (LGR) is used as a dependent variable in Table 8 to show the results of bank lending behavior based on ownership and deposit collection ability. If the GDP growth rate increases in the current or preceding quarter, the loan growth rate of banks will rise as well, showing that the GDP growth rate is a major and positive coefficient. Compared to private banks, the lending of public deposit banks is less pro-cyclical, with a coefficient of interaction of "GDP Growth*Pub1" shown to be insignificant in the first column but negative and significant in the second. There is a negative and substantial "GDP Growth*Pub2" coefficient in both columns, suggesting that the loan growth rate of public non-deposit banks is less pro-cyclical than that of private deposit institutions. Private and international non-deposit banks' loan growth rates are found to be less pro-cyclical than private deposit banks'.
| Table 8 Lending Behavior Of Deposit And Non-Deposit Banks By Ownership During Business Cycles, Dependent Variable: Lgr |
||
|---|---|---|
| Dependent variable:LGR | (1) | (2) |
| GDP Growth | 0.443*** | |
| (0.130) | ||
| L1.GDP Growth | 0.913*** | |
| (0.173) | ||
| GDP GrowthxPub1 | -0.114 | |
| (0.225) | ||
| L1.GDP GrowthxPub1 | -0.405** | |
| (0.174) | ||
| GDP GrowthxPub2 | -0.545** | |
| (0.219) | ||
| L1.GDP GrowthxPub2 | -1.100*** | |
| (0.175) | ||
| GDP GrowthxPvt2 | 0.129 | |
| (0.299) | ||
| L1.GDP GrowthxPvt2 | -1.165** | |
| (0.559) | ||
| GDP Growthxfor1 | -0.136 | |
| (0.239) | ||
| L1.GDP Growthxfor1 | 0.0213 | |
| (0.245) | ||
| GDP Growthxfor2 | -0.353* | |
| (0.205) | ||
| L1.GDP Growthxfor2 | -0.998*** | |
| (0.222) | ||
| Pub1 | -0.00439 | 0.00546 |
| (0.00953) | (0.0109) | |
| Pub2 | 0.00816 | 0.0254 |
| (0.0221) | (0.0205) | |
| Pvt2 | -0.00978 | 0.0316 |
| (0.0237) | (0.0281) | |
| for1 | -0.00330 | -0.00787 |
| (0.00870) | (0.0124) | |
| for2 | 0.00966 | 0.0276** |
| (0.0114) | (0.0103) | |
| L1.Size | -0.00362** | -0.00338* |
| (0.00175) | (0.00179) | |
| L1.Capital ratio | 0.0435 | 0.0465 |
| (0.0372) | (0.0388) | |
| L1.Liquidity | 0.159*** | 0.158*** |
| (0.0420) | (0.0416) | |
| L1.ROA | 0.278 | 0.231 |
| (0.292) | (0.281) | |
| L1.NI margin | -0.324 | -0.234 |
| (0.254) | (0.248) | |
| L1.LLP | 0.0518 | 0.0841 |
| (0.127) | (0.120) | |
| L1.LGR1 | 0.0387 | 0.0339 |
| (0.0507) | (0.0495) | |
| L2.LGR1 | 0.131*** | 0.127*** |
| (0.0402) | (0.0386) | |
| L3.LGR1 | 0.0566 | 0.0400 |
| (0.0437) | (0.0423) | |
| L4.LGR1 | 0.0253 | 0.0600 |
| (0.0414) | (0.0590) | |
| Constant | 0.0455 | 0.00904 |
| (0.0546) | (0.0590) | |
| Observations | 1,498 | 1,498 |
| Time FE | Yes | Yes |
| Bank FE | No | No |
| Hausman test for endogeneity | 29.57*** | |
| Number of instruments | 479 | 479 |
| AR(1) | 0.000 | 0.000 |
| AR(2) | 0.124 | 0.267 |
| AR(3) | 0.665 | 0.828 |
| Hansen Test | 0.00 | 0.00 |
| P-value | 1.000 | 1.000 |
| Wald (GDP+GDPxpub1=0) | 0.0904 | 0.000 |
| Wald (GDP+GDPxpub2=0) | 0.5976 | 0.2234 |
| Wald (GDP+GDPxpvt2=0) | 0.0394 | 0.6211 |
| Wald (GDP+GDPxfor1=0) | 0.0574 | 0.000 |
| Wald (GDP+GDPxfor2=0) | 0.5661 | 0.6782 |
Coefficients derived from public deposit banks reveal that public deposit banks lend in a way that promotes cyclicality. Public deposit banks raise their lending by 0.3 % when GDP growth rate rises by 1 % in the current period, while public non-deposit banks decrease lending by 0.1 %. With a negative combined coefficient, lending is countercyclical but small for the public nondeposit sector. This shows that foreign deposit banks lend pro-cyclically, as the combined coefficient in both columns is positive and substantial (Fungá?ová et al., 2013).
Conclusion
In this research, we look at the lending patterns of different types of Turkish banks throughout general and local election seasons, and how those patterns vary as the country's GDP increases. The ability of a bank to collect deposits determines its classification. While the loan growth rate of Turkish public banks is much larger than the rate of Turkish private banks during local election times, there is no discernible difference between the two during national elections, according to the study results.
The results of the local elections are in line with previous research showing that public banks in developing nations have a higher loan growth rate than private banks. Since no substantial difference is detected in the lending activity of public and private banks during general elections, the findings about bank lending behavior are comparable with those for developed nations.
Loan growth is stronger during general elections than other times, except for overseas non-deposit banks. The political climate is more tumultuous during presidential campaigns than during local elections. Turkish general elections have been won over the last fifteen years by the same party, indicating less political uncertainty. During general elections, the government may offer incentives to all banks, not just public ones, in order to spur loan growth and level the playing field. The fight between political parties is fiercer in local elections, though. There is evidence to imply that public banks may enhance their lending growth for political reasons when compared to private banks.
Although the loan growth rate of public banks is less pro-cyclical than that of private banks, public deposit banks engage in lending conduct that is pro-cyclical. For German public saving banks, these findings are identical to those of Behr. Public non-deposit banks, on the other hand, aren't shown to be cyclical in their behavior.
References
Behr, P., Foos, D., & Norden, L. (2017). Cyclicality of SME lending and government involvement in banks.Journal of Banking & Finance,77, 64-77.
Indexed at, Google Scholar, Cross Ref
Bertay, A.C., Demirgüç-Kunt, A., & Huizinga, H. (2015). Bank ownership and credit over the business cycle: Is lending by state banks less procyclical?.Journal of Banking & Finance,50, 326-339.
Indexed at, Google Scholar, Cross Ref
Brei, M., & Schclarek, A. (2013). Public bank lending in times of crisis.Journal of financial stability,9(4), 820-830.
Indexed at, Google Scholar, Cross Ref
Brei, M., & Schclarek, A. (2015). A theoretical model of bank lending: Does ownership matter in times of crisis?.Journal of Banking & Finance,50, 298-307.
Indexed at, Google Scholar, Cross Ref
BRSA, (2009). From Crisis to Financial Stability: Turkey Experience.
Carvalho, D. (2014). The real effects of government-owned banks: Evidence from an emerging market.The Journal of Finance,69(2), 577-609.
Indexed at, Google Scholar, Cross Ref
Chen, Y.S., Shen, C.H., & Lin, C.Y. (2014). The benefits of political connection: Evidence from individual bank-loan contracts.Journal of Financial Services Research,45(3), 287-305.
Indexed at, Google Scholar, Cross Ref
Cull, R., & Peria, M.S.M. (2013). Bank ownership and lending patterns during the 2008–2009 financial crisis: Evidence from Latin America and Eastern Europe.Journal of Banking & Finance,37(12), 4861-4878.
Indexed at, Google Scholar, Cross Ref
Debrun, M.X., Mody, M.A., Celasun, O., Schindler, M.M., Lim, C.H., Lane, M.C., & Moghadam, M.R. (2005). Turkey at the crossroads: from crisis resolution to EU accession.
Indexed at, Google Scholar, Cross Ref
Dinç, I.S. (2005). Politicians and banks: Political influences on government-owned banks in emerging markets.Journal of Financial Economics,77(2), 453-479.
Indexed at, Google Scholar, Cross Ref
Fungácová, Z., Herrala, R., & Weill, L. (2013). The influence of bank ownership on credit supply: Evidence from the recent financial crisis.Emerging Markets Review,15, 136-147.
Indexed at, Google Scholar, Cross Ref
Gerschenkron, A. (2015). Economic backwardness in historical perspective (1962).Cambridge MA.
Iannotta, G., Nocera, G., & Sironi, A. (2013). The impact of government ownership on bank risk.Journal of Financial Intermediation,22(2), 152-176.
Indexed at, Google Scholar, Cross Ref
IMF. (1999). Turkey Letter of Intent.
Khwaja, A.I., & Mian, A. (2005). Do lenders favor politically connected firms? Rent provision in an emerging financial market.The Quarterly Journal of Economics,120(4), 1371-1411.
Indexed at, Google Scholar, Cross Ref
Koch, L., Chaudhary, M.A., & Bilquees, F. (2001). February 2001 Crisis in Turkey: Causes and Consequences [with Comments].The Pakistan Development Review, 467-486.
La Porta, R., Lopez-de-Silanes, F., & Shleifer, A. (2002). Government ownership of banks.The Journal of Finance,57(1), 265-301.
Indexed at, Google Scholar, Cross Ref
Lewis, W.A. (2003).The principles of economic planning. Psychology Press.Macovei,
Macovei, M. (2009). Growth and economic crises in Turkey: leaving behind a turbulent past?. Directorate General Economic and Financial Affairs (DG ECFIN), European Commission.
McGettigan, D. (2005). Country Study. Turkey.IMF Research Bulletin.
Meriläinen, J.M. (2016). Lending growth during the financial crisis and the sovereign debt crisis: The role of bank ownership type.Journal of International Financial Markets, Institutions and Money,41, 168-182.
Indexed at, Google Scholar, Cross Ref
Micco, A., & Panizza, U. (2006). Bank ownership and lending behavior.Economics letters,93(2), 248-254.
Indexed at, Google Scholar, Cross Ref
Micco, A., Panizza, U., & Yanez, M. (2007). Bank ownership and performance. Does politics matter?.Journal of Banking & Finance,31(1), 219-241.
Indexed at, Google Scholar, Cross Ref
Önder, Z., & Özyildirim, S. (2013). Role of bank credit on local growth: Do politics and crisis matter?.Journal of Financial Stability,9(1), 13-25.
Indexed at, Google Scholar, Cross Ref
Özatay, F., Sak, G., Garber, P., & Ghosh, A. (2002). Banking sector fragility and Turkey's 2000-01 financial crisis [with comments and discussion]. InBrookings Trade Forum.(121-172). Brookings Institution Press.
Sapienza, P. (2004). The effects of government ownership on bank lending.Journal of Financial Economics,72(2), 357-384.
Indexed at, Google Scholar, Cross Ref
Shleifer, A., & Vishny, R.W. (1994). Politicians and firms. The Quarterly Journal of Economics,109(4), 995-1025.
Indexed at, Google Scholar, Cross Ref
Stiglitz, J.E. (1993). The role of the state in financial markets.The World Bank Economic Review,7(suppl_1), 19-52.
Indexed at, Google Scholar, Cross Ref
Received: 12-Apr-2022, Manuscript No. AAFSJ-22-11751; Editor assigned: 14-Apr-2022, PreQC No. AAFSJ-22-11751(PQ); Reviewed: 21-Apr-2022, QC No. AAFSJ-22-11751; Revised: 14-Jun-2022, Manuscript No. AAFSJ-22-11751(R); Published: 21-Jun-2022