Research Article: 2020 Vol: 24 Issue: 1
Liquidity Creation and Competition in the Banking Industry Pre and Post Arab Spring in MENA Region
Nagea Abraheem, Universiti Putra Malaysia
M.H. Yahya, Universiti Putra Malaysia
Junaina Muhammad, Universiti Putra Malaysia
Nazrul Hisyam Ab Razak, Universiti Putra Malaysia
Abstract
Competition is one of the determinants that influences banks’ liquidity creation. Political transitions in the MENA region have affected many aspects of the region, including its economy. The banking sector, being a crucial element in the financial system, is also affected. This study aims to examine the impact of ‘competition’, ‘political risk’ and ‘stability of banking industry’ on liquidity creation, vis-a-vis political transition (i.e. Arab Spring). The ‘availability of deposit insurance system’, bank ‘type’ and ‘size’ are used as control variables in this study. The sample in this study includes 55 banks from the MENA region (i.e. Arab Saudi, Bahrain, Egypt, Jordan, Kuwait, Lebanon, and Tunisia), for the period between 2006 and 2015. This study finds that liquidity creation is negatively related to competition in the period before political transition and positively related in the period after political transition. Moreover, political risk positively influences liquidity creation for both pre and post political transition periods. However, the ‘stability of the banking industry’ and the ‘availability of deposit insurance system’ reduce liquidity creation in both periods.
Keywords
Liquidity Creation, Competition, Political Risk, Stability of Banking Industry, Arab Spring.
Introduction
Banks perform a crucial role by providing liquidity to the economy. This liquidity originates from both on-and off-balance sheets items (Bryant, 1980; Diamond & Dybvig, 1983). On balance sheet items include all assets and liabilities that appear on balance sheet. These items include assets (cash and due from banks, trading assets, loans) and liabilities (current customer deposits, savings, trading liabilities, and equity). Liquidity can also be created from off-balance sheets activities (Boot et al., 1993; Holmström &Tirole, 1998; Kashyap et al., 2002). Off balance sheet items refer to items that are on the balance sheet, such as, loan commitments, credit lines, guarantees, swaps, hedging contracts, and securities underwriting (Freixas & Rochet, 2008, Hassan, 1993).
These contingent claims or contracts that generate fee income for banks (i.e loan commitments, committed credit lines, and interest rate derivative) do not create a change in the balance sheet until the contingency is realized (Hassan, 1993). Studies on liquidity creation became an essential issue after the financial crisis and propositions by the Basel Committee which placed emphasis on bank’s solvency and liquidity creation. The introduction of new liquidity creation measurements by (Berger & Bouwman, 2009) encourages researchers to address issues related to liquidity creation. Competition is one of the main factors that play a role in fostering liquidity creation from off-balance sheet in the 1980s (Jagtiani & Khanthavit, 1996). However, even with the increase in global banking activities (Horvath et al., 2016) to satisfy consumers’ needs by providing an assortment of financial products, researches on competition and liquidity creation are still limited.
Globally, banks have the highest amount of financial assets (United nation, 2019). Their total global assets amounted to $124 trillion in 2018 (Andrew, 2019). Banks continue to be the largest source of lending. Their share of global loan assets was 81% in 2017 (Financial stability board, 2018). Previous literature have widely focused on the nexus between competition and bank’s stability with various implications for policy makers and bank’s regulators (Almarzoqi et al., 2015; Anginer et al., 2014; Beck et al., 2013; Berger et al., 2009; González et al., 2017). Competition from financial markets have contributed towards liquidity creation from off-balance sheet items. Fu et al. (2016) document that off-balance sheet items contributed to 23% of liquidity creation for the period between 2005 and 2012. However, liquidity creation from off-balance sheet items in US banks was larger and presented 50% of total liquidity creation for the period from 1993 to 2003 (Berger & Bouwman, 2009). Competition can incentivize banks to increase or decrease liquidity creation, both of which, may affect their stability (Fungacova et al., 2015), and roles. The theoretical literature concerning bank’s competition yielded two conflicting views, a) the competition-fragility Keeley (1990) view argues that competition leads to the reduction of liquidity creation and b) competition-stability view Boyd & De Nicolo (2005) suggests that the increased competition can contribute towards the improvement of liquidity creation. Previous studies related to competition and liquidity creation in the banking industry have been conducted in developed countries (Horvath et al., 2016; Jiang et al., 2019) where the competition level is exceptionally homogeneous (and for the most part is intense).
Most of these studies provide the support for the competition-fragility view (González et al., 2017). The present study differs from the previous ones because it includes the impact of competition on bank’s liquidity creation, which was scarcely studied in Middle East and North Africa (MENA) countries (Al-khouri & Arouri, 2019). In addition, this study also takes into account the effect of political transition on liquidity creation. The banking sector in the MENA region is characterized by low competition compared to other regions (Abuzayed, et al., 2012; Almarzoqi et al., 2015; González et al., 2017). It was not severely affected from the global financial crisis (2007-2008) and recovered more rapidly compared to other emerging and developing markets (Almarzoqi et al., 2015; Ianchovichina & Mottaghi, 2013).
In recent times, this region is faced with turmoil in the form of political transition (Arab Spring). The Arab Spring witnessed many government changeovers and political disruptions in the region. It began in Tunisia in 17 December 2010 and dramatically spread to the most other Arabic countries. This event led to a negative impact on the economy of the region (Devarajan et al., 2016; Finger & Gressani, 2014; Herrala et al., 2012; Rother et al., 2016; International Monetary Fund, 2016). Low competition and instability can influence banks’ behaviour (González et al., 2017). Therefore, they can influence liquidity creation. The purpose of this study is to examine the impact of ‘competition’, ‘political risk’ and ‘stability of banking industry’ on liquidity creation vis-a-vis political transition.
Literature Review
Liquidity Creation and the Competition in Banking Industry
There are two conflicting hypotheses related to competition in the banking industry; (a) competition-fragility (Keeley, 1990) and (b) competition-stability views (Boyd & De Nicolo, 2005). The competition-fragility view states that lending rate decreases as the level of competition increases. Profit margins will decrease when deposit rates increase. The main idea of the competition-fragility view is that, the motivation for banks to obtain new borrowers will decrease due to the reduction in market incentives (i.e. the lower spread between borrowing and lending) (Horvath et al., 2016). On the other hand, the competition-stability approach implies that the increase in the competition level reduces the interest rates charged by banks and increases deposit rates. Borrowers will find it easier to repay their loans since lowering loan rate implies the conditions for borrowing credit will be better which decreases the risk of the loan portfolio
This improves the stability of the banks. Few studies have focused on the relationship between competition and liquidity creation (Al-khouri & Arouri, 2019; Horvath et al., 2016; Jiang et al., 2019; Petersen & Rajan, 1995; Yang & Shao, 2016). In their study, Horvath et al. (2016) find that liquidity creation is reduced by high competition. Similarly, Yang & Shao (2016) use sample of Chinese banking micro-data and conclude that bank competition is associated with positive loan growth. Furthermore, regulatory-induced competition diminished liquidity creation in US banks for the period between 1980s and 1990s (Jiang et al., 2019). Leroy (2014) reveals a positive effect of bank competition on the bank lending channel for Eurozone for the period between 1999 and 2011.
Relating to studies in the MENA region, with a sample of 24 commercial banks from 2001-2008, Eldomiaty et al.(2015) document that one of the main particularities of high competitive banks in Egypt is the high level of liquid assets. Another study in the MENA region by Almarzoqi et al. (2015) document that competition in the region has a positive effect on bank liquidity using traditional ratios. However, competition has a negative impact on solvency and credit quality in the MENA region. In their study, Al-khouri & Arouri (2019) reveal that increase in market power leads to increase in liquidity creation for the period between 2002 and 2014 in GCC countries.
Liquidity Creation and the Stability of Banking Industry
In addition to bank competition, this study also considered the stability of banking industry in examining the influence of banking industry factors on liquidity provision. This is due to the possibility that creating liquidity can lead to risks, such as, liquidity and credit risk. Credit risk is the most important risk that banks face when performing its roles (Acharya & Naqvi, 2012; Diamond & Dybvig, 1983). Previous studies have observed no conclusive findings with regard to liquidity creation and bank’s risk (i.e. credit risk) (Fu et al., 2016; Chen et al. 2015; Lei & Song, 2013; Umar & Sun, 2016; Berger & Bouwman, 2017). Munteanu (2012) has observed that during the crisis period, credit risk has a significant effect over banks liquidity. Likewise, (Fungacova et al., 2015) conclude that the probability of bank’s failure is increased significantly by high liquidity creation. A positive relationship between liquidity and risk is observed by (Bougatef & Mgadmi, 2016). In the MENA region, Ghosh (2016) examines the impact of Arab Spring on banking industry and finds a substantial and bidirectional relationship between liquidity and bank’s risk.
Liquidity Creation and Political risk
Political events that alter directly or indirectly the value of an economic asset are part of political risk factors (Bekaert et al., 2014). These political risks include, for instance, declaration of war, acts of terror, laws that expropriate private property, and indiscreet alterations in the rules which govern foreign investments. Discontinuities in the business environment, emanating from political changes with the potential to impinge on the profits or the objectives of a firm, could be referred to as political risk (De Mortanges & Allers, 1996; Robock, 1971). Political risk can be classified as macro political risk, which affects the country as a whole, or micro political risk, that affects a particular sector or a particular project (Alon & McKee, 1999; West, 1996). There are studies that show crises, which are politically linked, have a minor effect on banking sector (Bremmer & Keat, 2010; Chen & Siems, 2004; Chesney et al., 2011). Nevertheless, political transition in the MENA region has negatively affected the region’s economy (Devarajan & Mottaghi, 2014; Ghosh, 2016; International Monetory Fund, 2016; Devarajan et al., 2016). In general, the focus of studies related to the impact of Arab Spring were mostly related to other issues, such as, presidential elections, military intrusions, wars and terrorist attacks (Chau et al., 2014). Concerning the influence of political transition on financial system, Abdelbaki (2013) finds that political instability affects the function of stock markets in MENA region. During the “Arab Spring” political transition, Chau et al. (2014) find that political instability increases the volatility of Islamic related indices. However, the uprisings hold no significant impact on the volatility of the conventional markets. With regard to the banking sector, political instability stifles lending, leads to profitability contracts the banking sector by nearly 0.2% and increases risk (Bitar et al., 2016; Ghosh, 2016). Given these outcomes, it is crucial to examine the impact of competition on liquidity creation, taking into consideration political risk.
Control Variables
Additionally, control variables that have an effect on liquidity creation are also considered as. The first control variable is bank type; either Islamic or conventional banks. This is included in the model due to the coexistence of Islamic and conventional banks in the MENA region. According to Islamic financial services board annual reports, the existence of Islamic banks increased in the region and globally, although there was slow growth in (i.e in year 2015) ( Islamic Financial Services Industry, 2018). Several countries recorded robust levels of growth in key Islamic banking indicators, with many increasing their assets, financing and deposit portfolios.
However, progress in the development of the Islamic banking industry appears to be constrained by macroeconomic challenges (Islamic Financial Services Board, 2018). Previous literature exhibited no consensus regarding Islamic banks’ stability compared to its conventional counterpart during crisis period (Beck et al., 2013; Ftiti et al., 2013; Olson & Zoubi, 2017; Rahim & Zakaria, 2013). The second control variable of this study is the availability of deposit insurance system in the banking system. The inclusion of this variable is important as the central goal of deposit insurance is not only to compensate depositors in case of banks’ insolvency but also to protect the whole financial system in order to reduce the probability of a financial crisis (Anginer et al., 2014). The third control variable for this study is the bank size, which can affect liquidity creation (Berger & Bouwman, 2009; Khan et al, 2017; Singh & Sharma, 2016; Vodov, 2013). Based on previous studies and theories, the framework for this study is as in Figure 1 below.

Figure 1 The Study Framework
Methodology
The effect of bank’s competition, stability of banking industry, political risk on liquidity creation is examined using 55 banks from the selected countries from the MENA region (Arab Saudi, Bahrain, Egypt, Jordan, Kuwait, Lebanon, and Tunisia) for the period from 2006 to 2015. The data are cleaned up; banks with unavailable data are excluded from the analysis. For instance, banks that do not have details about loans categories, details of deposits types and loans types. Banks from countries that are still in unrest, such as, Libya, Syria, and Yemen are also excluded. The validity of data is examined using descriptive statistics (the mean, the median, Skewness and Kurtosis). The Jarque Bera test as a goodness-of-fit (Brooks, 2008) indicates that the null hypothesis that the data is normally distributed is rejected (details is presented in appendix A). Therefore, kernel-based regularized least squares (KRLS) are used to perform the analysis (Ferwerda et al., 2017; Hainmueller & Hazlett, 2014).
It is a machine learning method to fit multidimensional functions y=f(x) for regression. This method is suitable for social science studies because it circumvents the assumptions of parametric. It avoids classification problems without depending on linearity or other strong parametric assumptions. This makes KRLS helpful statistical properties, like unbiasedness, consistency, and asymptotic normality under mild regularity conditions (Opoku-Agyemang, 2017). KRLS is an alternative to ordinary least squares (OLS) and other generalized linear models (GLMs) for regression-based analyses (Ferwerda et al., 2017). Specifically, KRLS provides closed-form estimates for the predicted values, variances, and the point wise partial derivatives that characterize the marginal effects of each independent variable at each data point in the covariate space as presented in the equation 1 below:
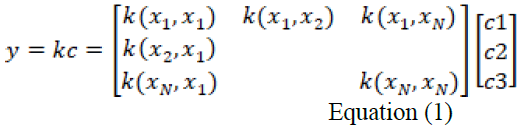
Where, y is the outcome of interest, x1......xn is observation on explanatory variables, c1, c2, c3…ci is choice coefficients, similar to the role that ß coefficients play in linear regression. In the form above, KRLS fits a simple linear model (LM): it fits y for some xi as a linear combination of repressors. Each measure of xi’s similarity to another observation in the data set. The Stata version 14 is used to estimate the panel data multiple regression via the KRLS (Kernel-based Regularized Least Squares). In this study results are estimated based on the Median as non-parametric approach.
The resulting model is directly interpretable in similar ways to linear regression (i.e. OLS and GLMs models) while also providing richer interpretations (Ferwerda et al., 2017). The panel data multiple regression model is conducted for the period before (from 2006 to 2010) and after political transition (the period after the Arab Spring to 2015, refer to appendix B for the exact timing of Arab Spring for each country.). To test the robustness of the results, the same models are retested using alternative measures, i.e. the liquidity creation measure variables were replaced with another liquidity creation measure variables which excludes equity. This is due to the fact that, according to some researchers, equity doesn’t contribute towards liquidity creation (Berger & Bouwman, 2009; Fu et al., 2015). The model is as follows:
Liquidity creation=ƒ (competition, stability of banking industry, political risk, bank type, ‘availability of deposit insurance system’, bank size) Equation (2)
Liquidity Creation
Two liquidity creation measures by Berger & Bouwman (2009) are used to calculate liquidity creation. They are 1) Cat fat liquidity creation measure (LC1, which includes all on- and off-balance sheet (OBS) items) and 2) Cat non-fat liquidity creation measure (LC2, which includes only on balance sheet activities). This method includes three steps. Firstly, items in the balance sheets are classified into liquid, semi-liquid and illiquid. This classification is based on the ‘ease, cost, and time’ for clients to get liquid funds from the bank, and the ‘ease, cost, and time’ for banks to dispose of their obligations in order to meet these liquidity demands. Loans are then classified based on category (liquid, semi-liquid, or illiquid loans) as presented appendix C.
Secondly, weights (+0.5, 0,-0.5) are given to the classified items in the previous step. According to liquidity creation theory, these given weights can be explained as follow: positive weights (+0.5) are given to both illiquid assets and liquid liabilities, thus when liquid liabilities (i.e current customer deposits, savings) are used to finance illiquid assets (i.e. corporate and commercial loans), liquidity is created. In contrast, destroying one dollar of liquidity occurs through transferring one dollar of illiquid liabilities or equity into one dollar of liquid assets. Thus, negative weights is given to liquid assets, illiquid liabilities, and equity, so that when illiquid liabilities (i.e bank’s liability on bankers, other funding) and equity is used to finance a dollar of liquid assets liquid assets (i.e cash, cash and due from banks trading assets), liquidity is destroyed.
Based on assumption that semi liquid assets and liabilities items fall in the middle between liquid and illiquid items, the weight of zero (0) is given to these items. For example, using time deposit to fund residential mortgage would yield almost zero net liquidity creation. This is because the ease, cost, and time with which the time depositors may access their funds early and demand liquidity almost equivalents the ease, cost, and time with that the bank can securitize and sell the mortgage for providing the funds. Same principles are used for off balance sheet items. For example, loan commitments are functionally like business loans and liquid guarantees are functionally similar to liquid assets. Finally, the two previous steps are then combined to construct the measures for liquidity creation. In this study, the dependent variables (i.e. liquidity creation) are calculated using Cat fat (LC1) and Cat non-fat (LC2) measurements as in (equations 3 and 4) below.
LC1 = 0.5* (illiquid assets+ liquid liabilities+ illiquid OBS) + 0* (semiliquid assets +semiliquid liabilities +semiliquid OBS) - 0.5*(liquid assets + illiquid liabilities +equity+ liquid OBS)/ (Gross total assets). Equation. (3)
LC2 = 0.5 *(illiquid assets+ liquid liabilities) +0 * (semiliquid assets+ semi liquid liabilities) –0.5 * (liquid assets+ illiquid liabilities+ equity)/ (Gross total Asset) ……………………….. Equation (4)
These two methods (Cat fat and Cat non-fat) are selected to calculate liquidity because loans in selected banks are classified based on loans category (i.e. semi-liquid and illiquid loans). “Cat” methods of liquidity creation; classify business loans and leases as illiquid assets. This is because it is difficult to sell these items without a significant loss. Residential mortgages and consumer loans and loans to governments are classified as semi liquid assets. This is because these items are relatively easy to securitize. As such, loans issued by banks to depository institutions and governments are likely to be comparatively easier to sell or dispose of. The other two methods (Mat Fat & Mat non Fat) by (Berger & Bouwman, 2009) classify loans based on maturity. However, Cat fat is more preferable on the grounds that what makes a difference to liquidity creation on the asset side is the ease, cost, and time for banks to dispose of their obligations in order to acquire liquid funds. For example, a long-term loan may be securitized relatively very quickly (Berger & Bouwman, 2009). Besides, cat fat measure includes on and off balance sheet items. Figure 2 below illustrates liquidity creation trends for the sampled banks in MENA countries.cat fat (I LC1) and cat non-fat (LC2). In general, there is a fluctuation in liquidity creation for the period of study. Liquidity creation significantly increased from 2010 to 2012 and decreased from 2012 to 2013.

Figure 2 Liquidity Creation Trends for Sampled Banks in Mena Region Between 2006 and 2015
Bank’s Competition
The Lerner index of banking industry in each country is used as a measure of market power. Market power defines as the difference between output prices and marginal costs (relative to prices). It ranges from 1 to 0, with a higher index value indicating greater market power. The trend of market power in the banking system in the MENA region is depictured in Figure 3 below.

Figure 3 Trend of Market Power of Banking System in Mena Selected Countries
Figure 3 shows a significant decline in market power (competition is increased) (LERNER INDEX) of banking system since 2013. The Lerner index (LERNER INDEX) has the significant advantage of capturing the effective of banks’ behaviour, compared to bank concentration, as measure of competition (Horvath et al., 2016). This measure have been used by (Almarzoqi et al., 2015; Berger & Bouwman, 2009; Fiordelisi & Mare, 2014; Fungá?ová et al., 2013). Based on previous literature and theories, the hypothesis regarding liquidity creation and bank’s competition is formulated as below:
H1: There is significant relationship between liquidity creation and competition for Islamic and conventional banks in MENA countries pre and post-political transition
Stability of Banking Industry
To measure the stability of the banking industry, the Z-score for the whole bank industry is used (INZSR). It captures the probability of default of a country's banking system, calculated as a weighted average of the Z-scores of a country's individual banks (the weights are based on the individual banks' total assets). A high value indicates a lower probability of insolvency, vice versa. The trends of stability of banking industry for the sampled banks is presented in Figure 4. It shows the clearer improvement of stability for banking industry in the period after 2008 to 2010 and the notable deterioration after 2014. This raises question about its impact on liquidity creation in both pre and post political transition. To examine the impact of stability of banking industry on liquidity creation, the hypothesis is formulated as below:

Figure 4 Trend of Stability of Banking System (INSZR) for Mena Selected Countries
H2: There is significant relationship between liquidity creation and ‘stability of banking industry’ for Islamic and conventional banks in MENA countries pre and post-political transition.
Political Risk
Political stability (PRISK) is used as the proxy for political risk. It measures perceptions of the likelihood that a government will be destabilized or overthrown by unconstitutional or violent means, such as, politically motivated violence and terrorism. The index ranges from the lowest (high instability) -2.5 to the highest (low instability) 2.5. This measure has been adapted by many studies (Bitar et al., 2016; Cooray, 2009 & Markussen, 2006). As depicted in Figure 5 below, political stability in the MENA region has significantly declined in the region. This is more evident in the post political transition period. The hypothesis that formulated to examine the impact of political risk on liquidity creation is:

Figure 5 Political Stability Trend for the Period 2006 to 2015 for Mena Selected Countries
H3: There is significant relationship between liquidity creation and political risk for Islamic and conventional banks in MENA countries pre and post-political transition.
Bank type (BT) is a dummy variable where BT is equal to ‘1’ for full-fledged Islamic banks; otherwise BT is equal to ‘0’.
Another dummy variable (DIS) is used for ‘availability of deposit insurance system’, where DIS is equal to ‘1’ for countries with availability of deposit insurance Schemes, otherwise DIS is equal to ‘0’. Study used this variable was by (Trinugroho et al., 2016). Bank Size (BS) is proxied by the natural log of gross total assets (Berger & Bouwman, 2009; Khan et al., 2017; Singh & Sharma, 2016; Vodov, 2013). Variables and its sources are summarized in appendix D.
Empirical Results
Descriptive statistics for liquidity creation and competition for the period pre and post political transition are displayed in Table 1 below. Competition in banking industry and stability of banking sector is taken for each country from which a sampled banks were obtained for the period of study.
| Table 1 Summary of Descriptive Statistics for Liquidity Creation and Banking Industry Factors, Political Risk Pre and Post Political Transition | ||||||||
| The period before Arab Spring | ||||||||
| LC1 | LC2 | LERNER INDEX | INZSR | PRISK | BT | DIS | BS | |
| Obs. | 275 | 275 | 275 | 275 | 275 | 0 275 | 275 | 275 |
| Mean | 0.141 | 0.057 | 0.36 | 30 | -0.48 | 0.23 | 0.527 | 15.19 |
| Median | 0.156 | 0.065 | 0.39 | 32 | -0.35 | 0 | 1 | 15.09 |
| Std. Dev | 0.19 | 0.18 | 0.14 | 17.3 | 0.67 | 0.42 | 0.50 | 1.35 |
| Skewness | -0.744 | -0.47 | -0.66 | 0.52 | -0.89 | 1.2 | -0.10 | 0.03 |
| Kurtosis | 4.30 | 4.10 | 3.2 | 1.8 | 3.2 | 2.6 | 1.01 | 2.27 |
| Median range | 12 0.18 |
0.04 0.09 |
0.38 0.41 |
17 33 |
-0.37 -0.33 |
0 0 |
0 1 |
14.9 15 |
| The period post Arab Spring | ||||||||
| LC1 | LC2 | LERNER INDEX | INZSR | PRISK | BT | DIS | BS | |
| Obs. | 196 | 196 | 196 | 196 | 196 | 196 | 196 | 196 |
| Mean | 0.152 | 0.085 | 0.37 | 29.6 | -0.85 | 0.22 | 0.56 | 15.8 |
| Median | 0.170 | 0.084 | 0.40 | 29.7 | -0.63 | 0 | 1 | 15.6 |
| Std. Dev | 0.20 | 0.21 | 0.21 | 15.7 | 0.55 | 0.42 | 0.50 | 1.2 |
| Skewness | -0.54 | -0.44 | -1.7 | 0.29 | -0.26 | 1.3 | -0.22 | 0.06 |
| Kurtosis | 3.35 | 3.2 | 7.8 | 2 | 2.1 | 2.7 | 1.05 | 2.20 |
| Median range | 0.15 0.22 |
0.06 0.1 |
0.36 0.41 |
21 34 |
-0.85 -0.61 |
0 0 |
0 1 |
15 16 |
Notes: Cat Fat liquidity creation (LC1) is the ratio of liquidity creation which includes on and off -balance-sheet activities to gross total assets. Cat non Fat liquidity creation (LC2) is the ratio of liquidity creation which includes only on -balance-sheet activities to gross total assets, LERNER INDEX is a proxy of market power for each banking industry, INZSR is the proxy of stability of banking industy for each country. PRISK is the proxy of political risk ranged from the highest instability-2.5 to the lowest instability 2.5. BT is a dummy variable for bank type, where BT is equal to ‘1’ for full-fledged Islamic banks, otherwise BT is equal to ‘0’. DIS is a dummy variable, where DIS is equal to ‘1’ for countries with ‘availability deposit Insurance system’, otherwise DIS is equal to ‘0’. BS is the natural log of gross total assets.
Political risk represents political instability in each country where the sampled banks were obtained for the period of study. From Table 1, by comparing the mean with the median for examined variables, data is skewed to the left (i.e. LC1, LC2, LERNER INDEX, INZSR) and other (i.e. PRISK) skewed to the right, indicating that most variable are not normally distributed. Descriptive statistics in Table 1 show that the Skewness and Kurtosis also are not within the acceptable range that confirm the normality of data (George & Mallery, 2010).
Hence, the Jarque Bera test is run to test for the normality as presented in appendix A. Results in appendix A indicate that the null hypothesis (the residuals are normally distributed) is rejected. Transforming and winsorizing the data pre and after political transition doesn’t make a difference. The violation of the normality assumptions could lead to inaccurate conclusions (Jarque & Bera 1987), therefore, a non-parametric approach is used for analysis. Firstly, the non-parametric Kendalls tau-b (Croux & Dehon, 2010) for correlation analysis is run and the results are displayed in appendix E.
Based on appendix E, most correlations between independent variables are weak and moderate. The highest correlation was between ‘availability of deposit insurance system’ (DIS) and political risk (PRISK) which was 56% for the period post political transition between. The variable ‘availability of deposit insurance system’ DIS will be lagged one period to avoid any potential endogeneity. Secondly, as the data is not normally distributed, the KRLS estimation is applied to run the model as in equation (2). KRLS estimation allowed us to estimate results based on the median that is robust against outliers. Initially, cat fat liquidity creation (LC1) is used as dependent variable and the results are estimated. Then, for robustness purposes, cat non-fat (LC2) is used as the dependent variable and the results are estimated. The regression results relationship between liquidity creation and industry factors, political risk are reported below in Table 2.
| Table 2 Liquidity Creation and Competition Relationship Pre and Post Political Transition | ||
| The period before Arab Spring | ||
| Independent variable | LC1 (as dependent variable) | LC2 (as dependent variable) |
| LERNER INDEX | -0.345(0.045) | -0.308(0.153) |
| INZSR | -1.3e-07(0.002) | -1.1e-07(0.003) |
| PRISK | 0.0822(0.001) | 0.052(0.015) |
| BT | 0.018(0.541) | 0.037(0.696) |
| DIS(-1) | -0.090(0.003) | -0.095(0.001) |
| BS | -0.008(0.496) | -0.0001(0.754) |
| Observation | 274 | 274 |
| R-squared | 0.494 | 0.486 |
| The period post Arab Spring | ||
| Independent variable | LC1 (dependent variable) | LC2 (dependent variable) |
| LERNER INDEX | 0. 367 (0.033) | 0. 389 (0.004) |
| INZSR | -0.00 4 (0.000) | -0.00 4 (0.000) |
| PRISK | 0.1 3 (0.000) | 0.0 92 (0.004) |
| BT | -0.0 54 (0.112) | -0.02 2 (0.367) |
| DIS(-1) | -0.074(0.021) | -0.0 49 (0.044) |
| BS | -0.0 16 (0.020) | -0.0 08 (0.052) |
| Observation | 195 | 195 |
| R-squared | 0.714 | 0.737 |
Liquidity Creation and Competition
In the context of pre-political transition period, Table 2 shows that coefficient for market power (LERNER INDEX) is negative and significantly correlated with cat fat liquidity creation (LC1). The increase in LERNER INDEX by one unit decreases (LC1) by (0.345) percentage. However, the coefficient of cat non- fat liquidity creation (LC2) is negative but not significant. These findings shows that the nexus between liquidity creation and LERNER INDEX is affected by the inclusion and exclusion of off balance sheet items. These results show the contribution of off-balance sheets activities to create liquidity is affected by the market power of banking industry in selected countries in MENA region.
This research finds that cat fat liquidity creation (LC1), supports the “competition-stability views” (Boyd & De Nicolo, 2005). During the pre-political transition period, the increase in competition level reduces interest rates charged by banks. This will also lead to increased deposit rates in order to attract customers. As a result, loans and deposits demands are increased, which suggests increase in liquidity creation. For the period post-political transition, estimations from Table 2 show that the correlation between liquidity creation and LERNER INDEX is opposite (of those in the pre-political period) transition.
It changed to be positively significant. However, the inclusion of off balance sheet items (i.e. cat fat measure) and exclusion of off balance sheet items (i.e. cat non–fat measure) for the period post political transition do not affect this relationship. The change in LERNER INDEX by one unit percentage followed by increase in LC1 by 0.367 and in LC2 by 0.389 percentage. Compared to relationship pre political transition, the result is in accordance with fragility channel view (Keeley, 1990). According to this view, banks are incentivized to diminish liquidity creation to maintain a strategic distance from the risk of bank runs (Horvath et al., 2016; Petersen, Rajan, 1995). The results are consistent with Horvath et al. (2016) and Yang & Shao, (2016) who find that bank market power is positively correlated with loan growth (Fragility view).
Furthermore Leroy (2014) attributes the positive effect of bank competition on the bank lending channel to the reduction in banks' capacity to access alternative sources of funding. Moreover, results are consistent with Jiang et al. (2019) who conclude that competition diminishes liquidity creation in US banks and with Almarzoqi et al.(2015) who observe competition positively influence liquidity (Liquid assets to short-term borrowing ratio) in MENA region. Almarzoqi et al. expanied that banks under strong competition tend to keep a higher buffer of liquidity and banks with low profit margins would be unable to pay for costly funding sources. As a result, the increase in bank’s liquid assets decreases its liquidity creation based on (Cat fat and Cat non-fat) measures.
Liquidity Creation and Stability of Banking Industry
Based on Table 2, estimation show a negative and significant correlation between cat fat liquidity creation (LC1) and its alternative cat non fat (LC2) with the stability of the banking industry (INZSR). Although these magnitudes are small but the significant relationship indicates that stability of banking industry can influence banks’ role as liquidity creators.The increase in INZSR by one unit diminishes LC1 by (1.3e-07) and LC2 by (1.1e-07). Similar relationship has been estimated for the period post political transition. The impact of INZSR on LC1 and LC2 is higher compared to pre political transition.
The increase in INZSR by one unit percentage declined LC1 and LC2 by 0.004. These findings are in accordance with (Lei & Song, 2013) who find negative relationship between liquidity creation and Z-SCORE for state owned banks in China. The increase in liquidity creation can generate risk to the banking sector, such as, credit risk (Berger & Bouwman, 2017). It is joined by a high probability of the crisis occurrence (Berger, 2010; Imbierowicz & Rauch, 2014) that can influence the whole financial system.
Liquidity Creation and Political Risk
Findings from Table 2 show a positive and significant relationship between political risk (PRISK) with cat fat (LC1) and cat non-fat (LC2) liquidity creation pre and post political transition. The increase in PRISK by 1% reduces LC1 by 0.0822 and LC2 by 0.052 pre Arab Spring. With the deterioration in political stability in MENA region, the relationship between political risk and liquidity creation became more significant after Arab Spring. The increase in PRISK by one unit percentage leads to increase in LC1 and LC2 by 0.13 and 0.081 respectively. Findings indicate that political risk diminishes liquidity creation as the increase in this index means high stability. On the other words, political instability reduces liquidity creation.
These findings are consistent with (Gaibulloev & Younas, 2016) who document that internal conflict negatively influences domestic bank lending to the private sector, but the impact of terrorism does not. Furthermore, this supports the findings by (Bitar et al., 2016; Ghosh 2016) who conclude that political transition has affected the banking industry in MENA region. With respect to cat fat (LC1), cat non-fat (LC2) liquidity creation and the control variable ‘availability of deposit insurance system’ (DIS), the relationship is significant, where DIS negatively reduces liquidity creation. The increase in countries with ‘availability of deposit insurance system’ by one unit is followed by a decrease by 0.090 percentages in LC1 and by 0.095 in LC2 pre-political transition. The coefficient of DIS is smaller and less significant post political transition, where the increase in DIS by one unit decreases LC1 and LC2 by 0.074 and 0.049 respectively.
This result is consistent with (Trinugroho et al., 2016) who observe negative effect of deposit insurance coverage on bank liquidity. Furthermore, from Table 2 the negative and significant correlation of control variable bank size (BS) with cat fat (LC1), cat non-fat (LC2) liquidity creation is observed for the period after the Arab Spring. The increase in bank size by one unit decreases liquidity creation by (0.016) in LC1 and (0.01) in LC2 (which less significant compare to LC2). The findings are in accordance with (Fu et al., 2014; Singh & Sharma, 2016; Vodov, 2013). This results suggest that small banks creates more liquidity. On the other hand, large banks create less liquidity per assets, as larger banks can be relied upon to have less unstable cash flows (by reason of offsetting flows) and better access to various financing sources (Bonner et al., 2015).
Using Alternative Measures
Theoretical literature on bank’s liquidity creation explains that banks create liquidity by transforming illiquid assets into liquid liabilities rather than illiquid claims, such as, shareholder’s equity. Therefore, following (Berger & Bouwman, 2009) and (Fu et al., 2015), the liquidity creation measures were replaced with another liquidity creation measure which excludes equity from the calculation of LC1 and LC2. LC3 is the alternative measure of LC1 while LC4 is an alternative measure of LC2. Estimations are presented in appendix F, and the results are consistent with the previous results in Table 2. Only banks’ LC3 relationship with BS became significant pre-political transition.
Conclusions
This study examines the relationship of liquidity creation with competition, stability of banking industry and political risk taking into consideration the unstable political condition in MENA region from 2006 to 2015. The main finding of this study is that, liquidity creation is negatively related with market power for the period pre Arab Spring, supporting the “competition-stability views”. However, after the Arab Spring, cat fat and cat non-fat liquidity creation positively related to market power. These findings support the “competition-fragility approach” which suggests that increased market power diminishes credit supply. Moreover, the deterioration of stability of banking industry and ‘availability of deposit insurance system’ diminishes liquidity provision.
Taking into consideration the political risk in this region, the results show a positive relationship between liquidity creation and political risk. This means, political risk (i.e. political instability) reduces the liquidity creation which confirming the negative impact of Arab spring on banking industry in MENA countries. The findings via alternative measures of liquidity creation to test the robustness of the results are consistent with main results. With the increase in global activities by banks and the importance of banking industry in the MENA region, these findings raise critical issues for authorities to focus on regulations that improve competition. It is important for policy makers to consider policy reforms that ease some of the restrictions imposed on entering the banking sector in this region and encourage banks to expand their activities globally. Since increased competition may cause banks to engage in activities that may affect the stability of the financial sector as a whole, regulations should focus on the quality of banking supervision, by adopting policy measures that increase competition but do not negatively influence banks as the main channel of funds for economic activities in the region.
Appendix
| Appendix A The Jarque Bera Test for Liquidity Creation and Industry Factors Relationship Pre and Post Political Transition | |||||
| The period before Arab Spring | |||||
| Joint | |||||
| Variable | Obs. | Pr(skewness) | Pr(kurtosis) | Adj chi2 (2) | Prob>chi2 |
| residuals | 275 | 0.0002 | 0.000 | 27.68 | 0.000 |
| The period post Arab Spring | |||||
| Joint | |||||
| Variable | Obs. | Pr(skewness) | Pr(kurtosis) | Adj chi2 (2) | Prob>chi2 |
| residuals | 196 | 0.0915 | 0.003 | 10.17 | 0.0062 |
| Appendix B Period of Arab Spring for Mena Countries | ||
| Country | Years | Remark |
| Bahrain | 2011-12 | Civil disorder and governmental changes |
| Egypt | 2011-12 | Civil disorder and governmental changes |
| Jordan | 2011 | Major protests and governmental changes |
| Lebanon | 2011 | Major protests and governmental changes |
| Kuwait | 2011-12 | Major protests and governmental changes |
| *Saudi Arabia | In March 2011 | Minor protests |
| Tunisia | 2011-12 | Government overthrown |
*source: (Kamrava, 2012)
| Appendix C Classification of Liquidity Creation Using Cat Non- Fat and Cat Fat Measurements | ||
| On balance sheet items | ||
| Illiquid assets (weight=1/2) Corporate and commercial, loans, other loans, investments in property, fixed assets, Goodwill, other intangibles Liquid liabilities (weight=1/2) Current customer deposits, savings, derivatives, trading liabilities. |
Semiliquid assets (weight=0) Residential and other mortgage loans, other consumer/retail loans, Loans to banks, loans to local and foreign governments Semiliquid liabilities (weight=0) Time deposits, other deposits and short-term borrowings |
Liquid assets (weight=−1/2) Cash and due from banks trading assets, all securities regardless of maturity Illiquid liabilities plus equity (weight=−1/2) Bank’s liability on bankers acceptances borrowing, other funding, credit impairment reserves, Illiquid liabilities plus equity |
| Off balance sheet items (OBS) | ||
| Illiquid OBS (weight=1/2) Acceptances and documentary credits reported OBS committed credit lines, other OBS liabilities, |
Semiliquid OBS (weight=0) Managed securitized assets reported OBS, other OBS exposure to securitizations, Guarantees |
Liquid OBS (weight=−1/2) Liquid guarantees, liquid derivatives, interest rate derivatives, foreign exchange derivatives equity and commodity derivatives |
| Appendix D Summary of Variables and Their Sources | |||
| No. | Variable | Data source | Notion |
| 1 | *Cat fat liquidity creation | Based on Banks’ annual reports, Data Stream data- | LC1 |
| 2 | *Cat non-fat liquidity creation (alternative of cat fat liquidity creation) |
Based on Banks’ annual reports, Data Stream data- | LC2 |
| 3 | Competition in Banking industry ( market power) |
Federal Reserve Bank of St. Louis (FRED) based on World Bank data | LERNER INDEX |
| 4 | Political risk | World Bank Group data, The Global Economy.com | PRISK |
| 5 | Stability of Banking industry | Federal Reserve Bank of St. Louis (FRED) based on World Bank data | INZSR |
| 6 | Bank type | Banks’ annual reports | BT |
| 7 | availability of deposit insurance system | The World Bank | DIS |
| 8 | Bank’s size | Calculated based on banks’ annual reports | BS |
| Appendix E The Kendalls Tau-B Correlation for Liquidity Creation, and Competition with Other Variables Pre And Post Political Transition | |||||||||
| The period before Arab Spring | |||||||||
| LC1 | LC2 | LERNER INDEX | INZSR | PRISK | BT | DIS | BS | ||
| LC1 | 1 | ||||||||
| LC2 | 0.78* | 1 | |||||||
| LERNER INDEX | 0.26* | 0.25* | 1 | ||||||
| INZSR | -0.16 | -0.21* | -0.06 | 1 | |||||
| PRISK | 0.25* | 0.21* | 0.41* | -0.12* | 1 | ||||
| BT | -0.04 | 0.02 | 0.12* | -0.29* | 0.18* | 1 | |||
| DIS | -0.43* | -0.44* | -0.48 | 0.36* | -0.37* | 0.02 | 1 | ||
| BSIZS | 0.08 | 0.11* | 0.21* | -0.33* | -0.06* | -0.13* | -0.3* | 1 | |
| The period post Arab Spring | |||||||||
| LC1 | LC2 | LERNER INDEX | INZSR | PRISK | BT | DIS | BS | ||
| LC1 | 1 | ||||||||
| LC2 | 0.84* | 1 | |||||||
| LERNER INDEX | 0.45* | 0.46 | 1 | ||||||
| INZSR | -0.19 | -0.18 | -0.15* | 1 | |||||
| PRISK | 0.30* | 0.26* | 0.53* | -0.11* | 1 | ||||
| BT | 0.03 | 0.08 | 0.15* | -0.33* | 0.19* | 1 | |||
| DIS | -0.50* | -0.49* | -0.56* | 0.43* | -0.35* | -0.04 | 1 | ||
| BS | 0.06 | 0.06 | 0.07 | -0.32* | 0.06 | -0.08 | -0.37* | 1 | |
| Appendix F Alternative Measures of Liquidity Creation and Banking Industry Factors Relationship | ||
| The period before Arab Spring | ||
| Independent variable | LC3(as dependent variable) | LC4 (as dependent variable) |
| LERNER INDEX | -0.328(0.016) | -0.303(0.067) |
| INZSR | -1.4e-07(0.00) | -1.2e-07(0.000) |
| PRISK | 0.0845(0.000) | 0.066(0.008) |
| BT | 0.04(0.814) | 0.061(0.184) |
| DIS(-1) | -0.083(0.001) | -0.92(0.000) |
| BS | -0.019(0.032) | -0.008(0.071) |
| Observation | 274 | 274 |
| R-squared | 0.516 | 0.512 |
| The period post Arab Spring | ||
| Independent variable | LC3(dependent variable) | LC4 (dependent variable) |
| LERNER INDEX | 0. 404 (0.032) | 0. 429 (0.005) |
| INZSR | -0.00 4 (0.000) | -0.00 4 (0.000) |
| PRISK | 0.1 45 (0.000) | 0. 104 (0.006) |
| BT | -0.05 7 (0.097) | -0.02 6 (0.316) |
| DIS(-1) | -0.07 8 (0.027) | -0.0 46 (0.058) |
| BS | -0.0 16 (0.008) | -0.0 04 (0.024) |
| Observation | 195 | 195 |
| R-squared | 0.726 | 0.749 |
References
- Abdelbaki, H.H. (2013). The impact of Arab spring on stock market performance. British Journal of Economics, Management and Trade, 3(3), 169-185.
- Abuzayed, B., Al-Fayoumi, N., &Gharaibeh, H. (2012). Competition in MENA countries banking markets. International Journal of Financial Services Management, 5(3), 272-301.
- Acharya, V., & Naqvi, H. (2012). The seeds of a crisis: A theory of bank liquidity and risk taking over the business cycle. Journal of Financial Economics, 106(2), 349-366.
- Al-khouri, R., & Arouri, H. (2019). Market power and the role of banks as liquidity providers in GCC markets. Cogent Economics &Finance, 7(1), 1-17.
- Almarzoqi, R., Naceur, M.S.B., & Scopelliti, A. (2015). How does bank competition affect solvency, liquidity and credit risk? Evidence from the MENA countries (No. 15-210). International Monetary Fund.
- Alon, I., & McKee, D. (1999). Towards a macro environmental model of international franchising. Multinational Business Review, 7(1), 76.
- Andrew, M. (2019). The digital trends disrupting the banking industry in 2019. Retrieved 10 November 2019 from https://www.businessinsider.com/banking-industry-trends?IR=T /
- Anginer, D., Demirguc-Kunt, A., & Zhu, M. (2014). How does competition affect bank systemic risk? Journal of Financial Intermediation, 23(1), 1-26.
- Beck, T., De Jonghe, O., & Schepens, G. (2013). Bank competition and stability: Cross-country heterogeneity. Journal of Financial Intermediation, 22(2), 218-244.
- Beck, T., Demirgüç-Kunt, A., & Merrouche, O. (2013). Islamic vs. conventional banking: Business model, efficiency & stability. Journal of Banking and Finance, 37(2), 433-447.
- Bekaert, G., Harvey, C.R., Lundblad, C.T., & Siegel, S. (2014). Political risk spreads. Journal of International Business Studies, 45(4), 471-493.
- Berger, A.N., & Bouwman, C.H. (2009). Bank liquidity creation. Review of Financial Studies, 22(9), 3779-3837.
- Berger, A.N., & Bouwman, C.H.S. (2017). Bank liquidity creation, monetary policy, and financial crises. Journal of Financial Stability, 30, 139-155.
- Berger, A.N., Klapper, L.F., & Turk-Ariss, R. (2009). Bank competition and financial stability. Journal of Financial Services Research, 35(2), 99-118.
- Bitar, M., Saad, W., & Benlemlih, M. (2016). Bank risk and performance in the MENA region: The importance of capital requirements. Economic Systems, 40(3), 398-421.
- Boot, A.W., Greenbaum, S.I., & Thakor, A.V. (1993). Reputation and discretion in financial contracting. The American Economic Review, 1165-1183.
- Bougatef, K., & Mgadmi, N. (2016). The impact of prudential regulation on bank capital and risk-taking: The case of MENA countries. The Spanish Review of Financial Economics, 14(2), 51-56.
- Boyd, J.H., & De Nicolo, G. (2005). The theory of bank risk taking and competition revisited. The Journal of Finance, 60(3), 1329-1343.
- Bremmer, I., & Keat, P. (2010). The fat tail: The power of political knowledge for strategic investing (Second Edition). New York, Oxford University Press, New York.
- Bremmer, I., Keat, P., & Schaap, R. (2009). Country assessments. Harvard Business Review, 87(7-8), 138-139.
- Brooks, C. (2008). Introductory econometrics for finance (Second Edition). New York Cambridge university press.
- Bryant, J. (1980). A model of reserves, bank runs, and deposit insurance. Journal of Banking and Finance, 4(4), 335-344.
- Chau, F., Deesomsak, R., & Wang, J. (2014). Political uncertainty and stock market volatility in the Middle East & North African (MENA) countries. Journal of International Financial Markets, Institutions and Money, 28, 1-19.
- Chen, A.H., & Siems, T.F. (2004). The effects of terrorism on global capital markets. European Journal of Political Economy, 20(2), 349-366.
- Chen, T.H., Chou, H.H., Chang, Y., & Fang, H. (2015). The effect of excess lending on bank liquidity: Evidence from China. International Review of Economics and Finance, 36, 54-68.
- Chesney, M., Reshetar, G., & Karaman, M. (2011). The impact of terrorism on financial markets: An empirical study. Journal of Banking and Finance, 35(2), 253-267.
- Cooray, A.V. (2009). Government expenditure, governance and economic growth. Comparative Economic Studies, 51(3), 401-418.
- Croux, C., & Dehon, C. (2010). Influence functions of the Spearman & Kendall correlation measures. Statistical methods and applications, 19 peter (4), 497-515.
- De Mortanges, C.P., & Allers, V. (1996). Political risk assessment: Theory and the experience of Dutch firms. International Business Review, 5(3), 303-318.
- Devarajan, S., & Mottaghi, L. (2014). Growth Slowdown Heightens the Need for Reforms. Washington, DC, World Bank Publications
- Devarajan, S., Mottaghi, L., Do, Q.T., Brockmeyer, A., Joubert, C., Bhatia, K., & Abdel-Jelil, M. (2016). Middle East and North Africa Economic Monitor, October 2016: Economic and Social Inclusion to Prevent Violent Extremism. Washington, World Bank.
- Diamond, D.W., & Dybvig, P.H. (1983). Bank runs, deposit insurance, and liquidity. Journal of Political Economy, 91(3), 401-419.
- Eldomiaty, T., Fikri, A., Mostafa, W., & Amer, H.H. (2015). The Financial Determinants of Operating Efficiency for Low and High Competitive Banks in Egypt. Journal of Finance, 3(2), 07-23.
- Ferwerda, J., Hainmueller, J., & Hazlett, C.J. (2017). Kernel-based regularized least squares in R (KRLS) and Stata (krls). Journal of Statistical Software, 79(3), 1-26.
- Financial stability board. (2018). Global Monitoring Report on Non-Bank Financial Intermediation, Financial Stability Board. Retrieved 7 November 2019 from https://www.fsb.org/wp-content/uploads/P040219.pdf
- Finger, M.H., & Gressani, M.D. (2014). Toward new horizons: Arab economic transformation amid political transition. Washington, International Monetary Fund.
- Fiordelisi, F., & Mare, D.S. (2014). Competition and financial stability in European cooperative banks. Journal of International Money and Finance, 45, 1-16.
- Freixas, X., & Rochet, J.C. (2008). Microeconomics of Banking (Second Edition). London, The MIT Press, Cambridge,
- Ftiti, Z., Nafti, O., & Sreiri, S. (2013). Efficiency of Islamic banks during subprime crisis: Evidence of GCC countries. Journal of Applied Business Research, 29(1), 285.
- Fu, X., Lin, Y., & Molyneux, P. (2016). Bank capital and liquidity creation in Asia Pacific. Economic Inquiry, 54(2), 966-993.
- Fungá?ová, Z., Herrala, R., & Weill, L. (2013). The influence of bank ownership on credit supply: Evidence from the recent financial crisis. Emerging Markets Review, 15, 136-147.
- Fungacova, Z., Turk, R., & Weill, L. (2015). High liquidity creation and bank failures. Washington, International Monetary Fund.
- George, D., & Mallery, P. (2010). SPSS for Windows step by step. A simple study guide and reference (10. Bask?)
- Ghosh, S. (2016). Political transition and bank performance: How important was the Arab Spring? Journal of Comparative Economics, 44(2), 372-382.
- González, L.O., Razia, A., Búa, M.V., & Sestayo, R.L. (2017). Competition, concentration and risk taking in Banking sector of MENA countries. Research in International Business and Finance, 42, 591-604.
- Hainmueller, J., & Hazlett, C. (2014). Kernel regularized least squares: Reducing misspecification bias with a flexible and interpretable machine learning approach. Political Analysis, 22(2), 143-168.
- Hassan, M.K. (1993). The off-balance sheet banking risk of large US commercial banks. The quarterly Review of Economics and Finance, 33(1), 51-69.
- Herrala, R., & Turk-Ariss, R. (2016). Capital accumulation in a politically unstable region. Journal of International Money and Finance, 64, 1-15.
- Holmström, B., & Tirole, J. (1998). Private &public supply of liquidity. Journal of Political Economy, 106(1), 1-40.
- Horvath, R., Seidler, J., & Weill, L. (2016). How bank competition influences liquidity creation. Economic Modelling, 52, 155-161.
- Ianchovichina, E., & Mottaghi, L. (2013). Middle East and North Africa Economic Developments and Prospects, January 2011: Sustaining the Recovery and Looking Beyond. Washington, World Bank Publications.
- International Monetary Fund. (2016). Regional Economic Outlook, October 2016, Middle East and Central Asia. Washington, International Monetary Fund Publication Services,
- Islamic Financial Services Board,(2018). Islamic financial services industry stability report 2018. Retrieved 2 November 2019 from https://www.ifsb.org/download.php?id=4811&lang=English&pg=/index.php
- Jagtiani, J., & Khanthavit, A. (1996). Scale and scope economies at large banks: Including off-balance sheet products and regulatory effects (1984-1991). Journal of Banking and Finance, 20(7), 1271-1287.
- Jarque, C. M., & Bera, A. K. (1987). A test for normality of observations and regression residuals. International Statistical Review/Revue Internationale de Statistique, 163-172.
- Jiang, L., Levine, R., & Levine, R. (2019). Competition and bank liquidity creation. Journal of Financial and Quantitative Analysis, 54(2), 513-538.
- Kamrava, M. (2012). The Arab Spring & the Saudi-led counterrevolution. Orbis, 56(1), 96-104.
- Kashyap, A.K., Rajan, R., & Stein, J.C. (2002). Banks as liquidity providers: An explanation for the coexistence of lending and deposit?taking. The Journal of Finance, 57(1), 33-73.
- Keeley, M.C. (1990). Deposit insurance, risk, and market power in banking. The American Economic Review, 1183-1200.
- Khan, M.S., Scheule, H., & Wu, E. (2017). Funding liquidity & bank risk taking. Journal of Banking and Finance, 82, 203-216.
- Lei, A.C., & Song, Z. (2013). Liquidity creation and bank capital structure in China. Global Finance Journal, 24(3), 188-202.
- Leroy, A. (2014). Competition and the bank lending channel in Eurozone. Journal of International Financial Markets, Institutions and Money, 31, 296-314.
- Markussen, T. (2006). US politics & World Bank IDA-lending. The Journal of Development Studies, 42(5), 772-794.
- Munteanu, I. (2012). Bank liquidity and its determinants in Romania. Procedia Economics and Finance, 3, 993-998.
- Olson, D., & Zoubi, T. (2017). Convergence in bank performance for commercial and Islamic banks during and after the Global Financial Crisis. The Quarterly Review of Economics and Finance, 65, 71-87.
- Opoku-Agyemang, K.A. (2017). Priming human-computer interactions: Experimental evidence from economic development mobile surveys. Retrieved 5 November 2019 https://psyarxiv.com/n4dcw/download
- Petersen, M.A., & Rajan, R.G. (1995). The Effect of Credit Market Competition on Lending Relationships. The Quarterly Journal of Economics, 110(2), 407-443.
- Rahim, S.R.M., & Zakaria, R.H. (2013). Comparison on stability between Islamic and conventional banks in Malaysia. Journal of Islamic Economics, Banking and Finance, 9(3), 131-149.
- Robock, S.H. (1971). Political risk-identification & assessment. Columbia Journal of world business, 6(4), 6-20.
- Singh, A., & Sharma, A.K. (2016). An empirical analysis of macroeconomic and bank-specific factors affecting liquidity of Indian banks. Future Business Journal, 2(1), 40-53.
- Umar, M., & Sun, G. (2016). Non-performing loans (NPLs), liquidity creation, and moral hazard: Case of Chinese banks. China Finance and Economic Review, 4(1), 10.
- United Nation (2019). Financing for Sustainable Development Report. Retrieved 7 November 2019 from https://developmentfinance.un.org/sites/developmentfinance.un.org/files/FSDR2019.pdf
- Vodov, P. (2013). Determinants of commercial bank liquidity in Hungary. e-Finanse, 9(3), 64.
- West, G.T. (1996). Managing project political risk: The role of investment insurance. Journal of project Finance, 2(4), 5-11.
- Yang, J., & Shao, H. (2016). Impact of bank competition on the bank lending channel of monetary transmission: Evidence from China. International Review of Economics and Finance, 43, 468-481.