Research Article: 2019 Vol: 22 Issue: 1
Manager Sentiment and Stock Market Volatility
Gupta Rangan, University of Pretoria
Abstract
This paper hypothesizes that corporate managers’ sentiment can predict aggregate stock market volatility. Using a k-th order nonparametric causality-in-quantiles test, we show that manager sentiment is a stronger predictor for volatility than stock return, especially when one accommodates for misspecification in the linear predictive model via a nonparametric datadriven approach. But, predictability is completely absent at extreme ends of the conditional distribution of return, and at the upper end of the same for volatility.
Keywords
Manager Sentiment, Asset Pricing, Return and Volatility Predictability.
JEL classifications
C22, C53, G11, G12.
Introduction
Corporate managers, just like investors, are not immune to behavioural biases, and hence, can be overly optimistic or pessimistic relative to fundamentals, which in turn, can lead to irrational market outcomes. In the process, speculative market sentiment can lead stock prices to diverge from their fundamental values as suggested in behavioural finance (De Long et al., 1990; Shefrin, 2008). While, following Baker and Wurgler (2006), there exists a large empirical literature that relies on investor sentiment to explain stock market return and volatility (Huang et al., 2015; Kumari and Mahakud, 2015:2016; Balcilar et al., 2018a; Zhou, 2017 for detailed reviews of this literature), there is little research on the role of corporate managers’ sentiment on stock market movements a somewhat surprising observation, in light of managers’ information advantage about their companies over outside investors. Given this, Jiang et al. (2017) constructs a manager sentiment index based on the aggregated textual tone of corporate financial disclosures, and then finds that manager sentiment is a strong (negative) predictor of future aggregate stock market returns.
It is well-accepted that, investor sentiment creates systematic risk to the assets and this risk is priced into the market, implying an impact on not only on stock return, but also its (conditional) volatility. Given that, intuitively speaking, investors may simply follow managers’ sentiment in financial disclosures, even though this sentiment may not represent the underlying fundamentals of the firm, it is not irrational to hypothesize that, just like investor sentiment, manager sentiment should also predict not only stock return, but also volatility. This is exactly the question we aim to address in this paper, and in the process extend the analysis of Jiang et al. (2017).
For our purpose, we conduct the predictability analysis based on the kth order nonparametric causality-in-quantiles test recently developed by Balcilar et al. (2018b), over the monthly period of 2003:01 to 2014:12. As indicated by Balcilar et al. (2018b), the causality-inquantile approach has the following novelties: Firstly, it is robust to misspecification errors as it detects the underlying dependence structure between the examined time series, which could prove to be particularly important as it is well known that stock returns display nonlinear dynamics with respect to its predictors-something that we show to exist formally via statistical tests in our case as well. Secondly, via this methodology, we are able to test not only for causality-in-mean (1st moment), but also for causality that may exist in the tails of the joint distribution of the variables, which in turn, is important if the dependent variable has fat-tails-a feature we show below to hold for stock returns. Finally, we are also able to investigate causality-in-variance and, thus, study impact on volatility. Such an investigation is important because, during some periods, causality in the conditional-mean may not exist while, at the same time, higher-order interdependencies may turn out to be significant. To the best of our knowledge, this is the first paper that evaluates the predictive power of manager sentiment for S&P 500 stock returns and volatility based on a nonparametric causality-in-quantiles framework.1 The rest of this paper is organized as follows: Section 2 describes the econometric frameworks involving the higher-moment nonparametric causality-in-quantiles test. Section 3 presents the data and discusses the empirical results, with Section 4 concluding the paper.
Methodology
In this section, we briefly present the methodology for the detection of nonlinear causality via a hybrid approach as developed by Balcilar et al. (2018b), which in turn is based on the frameworks of Nishiyama et al. (2011) and Jeong et al. (2012). It was started by denoting stock returns by yt and the predictor variable (in our case, the manager sentiment index, as discussed in the data segment) as xt. We further let 
 denote the conditional distribution functions of yt given
  respectively. If we let denote
 and
and we have
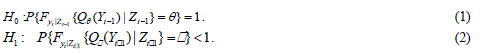
 with probability one. As a result, the (non) causality in the q -th quantile hypotheses to be tested are:
Jeong et al. (2012) use the distance measure 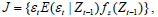 where
where  is the regression error term and
  is the marginal density function of
 The regression error emerges based on the null hypothesis in (1), which can only be true if and only if
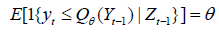 or, expressed in a different way,
 where 1{×} is the indicator function. Jeong et al. (2012) show that the feasible kernel-based sample analogue of J has the following format:

Where, K(·) is the kernel function with bandwidth h ,T is the sample size p, is the lag order, and  is the estimate of the unknown regression error, which is given by:

 is an estimate of the
 conditional quantile of
 given
given and we estimate
 using the nonparametric kernel method as:

Where,  is the Nadarya-Watson kernel estimator given by:
With L(·) denoting the kernel function and h the bandwidth.
As an extension of Jeong et al. (2012)'s framework, Balcilar et al. (2018b) developed a test for the second moment which allows us to test the causality between the manager sentiment index and stock market volatility. Adapting the approach in Nishiyama et al. (2011), higher order quantile causality can be specified in terms of the following hypotheses as:
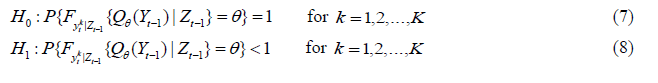
The entire framework can be integrated to test whether xt Granger causes yt in quantile θ up to the kth moment using Eq. (7) by constructing the test statistic in Eq. (6) for each k . The causality-in-variance test can then be calculated by replacing yt in Eqs. (3) and (4) with  measuring the volatility of stock returns. However, one can show that it is difficult to combine the different statistics for each k =1,2,...,K into one statistic for the joint null in Eq. (7) because the statistics are mutually correlated (Nishiyama et al., 2011). Balcilar et al. (2018b), thus, propose a sequential-testing method as described in Nishiyama et al. (2011). First, as in Balcilar et al. (2018b), we test for the nonparametric Granger causality in the first moment (i.e., k=1). Nevertheless, failure to reject the null for k= 1 does not automatically lead to no-causality in the second moment. Thus, we can still construct the test for k = 2 , as discussed in detail in Balcilar et al. (2018b).
The empirical implementation of causality testing via quantiles entails specifying three key parameters: the bandwidth (h), the lag order (p), and the kernel type for k(.) and L(.). We use a lag order of one based on the Schwarz information criterion (SIC), which is known to select a parsimonious model as compared with other lag-length selection criteria, and hence, help us to overcome the issue of the over-parameterization that typically arises in studies using nonparametric frameworks. Note that the choice of one lag is in line with the predictive regression framework of Jiang et al. (2017). For each quantile, we determine the bandwidth parameter (h) by using the leave-one-out least-squares cross validation method. Finally, for k(.) and L(.) , we use Gaussian kernels.
Results and Discussion
The empirical analysis utilizes monthly data for the log-returns of the S&P 500 (i.e., monthly logarithmic change multiplied by 100 to convert the returns into percentages; SR) and the Manager Sentiment Index (MSI), covering the monthly period of 2003:01 to 2013:12. The start and end dates are governed purely by the availability of data on the manager sentiment index. While the monthly return on the S&P 500 index (including dividends) is derived from Professor Amit Goyal’s website,2 the manager sentiment index is obtained from the website of Professor Guofu Zhou.3 Note that, Jiang et al. (2017) constructs the manager sentiment index based on the aggregated textual tone in firm financial statements (10-Ks and 10-Qs) and conference calls, given that qualitative description of the firm’s business and financial performance at least partially reflects managers’ subjective opinions and beliefs about why their firms performed as they did over the recent fiscal period and their expectations for future firm performance. Further, using the standard financial and accounting dictionary method, these authors measure textual tone as the difference between the number of positive and negative words in the disclosure scaled by the total word count of the disclosure. The summary statistics of the two variables have been tabulated in Table A1 in the Appendix of the paper, with Figure A1, also in the Appendix, plotting the two variables of concern. As can be observed from Table A1, both variables are non-normal due to negative skewness and excess kurtosis and hence, provide an initial motivation to use a quantiles-based method.4
Before we discuss the findings from the causality-in-quantiles test, for the sake of completeness and comparability with Jiang et al. (2017), we first conducted the standard linear Granger causality test. The resulting χ2(1) statistic, is found to be 11.1423 with a p-value of 0.0008, suggesting that the null hypothesis that MSI does not Granger cause SR, is strongly rejected at the 1 percent level of significance.
But, realizing the possibility that financial market variables are likely to be nonlinearly related with its predictors, we next statistically examine the presence of nonlinearity and structural breaks in the relationship between SR and relative MSI. Nonlinearity and regime changes, if present, would motivate the use of the nonparametric quantiles-in-causality approach, as the quantiles-based test would formally address nonlinearity and structural breaks in the relationship between the two variables under investigation. For this purpose, we apply the Brock et al. (1996, BDS) test on the residuals from the stock return equation involving one lag each of SR and MSI. Table A2 in the Appendix presents the results of the BDS test of nonlinearity. As shown in this table, we find strong evidence, at highest level of significance, for the rejection of the null of i.i.d. residuals at various embedded dimensions (m), which in turn, is indicative of nonlinearity in the relationship between SR and MSI. To further motivate the causality-in-quantiles approach, we next used the powerful UDmax and WDmax tests of Bai and Perron (2003), to detect 1 to M structural breaks in the relationship between SR and MSI, allowing for heterogenous error distributions across the breaks. When we applied these tests again to the stock return equation involving one lag of SR and MSI, we detected one breaks at 2009:03. These findings indicate that, the positive result of predictability based on the linear Granger causality test, cannot be deemed robust and reliable.
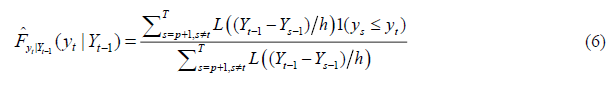
Given the strong evidence of nonlinearity and structural break(s) in the relationship between SR and MSI, we now turn our attention to the causality-in-quantiles test, which is robust to misspecification due to its nonparametric (i.e., data-driven) approach. Besides this, the k-th order test allows us to study the predictability of MSI on the entire conditional distribution of not only SR, but also its squared value, i.e., volatility (SV).
As seen from Figure 1(a), which report this test for stock return over the quantile range of 0.05 to 0.95, the null that MSI does not Granger because SR is rejected at the 5 percent level of significance for quantiles 0.25, 0.35-0.50, and 0.80-0.85. The null of no-causality is rejected only at the 10 percent level of significance for all the quantiles barring 0.05-0.10 and 0.95. In other words, barring the extreme ends of the conditional distribution of stock returns, predictability does hold relatively strongly at moderately low and moderately high quantiles and around the median, but not in an overwhelming fashion (i.e., at the 1 percent level) as observed under the conditional mean-based linear causality tests, which however, happens to be based on a misspecified model, and hence not completely reliable for drawing inferences.
When we turn to Figure 1(b), which plots the causality-in-quantiles test result for volatility over the quantile range of 0.05 to 0.95, the null that MSI does not Granger cause SV is overwhelmingly rejected at the 1 percent level of significance over the quantile range of 0.10-0.85, with the strongest evidence of predictability observed at the median of the conditional distribution of SV. Predictability is found at the 5 percent level for the quantiles of 0.05 and 0.90, but causality cannot be detected for SV at the highest considered quantile of 0.95. So, MSI does have strong ability for predicting stock market volatility, except at the highest level of conditional volatility (Andersen and Bollerslev, 1998).5

Figure 1a:Causality-In-Quantiles Test Result For Stock Returns Of The S&P 500.

Note: 10% CV, 5% CV, and 1% CV are the 10, 5 and 1 percent critical values of 1.645, 1.96, and 2.575 respectively. The horizontal axis measures the various quantiles while the vertical axis captures the test statistic. The line corresponding to the manager sentiment index (MSI) shows the rejection (non-rejection) of the null of no Granger causality from MSI on S&P 500 stock return (SR) or volatility (SV) at the 10, 5, or 1 percent levels of significance, if the lines are above (below) 1.645, 1.96, or 2.575 for a specific quantile. Table A1. Entries correspond to the z-statistic of the BDS test with the null of i.i.d. residuals, with the test applied to the residuals recovered from the stock return equation with one lag each of SR and MSI.
Figure 1b:Causality-In-Quantiles Test Result For Squared Returns (Volatility) Of The S&P 500.
In sum, our results confirm the main hypothesis of our paper that manager sentiment can predict stock market volatility to the extent that, the manager sentiment index is a stronger predictor for volatility than stock return, especially when one accommodates for misspecification in the linear predictive model via a nonparametric data-driven approach.6 Further, the fact that predictability is completely absent at extreme ends of the conditional distribution of return, and at the upper end of the same for volatility, is possibly an indication of the fact that during these phases of the market, agents herd (Balcilar et al., 2017), and as a result information content in the manager sentiment index is of very little value in predicting future stock market movements (i.e., return and volatility).
Conclusion
In a recent paper, Jiang et al. (2017) showed that manager sentiment, just like investor sentiment, can predict aggregate stock market returns. Given that the literature has shown that investor sentiment can also predict stock market volatility, and investor and manager sentiments are closely related, we hypothesize that manager sentiment can also do the same, i.e., cause stock market volatility. For our purpose, we conduct the predictability analysis based on the k-th order nonparametric causality-in-quantiles test recently developed by Balcilar et al. (2018b), over the monthly period of 2003:01 to 2014:12 for S&P 500 index.
Starting off with the standard linear Granger causality test, we were able to detect strong evidence of manager sentiment causing stock return. But, we indicate that linear Granger causality test results cannot be relied upon because formal tests reveal strong evidence of nonlinearity and structural breaks between stock return and the index of manager sentiment. Hence, linear Granger causality tests are misspecified. When we use the nonparametric causality-in-quantiles test instead, our results confirm the main hypothesis of our paper that manager sentiment can predict stock market volatility (barring at the extreme upper end of the conditional distribution), besides returns, but the index is found to be a relatively stronger predictor for volatility than stock return.
Note that, accurate prediction of volatility is of importance due to several reasons: Firstly, when volatility is interpreted as uncertainty, it becomes a key input to investment decisions and portfolio choices. Secondly, volatility is the most important variable in the pricing of derivative securities, with one needing reliable estimates of the volatility of the underlying assets to price an option. Thirdly, financial risk management according to the Basle Accord as established in 1996 also requires prediction of volatility as a compulsory input to risk management for financial institutions around the world. Finally, financial market volatility, as witnessed during the recent global crisis, can have wide repercussions on the economy as a whole, via its effect on real economic activity and public confidence. Hence, estimates of market volatility can serve as a measure for the vulnerability of financial markets and the economy, and can help policymakers design appropriate policies. Evidently, appropriate prediction of the process of volatility based on corporate managers’ sentiment has ample implications for portfolio selection, the pricing of derivative securities and risk management.
Endnote
1. The only paper that is somewhat related to this paper is the study by Balcilar et al. (2018c), wherein the authors, using the nonparametric causality-in-quantiles approach, showed that dispersion in active managers’ risk exposures to the stock market can predict (realized) volatility of the S&P 500 over the range of quantiles that correspond to moderately high levels of market volatility.
2. http://www.hec.unil.ch/agoyal/
3. http://apps.olin.wustl.edu/faculty/zhou/
4. Standard unit root tests, details of which are available upon request from the authors, revealed that both SR and MSI are stationary and hence, satisfies the requirement of using mean-reverting data for the causality-in-quantiles test.
5. As a robustness check, given that the S&P 500 data is available at daily frequency (at https://finance.yahoo.com/); we computed an alternative measure of volatility, namely realized volatility (RV). As suggested by Andersen and Bollerslev (1998), RV was defined as the sum of squared daily returns over a month. When we used RV as the dependent variable, MSI was found to predict it only at the quantile range of 0.30 to 0.35. Interestingly, when we created Good- and Bad-RVs, based on sum of squared daily positive and negative returns over a month, we found that MSI predicted Good-RV over the quantile range of 0.10 to 0.90, while in case of Bad-RV, weak causality was observed for the quantile range of 0.15 to 0.25. In other words, MSI tends to predict good volatility rather than bad. Complete details of these results are available upon request from the authors. But, as suggested by Balcilar et al. (2018d), since squared returns as a measure of volatility follows directly from the kth order test (and is independent of a model-based estimate of volatility), the use of squared return to capture volatility is more appropriate in our context
6. Interestingly, when we used the k-th order nonparametric causality in quantiles test to compare the predictability of the MSI relative to the investor sentiment indexes of Baker and Wurgler (2006) and Huang et al. (2015) (derived from: http://apps.olin.wustl.edu/faculty/zhou/), and the University of Michigan consumer sentiment index (obtained from the FRED database of the Federal Reserve Bank of St. Louis), we found that the investor sentiment index of Baker and Wurgler (2006) was the strongest predictor of stock returns over the quantile range of 0.35 to 0.90, while the consumer sentiment performed the best over 0.10 to 0.30. Hence, unlike the result of Jiang et al. (2018), whereby the MSI outperformed all these indexes based on linear predictive regression models, we find that, when controlled for misspecification using a nonparametric approach, the performance of the MSI in fact is relatively weak when it comes to predicting stock return. In terms of volatility however, the performance of all these sentiment indices was equally good and hence, inseparable. Complete details of these results are available upon request from the authors.
Appendix
SR is S&P 500 stock return; MSI is manager sentiment index; Std. Dev: stands for standard deviation; p-value corresponds to the Jarque-Bera test with the null of normality (Table A1).
| Table A1: Summary Statistics | ||
| Variable | ||
|---|---|---|
| Statistic | SR | MSI |
| Mean | 0.5904 | 0.0081 |
| Median | 1.2047 | 0.1785 |
| Maximum | 10.2307 | 1.5000 |
| Minimum | -18.5637 | -3.5720 |
| Std. Dev. | 4.0927 | 1.0013 |
| Skewness | -1.0971 | -1.4642 |
| Kurtosis | 6.1756 | 5.5905 |
| Jarque-Bera | 89.3950 | 91.7175 |
| p-value | 0.0000 | 0.0000 |
| Observations | 144 | |
| Table a2 : Brock et al. (1996, bds) test of nonlinearity | |||||
| Independent Variable | M | ||||
|---|---|---|---|---|---|
| 2 | 3 | 4 | 5 | 6 | |
| MSI | 4.9913*** | 4.8249*** | 5.3800*** | 5.9185*** | 6.2092*** |
Note: *** indicates rejection of the null hypothesis at 1 percent level of significance (Table A2).
SR is S&P 500 stock return; MSI is manager sentiment index (Figure A1 & Figure A2).

Figure A1:DATA PLOTS.

Figure A2:Causality-In-Quantiles Test Result For Squared Returns (Volatility) Of The S&P 500.
References
- Andersen T.G., &amli; Bollerslev, T. (1998). Answering the skelitics: Yes, standard volatility models do lirovide accurate forecasts. International Economic Review, 39(4), 885-905.
- Bai, J., &amli; lierron, li. (2003). Comliutation and analysis of multilile structural change models. Journal of Alililied Econometrics, 18(1), 1-22.
- Baker, M., &amli; Wurgler, J. (2006). Investor sentiment and the cross-section of stock returns. Journal of Finance, 61(1), 1645–1680.
- Balcilar, M., Gulita, R., &amli; Kyei, C. (2018a). liredicting stock returns and volatility with investor sentiment indices: A reconsideration using a nonliarametric causality-in-quantiles test. Bulletin of Economic Research, 70(1), 74-87.
- Balcilar, M., Gulita R., Nguyen D.K., &amli; Wohar, M.E. (2018b). Causal effects of the United States and Jalian on liacific-Rim stock markets: Nonliarametric quantile causality aliliroach. Alililied Economics, 50(53), 5712-5727.
- Balcilar, M., Dmirer, R., Gulita, R., &amli; Wohar, M.E. (2018c). Differences of oliinion and stock market volatility: Evidence from a nonliarametric causality-in-quantiles aliliroach. Journal of Economics and Finance, 42(2), 339-351.
- Balcilar, M., Gulita, R., liierdzioch, C., &amli; Wohar, M.E. (2017). Do terror attacks affect the dollar-liound exchange rate? A nonliarametric causality-in-quantiles analysis. The North American Journal of Economics and Finance, 41(1) 44-56.
- Balcilar, M., Gulita, R., liierdzioch, C., &amli; Wohar, M.E. (2018d). Terror attacks and stock-market fluctuations: Evidence based on a nonliarametric causality-in-quantiles test for the G7 countries. Euroliean Journal of Finance, 24(4), 333-346.
- Brock, W., Dechert, D., Scheinkman, J., &amli; LeBaron, B. (1996). A test for indeliendence based on the correlation dimension. Econometric Reviews, 15(1), 197–235.
- De Long, J.B., Shleifer, A., Summers, L.H., &amli; Waldmann, R. (1990a). Noise trader risk in financial markets. Journal of liolitical Economy, 98(1), 703–738.
- De Long, B.J., Shleifer, A., Summers, L.H., &amli; Waldmann, R. (1990b). liositive feedback investment strategies and destabilizing rational slieculation. Journal of Finance, 45(1)379–395.
- Huang, D., Jiang, F., Tu, J., &amli; Zhou, G. (2015). Investor sentiment aligned: A liowerful liredictor of stock returns. Review of Financial Studies, 28(1), 791–837.
- Jeong, K., Härdle, W.K., &amli; Song, S. (2012). A consistent nonliarametric test for causality in quantile. Economic Theory, 28(1), 861–887.
- Jiang, F., Lee, J., Martin, X., &amli; Zhou, G. (2017). Manager sentiment and stock returns.
- Kumari, J., &amli; Mahakud, J. (2015). Does investor sentiment liredict the asset volatility? Evidence from emerging stock market India. Journal of Behavioral and Exlierimental Finance, 8(1), 25–39.
- Kumari, J., &amli; Mahakud, J. (2016). Investor sentiment and stock market volatility: Evidence from India. Journal of Asia-liacific Business, 17(2), 173-202.
- Nishiyama, Y., Hitomi, K., Kawasaki, Y., &amli; Jeong, K. (2011). A consistent nonliarametric test for nonlinear causality-sliecification in time series regression. Journal of Econometrics, 165(1), 112-127.
- Shefrin, H. (2008). A behavioral aliliroach to asset liricing. Elsevier Academic liress, New York.
- Zhou, G. (2017). Measuring investor sentiment.