Research Article: 2018 Vol: 22 Issue: 2
Market Reaction to Split Announcements: Rational Response or Behavioural Bias?
Mohammad A. Karim, Marshall University
Rathin Rathinasamy, Ball State University
Syed K. Zaidi, California State University San Marcos
Keywords
Stock Splits, Growth Options, Equity Mispricing.
JEL classification
G14, G32
Introduction
Stock splits are costly corporate decisions that do not change the underlying fundamentals of the firm. Still, on average, the stock market reacts positively to stock split announcements (Fama, Fisher, Jensen, & Roll, 1969; Ikenberry, Rankine, & Stice, 1996). Despite forty years of research, market reaction to stock splits is not fully understood. A number of theories attempt to explain the existence of stock splits and the positive market reaction to split announcements. Extant literature attempts to provide rational explanation of the positive market reaction surrounding announcement date. These studies postulate that stock split serves as signals to the future performance of the firm (Grinblatt, Masulis & Titman, 1984, Brennan & Copeland, 1988b, Huang, Liano, Manakyan & Pan, 2008) and hence reduces information asymmetry between inside and outside investors, increases investor base (Dyl & Elliott, 2006) and hence reduces cost of capital and increases stock price, increases liquidity (Lin, Singh & Yu, 2009) and move the price to a desired price range (Dyl & Elliott, 2006). These studies generally indicate that split announcement is good news to investors as it suggests future growth prospects of the firm and/or current undervaluation of the stock price. After the split announcement market attempts to correct the under-pricing and hence we observe a positive reaction around announcement date.
More recently, there are some research that relates stock splits to managerial opportunistic behaviour and market imperfections (Baker, Greenwood, & Wurgler, 2009, Birru & Wang, 2016). Stock splits can be considered as a response by insiders (managers) where the premium for lower price stocks and limits to arbitrage prevent outsiders to correct the mispricing (Baker et al., 2009). Another explanation postulates that investors suffer from an illusion where they believe that low price stocks have more room to grow and they are willing to pay higher prices than true intrinsic value (Birru & Wang, 2016). Contrary to the rational theories, these theories postulate a role of mispricing related to stock splits. This paper attempts to examine these two competing explanations using market reactions during split announcements.
Researchers use market-to-book ratio or some variant of that ratio to estimate the mispricing (Ikenberry et al., 1996; Baker et al., 2009). However, extant literature also uses market-to-book ratio as a proxy for growth opportunities which raises a question about its representation. To avoid these conflicting explanations, Therefore, we need better proxies for equity mispricing and growth opportunities. In this paper, we attempt to do that. We employ a market-to-book ratio decomposition approach to separate it into rational and behavioural components and then examine how these components are related to split announcement returns. Using both univariate and multivariate analysis we find that split announcement return is significantly related to mispricing component of the market-to-book ratio. In addition, firms with significantly higher growth opportunities also exhibit positive relationship with split announcement return.
This paper contributes to the existing split literature in the following ways. First, it relates market reactions to split announcements to a rational and a behavioural component by decomposing market-to- ratio. This provides a cleaner examination of two competing explanations using the same event. Second, it provides incremental evidence to more recent behavioural explanations of stock splits. The remainder of the paper is structured as follows. Section 2 provides a literature review on stock split theories mostly concentrating on signalling theory and firm performance and outlines our hypotheses. Section 3 describes the Rhodes-Kropf et al. (2005) decomposition and data. Section 4 provides empirical results and section 5 concludes the paper.
Literature Review And Hypotheses Development
Stock split is a cosmetic event that does not change the fundamentals of firms. Still we observe positive market reaction to stock split announcements. Many theories attempt to explain this puzzle suggesting different and sometimes competing explanations. Two of the rational theorems of stock splits are signalling theory and optimal price theory. Signalling theory is one of the well-studied rational theories that directly relates firm valuation to split decisions. Signalling theory considers stock split as a potential signal to the market about undervaluation and/or future growth prospects of the firm (Fama et al., 1969; Brennan & Copeland, 1988b; McNichols & Dravid, 1990; Kadiyala & Vetsuypens, 2002). Brennan & Copeland’s (1988b) signalling model proposes that there is information asymmetry between inside and outside investors. Managers use stock splits to signal quality and growth prospects of the firm in an attempt to reduce information asymmetry. Hence after the split announcement stock market reacts positively. However, studies that examine signalling hypothesis of stock splits report mixed results. Although there is a considerable amount of evidence contrary to the signalling hypothesis ((Easley, O'Hara, & Saar, 2001; Byun & Rozeff, 2003; Huang, Liano, Manakyan, & Pan, 2008), a number of studies find support for the signalling hypothesis (Grinblatt et al., 1984; Brennan & Copeland, 1988b; Ikenberry et al., 1996; Desai & Jain, 1997). The empirical support for signalling theory is largely inconclusive (He & Wang, 2012).
The optimal price hypothesis postulates that there is an optimal price range for stocks in the market and firms want to keep their share prices to that optimal level. If the price of a stock is too high compared to the optimal price range, firm may lower the price by splitting the stock (Lakonishok & Lev, 1987; Dyl & Elliott, 2006). Although the optimal price hypothesis does not discuss whether higher pre-split price is due to the growth opportunities of a firm or due to an overvaluation, Lakonishok & Lev (1987) find that splitting firms have higher price levels compared to non-splitters in pre-split period and after split such price difference disappears.
More recently a number of studies, that may support the behavioural explanation of stock splits, re-iterates the importance of having stock price to a certain level. Weld, Michaely, Thaler, and Benartzi (2009) proposes ‘Norm theory’ of share price and document that since the 1930s, equally weighted and value weighted average share prices of US firms remain constant at about $25 and $35, respectively. Firms use stock splits to conform to this norm although conforming to the norm may not have any economic incentive. On the other hand, ‘Catering theory’ (Baker et al., 2009) considers conforming to such norm may have an economic incentive and considers stock split as an arbitrage activity. According to this theory, managers split their stocks if there is demand for particular stocks in a particular price range. More specifically, if there is a relative overvaluation of low-priced firms (they labelled it as ‘low-price premium’ measured as the log difference between the average market-to-book ratio of low nominal price firms and that of high nominal price firms), managers respond by supplying low-price shares through splits. Although this theory does not explain whether the splitting firms are over or undervalued, but it posits that market-wide relative overvaluation of low-priced firms (not necessarily small cap firms) or conversely, relative undervaluation of higher priced firms motivates higher priced firms to split their stocks. Although these studies establish that nominal share price matters but the question ‘why price matters?’ is largely unaddressed. Birru & Wang (2016) attempt to answer this question. The authors find that investors have systematic bias in overestimating return from a low priced stocks i.e., investors believe that low-priced stocks have more room to grow than high-priced stocks. Using stock split announcement date and ex-split date (they day actual split takes place), they find that investors, expectation of skewness drastically increase on the ex-date, not the split announcement day. They conclude that this finding is contrary to the signalling hypothesis and consistent with the view that investors suffer from a psychological bias which the authors label as ‘nominal price illusion’.
Another behavioural explanation that relates equity misvaluation to stock splits views such event as a result of managerial opportunistic behaviour. This explanation critically depends on the fact that market reacts positively to split announcements. This explanations postulates that managers split stocks to reward existing shareholders. Guo, Liu, and Song (2008) find that acquiring firms split their stocks prior to stock based acquisition announcement so they can pay the target shareholders with overvalued equity. Stocks split serve as a wealth transfer mechanism from target shareholders to acquiring stockholders.
Positive market reaction surrounding split announcement surely indicates that investors consider stock splits as good news. Several studies examining signalling role of stock splits use stock-split announcement returns as evidence. Ikenberry et al. (1996) examine the relationship between market-to-book ratio (as a proxy for undervaluation) and abnormal announcement return of splitting firms. Contrary to the undervaluation signalling hypothesis, the authors find that high market-to-book (glamour) stocks have relatively higher abnormal announcement return compared to low market-to-book (value) stocks, although both types of splitting provides positive returns. Karim & Sarkar (2016) find that split firms are overvalued rather than undervalued in presplit year. Such overvaluation is the highest in split announcement year and gradually declines after split announcement. Contrary to the signalling hypothesis which postulates undervaluation or high growth opportunities of splitting firms, these findings suggest that splitting firms are overvalued, which is consistent with the behavioural explanation of stock split.
Previous literature does not clearly examine whether stock splits are used to signal undervaluation or growth opportunities or both and how market reacts based on the mispricing and the growth opportunities of the firm. It is precisely the question that is the main topic of our study. One concern in investigating whether stock splits are related to signalling under valuation or growth opportunities is that, generally the same proxy is used for both: either Market-to-book ratio or some other form of Tobin’s Q. The existing literature documents that abnormal returns around stock splits are positively related to the market-to-book ratio (Ikenberry et al., 1996). However, it is not clear what a high market-to-book ratio truly represents. Is it an abundance of growth opportunities or misvaluation or both? Although Lakonishok, Shleifer, and Vishny, and Vishny (1994) and Haugen (1995) suggest that market-to-book ratio is a measure of misvaluation but it is generally used as a proxy for growth opportunities of the firms in the literature. If the market is efficient then market-to-book ratio represents future growth prospects of the firm and such prospects should reflect in market prices. However, given the fact that market-to-book ratio (or Tobin’s Q) may proxy either for valuation errors or for growth opportunities, it is difficult to examine the role of mispricing and growth opportunities on stock splits using such proxy. This paper attempts to overcome this limitation using a decomposition of market-to book ratio into a growth opportunity and a misvaluation component (Rhodes-Kropf et al., 2005; RKRV hereafter).
To examine the rational and behavioural explanations of stock splits, we relate market reaction surrounding split announcements to immediate pre-split announcement year overvaluation and growth opportunities of the split firms. If stock splits signal undervaluation or high growth opportunities of the stocks then we may observe subsequent reduction in information asymmetry and correction of the market price after the split announcement. More specifically, we hypothesize that if firms split their stock to reduce information asymmetry and to signal growth opportunities and/or undervaluation of the equity then we may observe positive market reaction for firms with undervalued equity and higher growth opportunities. In support of the rational explanation, we may also observe that splitting firms with overvalued equity and low growth options should have negative market reaction at announcements or negative abnormal announcement return. On the other hand, if firms split stocks for behavioural factors such as markets preference for lower priced stocks in anticipation that lower priced stocks have more room to grow or stock split facilitates wealth transfer to acquiring shareholders from target shareholders in the event of mergers and acquisitions, we hypothesize that overvalued firms and/or firms with low growth opportunities may observe positive market reaction and be rewarded with positive abnormal announcement returns.
Data And Model Development
The analyses of this study depend critically on the proper identification of mispricing and growth options. In order to accomplish this, we employ a methodology developed by RKRV (2005) which decomposes market-to-book ratio into misvaluation and growth components. This decomposition has been used in earlier literature in settings such as mergers (RKRV, 2005), SEOs (Hertzel and Li, 2010) ,and industry wide misvaluation (Hoberg & Phillips, 2010). RKRV (2005) decompose the market-to-book ratio into a misvaluation and a growth option component as represented by equation 1:
M/B = M/V * V/B (1)
Where M, V and B represent market value, intrinsic value and book value of equity, respectively. Market value and book value of equity are directly observable from stock markets and financial statements, but intrinsic value requires estimation. M/B represents the market-tobook ratio, M/V represents misvaluation and V/B represents the growth option component. The log form of equation (1) is as follows:
m–b = (m–v) + (v–b) (2)
Where the lower case letters denote the log form of corresponding market, book or intrinsic values. RKRV argue that if market anticipates future growth rates, discount rates and cash flows perfectly, there would be no place for pricing errors and (m–v) would always be zero. In this case the term (v–b) would equal to the log of M/B. However, if the market does make mistakes then the price-to-true-value (m–v) captures the misvaluation component. RKRV (2005) then goes a step further and attribute misvaluation not only to a firm specific component, but also to a sector specific component. Hence, RKRV (2005) decompose the log of market-to-book into three separate components: a firm specific misvaluation component, a sector specific misvaluation component and a difference between valuations based on long-run value and book value (labelled long-run-value-to-book/growth option component). To estimate these components they express v as a linear function of firms’ specific accounting information at a point in time θitand conditional accounting multiples,  where i, j and t represents firm, industry and year, respectively.

Fundamental value  is calculated using time-series average conditional regression coefficients and long run value
  is calculated using the industry average of time series regression coefficients. The firm specific misvaluation component
 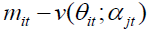 captures the deviation from fundamental value, the sector specific component
 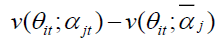 captures the time series deviation from long run value and the final component
 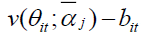 captures the deviation from the book value. In the analyses, this paper focuses on the firm specific error and we label it as mispricing. The third component captures the growth options of the firm and we refer to it as growth options interchangeably with long-runvalue- to-book.
This study follows RKRV (2005) and estimate the intrinsic value of equity using their full model which links market value of equity with book value of equity, net income and leverage in explaining the cross sectional variation in market values. The equation for their model 3 is as follows:

Where NI+ represents absolute value of net income, I is an indicator variable represents negative value of net income and LEV represents leverage.
We collect our split sample from CRSP (Centre for Research in Security Prices) database and financial statements data from Standard and Poor’s Compustat database. This study implements the RKRV methodology in the following way. First, using all firm year observations from the merged CRSP and Compustat database between fiscal year 1971 and 2014, we estimates the parameters of the model (similar to Table 4 in RKRV, 2005). We require that the necessary variables are present to estimate the components of market-to-book. In addition, book value of equity (Compustat mnemonic: CEQ) needs to be positive.
First we decompose market-to-book ratio for all firm-years from 1971-2014 using CRSP and Compustat data. We apply the following filters: the end of the year share price has to be at least $1 and the share code (CRSP mnemonic: SHRCD) has to be 10 or 11 (ordinary common shares). We are able to decompose market-to-book ratio for 148,396 firm-year observations. We proceed by identifying splitting and non-splitting firms during the 1971 to 2014 period from CRSP database.
Our initial split sample has 14,456 split observations. We then apply the same filters as Lin, Singh & Yu (2009) to generate our final splitting sample. These filters are, to be included in the splitting sample, the pre-split (five trading days before split announcement) share price has to be at least $10, the split factor (CRSP mnemonic: FACPR) has to be 1 or higher and the CRSP Factor to Adjust Price (CRSP mnemonic: FACPR) has to equal to the CRSP Factor to Adjust Shares Outstanding (CRSP: FACSHR). These filters reduce the split sample to 6,475 observations. When we require split observations to have five trading days (-2 to +2 days) stock return data surrounding split announcement to calculate the abnormal return, our sample size further reduces to 4,861 observations. Finally, when we require to have market-to-book decomposition data available for split firms, our final split sample has 4,577 observations. We then separate the split and non-split samples from our market-to-book decomposition sample. We identify 4,577 firm years in which firms split at least once and 138,758 firm years are labelled as non-splitting years. Table 1a, Panel A presents the distribution of the sample firms by year. During our sample period the number of splitting firms varies widely, from 2 in fiscal year 2014 (or less than 0.1 percent of the sample firms in that year) to 236 (or 5.2 percent of the sample firms) in 1982. However, splits occur in all of our sample years. In Table 1b, Panel B we report the industry distribution of our sample firm years, based on the 12 Fama-French industry classification. All 12 industries are well represented in the splitting sample. In our splitting sample, Business Equipment and Finance industries have the most number of (19.8% and 16.1%, respectively) and Telephone and Television Transmission have the fewest number of splits (2.5%).
| Table 1a: Distribution Of Stock Splits By Fiscal Year And Industry | ||||||
| Panel A: Distribution by fiscal year | ||||||
|---|---|---|---|---|---|---|
| Year | n | % of Total | Year | n | % of Total | |
| 1971 | 62 | 1.4 | 1993 | 130 | 2.8 | |
| 1972 | 67 | 1.5 | 1994 | 185 | 4.0 | |
| 1973 | 26 | 0.6 | 1995 | 217 | 4.7 | |
| 1974 | 27 | 0.6 | 1996 | 218 | 4.8 | |
| 1975 | 74 | 1.6 | 1997 | 208 | 4.5 | |
| 1976 | 67 | 1.5 | 1998 | 188 | 4.1 | |
| 1977 | 87 | 1.9 | 1999 | 207 | 4.5 | |
| 1978 | 73 | 1.6 | 2000 | 88 | 1.9 | |
| 1979 | 136 | 3.0 | 2001 | 74 | 1.6 | |
| 1980 | 155 | 3.4 | 2002 | 72 | 1.6 | |
| 1981 | 64 | 1.4 | 2003 | 121 | 2.6 | |
| 1982 | 236 | 5.2 | 2004 | 132 | 2.9 | |
| 1983 | 166 | 3.6 | 2005 | 103 | 2.3 | |
| 1984 | 118 | 2.6 | 2006 | 76 | 1.7 | |
| 1985 | 210 | 4.6 | 2007 | 32 | 0.7 | |
| 1986 | 188 | 4.1 | 2008 | 7 | 0.2 | |
| 1987 | 79 | 1.7 | 2009 | 14 | 0.3 | |
| 1988 | 83 | 1.8 | 2010 | 33 | 0.7 | |
| 1989 | 87 | 1.9 | 2011 | 25 | 0.5 | |
| 1990 | 77 | 1.7 | 2012 | 35 | 0.8 | |
| 1991 | 144 | 3.1 | 2013 | 30 | 0.7 | |
| 1992 | 154 | 3.4 | 2014 | 2 | 0.0 | |
| Total | 4,577 | 100.0% | ||||
| Table 1b: Distribution Of Stock Splits By Fiscal Year And Industry | ||
| Panel B: Distribution by Fama-French 12 industry classification | ||
|---|---|---|
| Industry | n | % |
| Consumer Non-Durables | 336 | 7.3 |
| Consumer Durables | 118 | 2.6 |
| Manufacturing | 598 | 13.1 |
| Energy | 199 | 4.3 |
| Chemicals and Allied Products | 156 | 3.4 |
| Business Equipment (Computers, software etc.) | 908 | 19.8 |
| Telephone and Television Transmission | 114 | 2.5 |
| Utilities | 158 | 3.5 |
| Wholesale, Retail and some services | 483 | 10.6 |
| Healthcare, Medical equipment and drugs | 338 | 7.4 |
| Finance | 737 | 16.1 |
| Others (Mines, Construction, Entertainment etc.) | 432 | 9.4 |
| Total | 4,577 | 100.0% |
Empirical Results
Firm Characteristics of Split and Non-Split Firms
In Table 2 we show the univariate characteristics of both split and non-splitting firms. In addition to several firm characteristics (in panel A), we also show the misvaluation and growth option components of the splitting and the non-splitting firms in panel B. First, we find that splitting firms are relatively larger in size compared to non-splitting firms in various size related measures. The mean and the median total assets are $3.8 billion and $375 million, dollars respectively for firms that split compared to $3.6 billion and $178 million, respectively for firms that do not split. When we compare total market equity (CRSP mnemonic: PRC times CRSP mnemonic: SHROUT) and book equity (Compustat mnemonic: CEQ), we also find that splitting firms are substantially larger than non-splitting firms. We also find that splitting firms have significantly higher share prices (CRSP mnemonic: PRC) compared to non-splitting firms. The mean (median) share price for splitters is $47.49 (40.50) whereas the mean (median) share price for non-splitters is $27.40 ($13.31). Splitting firms also perform better when we look at the differences in Return on Assets (ROA, defined as Compustat mnemonic: NI/Compustat mnemonic: AT) and Return on Equity (ROE, defined as [Compustat mnemonic: CSHO times Compustat mnemonic: EPSPX]/Compustat mnemonic: CEQ). Splitting firms outperform 8.43% and 50.57% compared to non-splitters in ROA and ROE, respectively. Moreover, splitters are significantly less levered compared to non-splitters.
| Table 2: Univariate Comparison Of Firm Characteristics Between Splitting And Non-Splitting Firms | |||
| Characteristics | Split firms | Non-split firms | Difference split- non-split t/Wilcoxon Z |
|---|---|---|---|
| Mean Median | Mean Median | ||
| Panel A: Firm characteristics of splitting and non-splitting firms | |||
| Total assets (millions) | 3,816.25 375.84 | 3,666.23 178.61 | 150.02 197.22*** |
| Market equity (millions) | 3,736.14 433.28 | 1,726.55 111.80 | 2,009.59*** 321.48*** |
| Book equity (millions) | 925.29 149.39 | 741.01 70.35 | 184.28*** 79.03*** |
| Common shares outstanding (millions) | 49.34 10.96 | 52.38 10.15 | -3.04*** 0.82* |
| Price per share | 47.49 40.50 | 27.40 13.31 | 20.08*** 27.19*** |
| Return on assets (ROA) | 8.16% 8.07% | -0.28% 4.01% | 8.43%*** 4.06%*** |
| Return on Equity (ROE) | 15.08% 16.30% | -35.49% 9.31% | 50.57%** 6.99%*** |
| Leverage | 0.28 0.24 | 0.40 0.38 | -0.12*** -0.14*** |
| Panel B: Misvaluation and growth option components of splitting and non-splitting firms | |||
| M/B | 4.48 2.56 | 3.31 1.54 | 1.17*** 1.02*** |
 |
1.18 1.08 | 0.54 0.46 | 0.64*** 0.63*** |
| Firm Specific misvaluation | 0.26 0.19 | -0.01 -0.03 | 0.28*** 0.22*** |
| Sector specific misvaluation | 0.09 0.11 | 0.02 0.06 | 0.07*** 0.05*** |
| Total misvaluation (firm + sector) | 0.35 0.28 | 0.01 -0.02 | 0.34*** 0.30*** |
| Growth options | 0.83 0.87 | 0.53 0.51 | 0.30*** 0.36*** |
| % of firms overvalued (Firm Specific misvaluation >0) | 70.09% | 47.13% | 22.96% |
| % of firms with positive growth (Growth options >0) | 97.36% | 82.79% | 14.57% |
| N | 4,577 | 138,758 | |
Finally and most importantly we find that the market-to-book of splitting firms is much higher than the market-to-book of non-splitting firms. The average (median) market-to-book ratio for splitting firms is 4.48 (2.56), the average (median) market-to-book ratio of non-splitting firms is 3.31 (1.54). Not surprisingly, the differences in mean and median between the two sub samples are highly significant. Comparing three components of the market-to-book ratio we find that both mispricing components are significantly higher for splitting firms. For example, firm specific misvaluation component is 0.26 for splitters compared to -0.01 for non-splitters. More importantly, the difference in growth options components between splitting firms and non-splitting firms exhibit similar differences (0.83 vs. 0.53). We also report the percentages of firms that are overvalued (positive total misvaluation) and have positive growth options. We find that 70.09% of splitters are overvalued whereas 47.13% of the non-splitters are overvalued. In case of growth options, more than 97% of the splitting firms have positive growth options, whereas about 83%% of the non-splitters have positive growth options. In short, these results suggest that splitting firms not only have a higher market-to-book ratio, but that they seem to be more mispriced (overvalued) and seem to have more growth options.
Abnormal Returns Surrounding Split Announcement Date
An important part of our analysis focuses on abnormal returns around the split announcement. We report the abnormal returns from our event study in Table 3. We calculate the abnormal return by subtracting the value weighted index, equal weighted index, and S&P composite index returns from the daily return. Mean and median cumulative abnormal returns are reported in Table 3 for 2 days (split announcement day and 1 day after split announcement day) and 3 days ( -1, 0 and +1 days) surrounding split announcements. Consistent with the earlier split literature (Ikenberry et al., 1996), the splits in our sample have abnormal announcement returns between 1.90% and 3.24%. We use the value weighted index adjusted cumulative abnormal return (CAR) for 3 days surrounding the split announcement in our subsequent abnormal return analysis.
| Table 3: Cumulative Abnormal Returns Around Split Announcement Date | |||
| Event window | Cumulative abnormal return (Mean / Median) | ||
|---|---|---|---|
| Equal Weighted | Value Weighted | S&P composite index adjusted | |
| Announcement date (0 to +1) | 2.78%*** 1.90%*** | 2.87%*** 1.98%*** | 2.90%*** 2.00%*** |
| Announcement date (-1 to +1) | 3.09%*** 2.13%*** | 3.21%*** 2.21%*** | 3.24%*** 2.23%*** |
| Notes: This table reports cumulative abnormal split announcement returns (equally weighted index, value weighted index and S&P composite index adjusted) over different event windows with a split factor of greater than 1 or more. ***, **, * represents significance level at 0.1%, 1% and 5% level, respectively. | |||
Stock Price Surrounding Split Announcements
We know that there is stock price run up in pre-split period. Lakonishok and Lev (1987) examine stock price 60 months surrounding split announcement month and compare it to a control sample of non-splitters based on industry and size. They find that the price difference between split firms and non-splitting control firms starts around forty eight months before split announcement and the difference monotonically grows until the split announcement month. The difference between splitters and non-splitters is around 70% in split announcement month. They also document an astounding ninety-six percent price growth of splitting firms over this five-year period. In post announcement period, within four months, the price gap between splitters and non-splitters disappears.
First, we attempt to re-examine the price change of splitters using finer stock price data. Rather than using monthly data we use daily stock price data to better capture the timing of the change. We use daily stock price data of splitting firms surrounding two hundred trading days of split announcement. We examine the stock price of splitting firms surrounding announcements in two different ways. First, we convert the nominal share price to a time series standardized stock price for each firm and calculate the mean and median standardized price from -100 trading days to +100 trading days surrounding the split announcement day. Figure A graphically shows the standardized price rise. From Figure A, we see that both mean and median standardized price rises monotonically until the announcement day. At announcement day, we observe a sudden jump in both mean and median prices and then although increasing but the price increase seems significantly less compared to the pre-split period. The mean standardized price becomes almost flat after 80 trading days.

Figure A:Standardize Stock Price Surrounding Split Announcements.
Second, we calculate the daily nominal price change from -100 trading days to +100 trading days surrounding split announcements. Figure B shows the mean daily price change surrounding 200 trading days of split announcements. From -100 days to -1 day, the daily price change is not only positive, but also increasing at 0.20% to 0.40%. We observe a spike in price change (around 1.7%) in three days surrounding announcement days. Although the price change is still positive but it slowly declines to close to zero in next 100 trading days after split announcement.

Figure B:Daily Stock Price Change Surrounding Split Announcements.
These findings are similar to Lakonishok & Lev (1987) and are consistent with the idea that there is significant price run up in pre-split announcement period. But such pattern is not as notable in post-split period. Now the question arises whether the pre-split price change in relatively short period of time (100 trading days before announcement) is solely due to the rational expectations of superior future performance of the firm or the market overreaction to the future growth potential of the firm and hence rewarding overvalued valued firms irrationally during split announcements. The following sub-sections explore this issue.
Abnormal Announcement Return and Growth Options and Mispricing
Next we directly relate market-to-book components to split announcement returns. Table 3 shows that split announcements exhibit positive abnormal returns. However, when we bifurcate our sample by misvaluation and growth options, quartiles, we find substantial cross sectional variation. The results pertaining to this analysis are provided in Table 4.
| Table 4: Abnormal Returns Across Misvaluation And Growth Options Quartiles | ||||||
| Cumulative Abnormal Return (%) (Mean/Median/N) | Mean/median differences between high and low growth quartiles | |||||
|---|---|---|---|---|---|---|
| Growth options quartiles | ||||||
| Misvaluation quartiles | (1) Q1 - Low | (2) Q2 | (3) Q3 | (4) Q4 - High | Total | (4-1) |
| (a) Q1 - Low | 4.06** 2.46*** 34 | 4.39*** 3.32*** 60 | 4.35*** 2.96*** 153 | 5.01*** 2.64*** 168 | 4.60*** 2.88*** 415 | 0.96 0.18 |
| (b) Q2 | 3.18*** 1.98*** 111 | 3.00*** 1.80*** 185 | 2.56*** 1.89*** 291 | 2.74*** 2.35*** 298 | 2.79*** 2.08*** 885 | -0.44 0.37 |
| (c) Q3 | 2.92*** 1.69*** 149 | 2.45*** 1.97*** 333 | 2.74*** 2.08*** 429 | 3.01*** 2.45*** 470 | 2.78*** 2.11*** 1381 | -0.08 0.76 |
| (d) Q4 - High | 2.55*** 1.06*** 135 | 2.06*** 1.62*** 287 | 3.82*** 2.46*** 453 | 3.73*** 2.88*** 1021 | 3.42*** 2.24*** 1896 | 1.17 1.82* |
| Total | 2.96*** 1.90*** 429 | 2.57*** 1.86*** 865 | 3.26*** 2.20*** 1326 | 3.52*** 2.59*** 1957 | 3.21*** 2.21*** 4577 | 0.56 0.31 |
| Mean/median differences between low and high misvaluation quartiles (a-d) | 1.50 1.40 | 2.33** 1.70** | 0.53 0.50 | 1.28* -0.24 | 1.18*** 0.67 | |
| Notes: This table reports mean/median abnormal return and number of observations of split samples across total misvaluation and growth option quartiles. Total misvaluation and growth options are calculated following RKRV (2005) and quartiles are relative to the splitting firms only. ***, **, * represents significance level at 0.1%, 1% and 5% level, respectively. | ||||||
In order to bifurcate the sample, we create a simple four-by-four matrix in which we assign quartiles for firm specific misvaluation and growth options for each observation (This bifurcation is based on all split and non-split firms, i.e., the misvaluation or growth option quartiles are relative to all firms as stated in Table 2). Rows and columns represent different quartiles of misvaluation and growth options, respectively. For example, the upper left cell contains the mean and median abnormal return for 34 observations which are in the most undervalued (low errors) quartile and have the lowest growth options. The mean abnormal return is 4.06 percent whereas the median abnormal return is 2.46 percent. In contrast, the mean (median) abnormal return for split announcements of firms that are the most mispriced (high firm specific error quartile) and have the most growth options (high growth options quartile) is 3.21 percent (2.21 percent). Several important patterns emerge from this analysis. First, by keeping the growth option quartile constant (column wise), splitting firms in the most overvalued quartile earn lower returns than undervalued firms across all quartiles. For example, in the lowest growth option quartile, the most overvalued splitters exhibit an abnormal return of 2.55%, whereas the most undervalued firms earn 4.06%. However, only in the 2nd and 4th growth, quartiles, differences between overvalued and undervalued quartiles are significant (i.e., 2.33% in 2nd and 1.28% in 4th quartile). Second, ignoring the growth options, the difference between the highest overvalued and the most undervalued quartile (column 5) is significant (mean of 1.18%). Similarly, when we keep the misvaluation quartiles constant (row wise), high growth firms always earn higher returns compared to lower growth firms. Here, the differences are insignificant in the first, second, and third, quartile. To be specific, for the most overvalued splitters, the difference between the low and high growth firms is 1.17%. Overall, these findings suggest a very weak support for signalling hypothesis. Our finding that the abnormal return is relatively high when the splitting firm is relatively overvalued (i.e., the bottom row in 4*4 matrix), is contrary to the signalling hypothesis of splits signals undervaluation and suggest some behavioural bias of the market.
| Table 5: Abnormal Announcement Return Regressions | |||
| Independent variables | Dependent variable: Abnormal announcement return for -1 to +1 days (value weighted index adjusted) | ||
|---|---|---|---|
| Model 1 | Model 2 | Model 3 | |
| Intercept | 0.076*** | 0.079*** | 0.072*** |
| M/B | 0.012*** | ||
| Firm-specific misvaluation | 0.015*** | 0.020*** | |
| Sector-specific misvaluation | 0.002 | -0.001 | |
| Growth option | 0.011*** | -0.030 | |
| Firm-specific misvaluation * Undervaluation dummy | -0.032*** | ||
| Growth option* Positive growth dummy | 0.042*** | ||
| Size decile | -0.009*** | -0.009*** | -0.009*** |
| Post-split price percentile | <0.001 | <0.001 | <-0.001 |
| D1971-1975 | 0.010 | 0.007 | 0.007 |
| D1976-1980 | 0.018 | 0.013 | 0.012 |
| D1981-1985 | 0.013* | 0.010 | 0.010 |
| D1986-1990 | 0.008 | 0.006 | 0.006 |
| D1991-1995 | 0.004 | 0.003 | 0.003 |
| D1996-2000 | 0.016** | 0.017** | 0.016 |
| D2001-2005 | 0.003 | 0.003 | 0.003 |
| D2006-2010 | 0.006 | 0.005 | 0.007 |
| N | 4,577 | 4,577 | 4,577 |
| Adjusted R2 | 0.07 | 0.07 | 0.08 |
| Notes: This Table reports the OLS regressions where the dependent variable is stock split announcement return (-1 to +1 days). The predictor variables are Market-to-book ratio and its components and size decile and post-split price percentile following Ikenberry et al., 1996. Size decile (based on market equity) are determined in the preceding month of split announcement relative to all CRSP ordinary common shares. Post-split price percentile is determined by taking the split announcement preceding month-end price, dividing it by 1+split factor and then comparing the resulting value with all ordinary common share price in CRSP in the same size decile as the splitting firm. Dxxxx-xxxx represents five-year time period dummy which takes a value of 1 if the split announcement year falls within that period or 0 otherwise. Undervaluation dummy (positive growth dummy) is a binary variable which takes a value of 1 if the Firm-specific misvaluation (growth) measure of the splitting firm is negative (positive) or 0 otherwise.***, **, * represents significance level at 0.1%, 1% and 5% level, respectively. | |||
To test our univariate findings in a multivariate setting, we regress the three day (-1 to +1) split announcement returns on the market-to-book ratio and the decomposed components, along with the control variables. Specifically, we use three control variables following Ikenberry et al. (1996); size-decile, post-split price percentile, and time period dummies. Size decile is determined based on the relative size (market equity) of the split firms preceding the month before the split announcement compared to all CRSP ordinary common shares. Post-split price percentile is a proxy for managers’ target share prices. It is calculated using the month-end share price preceding the split announcement, then dividing this price with the split factor +1 and then it is ranked relative to all CRSP ordinary common share prices of the splitting month in the same size decile. The time period dummies reflect five year periods. If any split announcement year falls within a given time period, the dummy takes a value of 1 or 0 otherwise. Table 5 reports the regression results. Model 1 includes the market-to-book ratio and other control variables. The results are similar to Ikenberry et al. (1996); market-to-book is positively related to the split announcement return. In model 2, we replace market-to-book ratio with the misvaluation and growth option components of market-to-book. Both the misvaluation and the growth option components are highly positively significant. This suggests that splitting firms do use splits to signal growth opportunities but also market rewards firms which are overvalued. In our third model we test whether these relationships are driven by undervalued and/or positive growth option firms. We create separate dummies; an undervaluation and a positive growth dummy. The undervaluation dummy has a value of 1 if the misvaluation measure is negative or 0 otherwise. Similarly, the high growth dummy has a value of 1 if the growth measure is positive of all splitters and 0 otherwise. We interact theses dummies with our misvaluation and growth option measures and include them in model 3. An interesting finding emerges: The coefficient on misvaluation is still positive and significant and the interaction term with the undervaluation dummy is now negative and significant at the 0.1% level. This suggests that the positive relation between the announcement return and mispricing is consistent across all firms, not only due to overvalued firms. The regression coefficient on our growth option measure becomes insignificant, but the interaction term is insignificant. This suggests that the positive relationship between abnormal announcement return and growth option is driven by the positive growth option firms, rather than the higher growth option firms. This result suggests a strong behavioural bias of the market in split announcement. Market is failing to separate growth opportunities from mispricing and hence rewarding firms which not only have high growth opportunities but also are overvalued during split announcement.
Conclusion
Using a market-to-book decomposition approach, pioneered by RKRV (2005), we find that there are substantial differences in the way stock prices absorb information embedded in stock split announcements. We find that, although on average stock splits are seen as a positive signal by the market, there are predictable cross-sectional differences in the abnormal returns generated around the stock split announcement. Firms that announce a stock split while having a relatively large amount of growth opportunities exhibit higher abnormal returns, suggesting that splits may be used to signal growth opportunities. We also find that highly overvalued firms seem to exhibit relatively higher abnormal split announcement returns. Most of these overvalued firms also have significantly higher growth options. Our findings support both the rational and the behavioural arguments of stock splits. A possible explanation of this could be that market fails to separate, at least partially, growth prospects and overvaluation from the market price and hence rewards both at split announcements.
Stock split is a corporate event that frequently used by firms to adjust nominal share prices. The findings of this study may highlight the recent behavioural explanations of stock splits. May attempt to separate the valid signal and false signal and reward firms accordingly. Although we attempt to separate rational and behavioural explanations of stock splits but we do not distinguish between competing behavioural explanations such as ‘nominal price illusion’ or managerial opportunistic behaviour. Future research may address this issue.
References
- Baker, M., Greenwood, R. & Wurgler, J. (2009). Catering through nominal share prices. The Journal of Finance, 64(6), 2559-2590.
- Birru, J. & Wang, B. (2016). Nominal price illusion. Journal of Financial Economics, 119(3), 578-598.
- Brennan, M. & Copeland, T. (1988b). Stock splits, stock prices and transaction costs. Journal of Financial Economics, 22(1), 83-101.
- Byun, J. & Rozeff, M.S. (2003). Long-run performance after stock splits: 1927 to 1996. Journal of Finance, 5(3), 1063-1086.
- Desai, H. & Jain, P. (1997). Long-run common stock returns following stock splits and reverse splits. Journal of Business, 70(3), 409-433.
- Dyl, E. & Elliott, W. (2006). The share price puzzle. The Journal of Business, 79(4), 2045-2066.
- Easley, D., O'Hara, M. & Saar, G. (2001). How stock splits affect trading: A microstructure approach. Journal of Financial and Quantitative Analysis, 36(1), 25-51.
- Fama, E., Fisher, L., Jensen, M. & Roll, R. (1969). The adjustment of stock prices to new information. International Economic Review, 10(1), 1-21.
- Guo, S., Liu, M.H. & Song, W. (2008). Stock splits as a manipulation tool: Evidence from mergers and acquisitions. Financial Management, 37(4), 695-712.
- Grinblatt, M., Masulis, R. & Titman, S. (1984). The valuation effects of stock splits and stock dividends. Journal of Financial Economics, 13(4), 461-490.
- Haugen, R. (1995). The new finance: The case against efficient markets. Prentice Hall, Englewood Cliffs, NJ.
- He, Y. & Wang, J. (2012). Stock split decisions: A synthesis of theory and evidence. Journal of Applied Finance (Formerly Financial Practice and Education), 22(2), 124-142.
- Hertzel, M. & Li, Z. (2010). Behavioural and rational explanations of stock price performance around SEOs: Evidence from a decomposition of market-to-book ratios. Journal of Financial and Quantitative Analysis, 45(4), 935-958.
- Hoberg, G. & Phillips, G. (2010). Real and financial industry booms and busts. The Journal of Finance, 65(1), 45-86.
- Huang, G., Liano, K., Manakyan, H. & Pan, M. (2008). The information content of multiple stock splits. Financial Review, 3(4), 543-567.
- Ikenberry, D., Rankine, G. & Stice, E. (1996). What do stock splits really signal? Journal of Financial and Quantitative Analysis, 31(3), 357-375.
- Kadiyala, P. & Vetsuypens, M. (2002). Are stock splits credible signals? Evidence from short interest data. Financial Management, 31(1), 31-49.
- Karim, M.A. & Sarkar, S. (2016). Do stock splits signal undervaluation? Journal of Behavioural and Experimental Finance, 9, 119-124.
- Lakonishok, J. & Lev, B. (1987). Stock splits and stock dividends: Why, who and when. The Journal of Finance, 42(4), 913-932.
- Lakonishok, J., Shleifer, A. & Vishny, R. (1994). Contrarian investing, extrapolation and risk. Journal of Finance, 49(5), 1541-1578.
- Lin, J., Singh, A. & Yu, W. (2009). Stock splits, trading continuity and the cost of equity capital. Journal of Financial Economics, 93(3), 474-489.
- McNichols, M. & Dravid, A. (1990). Stock dividends, stock splits and signalling. The Journal of Finance, 45(3), 857-879.
- Rhodes-Kropf, M., Robinson, D. & Viswanathan, S. (2005). Valuation waves and merger activity: The empirical evidence. Journal of Financial Economics, 77(3), 561-603.
- Weld, W., Michaely, R., Thaler, R. & Benartzi, S. (2009). The nominal share price puzzle. Journal of Economic Perspectives, 23(2), 121-142.