Research Article: 2022 Vol: 26 Issue: 4
Measuring Competition in the Microfinance Industry Using Panzar and Rosse Approach
Sanderson Abel, Midlands State University & Nelson Mandela University
Pierre Le Roux, Nelson Mandela University
Tendai Maparara, Midlands State University
Julius Mukarati, Midlands State University
Rodwell Musiiwa, Independent Economist
Citation Information: Abel, S., Le Roux, P., Maparara, T., Mukarati, J., & Musiiwa, R. (2022). Measuring competition in the microfinance industry using panzar and rosse approach. Academy of Accounting and Financial Studies Journal, 26(4), 1-15.
Abstract
The microfinance sector in Zimbabwe has undergone significant transformation from its pre-independence status when it was dominated by informal credit sources such as unregistered money lenders, rotating savings clubs, credit associations, and family and friends. After the country attained independence in 1980, international and local NGOs emerged as dominant players in the microfinance sector. The sector rose to prominence in the early 1990s, exponentially growing in the early 2000s when a host of macroeconomic factors led to the rapid informalisation of the economy. Formal microfinance institutions have been facing competition from the informal microfinance institutions, the banking sector, and the mobile network operators. In light of these developments the current study evaluated competition in the microfinance industry in Zimbabwe. The study established that the microfinance sector is operating under monopolistic competition. The major drivers of competition include profitability, market share, branch networks, capital adequacy, and inflation. The study recommends that microfinance institutions should adopt prudent lending policies and strengthen their risk management practices to reduce adverse selection and moral hazard problems.
Keywords
Microfinance, Competition, Panzar and Rosse, Profitability, Monopolistic.
Introduction
Microfinance is the provision of custom-made financial services to the poor and small business owners (United Nations 2006). The services provided by this sector include small loans, small savings deposits, savings, insurance, and money transfers USAID PRISMS 2005 (Robinson, 2001). Microfinance is important because it provides resources and access to capital to the financially underserved, such as those who are unable to get checking accounts, lines of credit, or loans from traditional banks. Without microfinance, these groups may have to resort to using loans or payday advances with extremely high-interest rates or even borrow money from family and friends. Microfinance helps them invest in their businesses, and as a result, invest in themselves Assefa.
The microfinance sector complements the banking industry’s financial intermediation function by improving credit provision. Imran et al. (2002) argue that microfinance is a parallel finance model to the conventional banking system. A number of studies identified that microfinance is instrumental in economic development (Ledgerwood et al., 2013; Batra & Sumanjeet, 2012; Armendariz & Labie, 2011; Imran et al., 2002; Carbo et al., 2009). Microfinance helps in raising incomes for the poor, poverty alleviation and delivering microcredit in the form of very small loans to borrowers with little or no collateral security (Ledgerwood et al., 2013; Batra & Sumanjeet, 2012).
Competition is important in the microfinance sector for efficiency in the production and allocation of goods and services. Competition improves access to finance, allocation of capital funds, development of real sector and the extent of financial stability (Carbo et al., 2009). It stimulates innovation, lowers prices and increases the quality of products and services produced, enhancing the welfare of citizens. It also improves financial innovation, financial wealth of microfinance institutions, financial stability and the extent to which small to medium enterprises access affordable financing (Bikker, 2010).
In Zimbabwe, there are different types of financial institutions, which include banks, building societies, deposit-taking MFIs, credit only MFIs, savings and credit cooperatives and Small Enterprises Development Corporation Reserve Bank of Zimbabwe 2013. These institutions compete with microfinance institutions by offering similar services. Besides the registered microfinance institutions, there has also been a proliferation of unregistered institutions. The increased number of institutions offering microfinance services reflects increasing competition worth an investigation. The current study therefore evaluates competition and its determinants among the registered Zimbabwean microfinance institutions.
Background
The microfinance industry in Zimbabwe is regulated under the Microfinance Act (Chapter 24:29). The act was promulgated in August 2013 replacing the Money lending and Rates of Interest Act (Chapter 14:14) which previously governed and regulated MFIs in Zimbabwe Reserve Bank of Zimbabwe 2014. The microfinance sector is important for the growth of the economy through building inclusive financial systems Reserve Bank of Zimbabwe 2014. In Zimbabwe, microfinance has a critical role of enhancing financial and economic development in a country, which is heavily informal, having low levels of financial inclusion and limited involvement of commercial banks in microfinance activities (Makina, 2012).
The microfinance sector in Zimbabwe has undergone significant transformation from its pre independence status when the sector was dominated by informal credit sources such as unregistered moneylenders, rotating savings and credit associations or clubs, and family and friends (Mago, 2013). After the independence of Zimbabwe in 1980, international and local NGOs started to emerge as a dominant form of MFIs in the country (Mago, 2013). During the pre-independence and early independence periods the microfinance operations were not quite pronounced and small firms and low-income groups had very limited access to credit. People in the rural areas could not easily access credit and their savings options were mainly limited to the Post Office Savings Bank, which maintained branches across the breadth of the country. Rural people engaging in farming activities had limited access to funding from the then Agricultural Finance Corporation (AFC). The marginalised groups relied mostly on informal mechanisms to access credit.
The microfinance sector in Zimbabwe rose to prominence in the early 1990s and started to grow exponentially in the early 2000s when a host of macroeconomic factors led to the rapid informalisation of the economy (ZAMFI, 2013). The informal sector has since taken root in Zimbabwe with estimates of formal unemployment exceeding 80% and these macroeconomic conditions pushed the demand for MFIs products further ZAMFI 2013. Since dollarization in 2009, the Zimbabwean microfinance industry evidenced growth in MFIs as depicted in (Figure 1).

Figure 1: Growth In Mfis In Zimbabwe.
Figure 1 shows some steady growth in the microfinance sector. The sector grew by 111 percent between 2009 and 2018. The increase in the number of microfinance institutions is attributed to increased market confidence as a result of the newly adopted multiple-currency regime. MFIs increased by approximately 28 percent in 2011 and then marginally increased by 3 percent during 2012. The number of MFI further declined by 5 percent during the period 2012-2013. The reduction in the number of microfinance institutions might be a direct result of liquidity challenges experienced in the economy during the period. During 2013-2014, MFIs slightly improved by 1 percent as a result of incorporation of new players in the market, including one deposit taking microfinance institution.
The microfinance sector in Zimbabwe has witnessed a gradual increase in entry of banks in the microcredit segment of micro financing and in particular, consumer loans to salaried employees. Some banks have even been venturing into core microfinance activities by targeting the non-salaried poor people engaging in informal trading and Micro, Small and Medium Enterprises. Banks such as ZB Bank and Metbank have established their presence in informal market places (Chideme, 2015). Other banks in Zimbabwe have been venturing into microfinance and these include Banc ABC and FBC Bank who established ABC Easy Loans (Private) Limited and Microplan Financial Services (Private) Limited respectively to be subsidiary microfinance companies (Chideme, 2015). Agribank and POSB have set up departments focusing on microfinance business. Tetrad Bank and Afrasia Bank have long been involved in microfinance through Multiridge Finance and Micro King respectively. There are also other large non-bank financial institutions, which have ventured into microfinance or have reported plans to enter into microfinance and these include National Social Security Authority (NSSA), Fidelity Life Assurance and Zimnat Insurance (Chideme, 2015).
Literature Review
Literature on measuring competition can be broadly categorized into the structural or, industrial organization (IO) approach and the non-structural or, new empirical industrial organization (NEIO) approach. The structural method, originated from the industrial organisation theory and proposes tests of market structure to assess competition on the basis of the ‘structure conduct performance’ (SCP) paradigm. Claessens (2009) also identified three approaches to empirical measurement of competition, that is, market structure and associated indicators; contestability and regulatory indicators to gauge contestability; and formal competition measures. According to Kar (2016), the SCP hypothesis argues that greater concentration causes less competitive conducts and leads to greater profitability. This hypothesis assumes that market structure affects competitive behaviour and, hence, performance. The SCP method uses concentration indices such as the n-firm concentration ratios or the Herfindahl-Hirschman index (HHI) as proxies for market power. In microfinance literature, among others, Baquero et al. (2012) employed the HHI to measure competition in microfinance markets covering data from 379 MFIs located in 69 countries over the period 2002 to 2008. To measure competition, Olivares-Polanco (2005) used data from 28 Latin American MFIs and employed the percentage of concentration of the largest MFIs by country, where concentration denotes the market share held by the largest MFIs in a country.
The contestability and regulatory indicators approach relies on regulatory indicators to gauge the degree of contestability. This method considers regulatory issues, for instance, entry requirements, formal and informal barriers to entry for domestic and foreign financial institutions (such as, banks) and activity restrictions, among others. The method takes into consideration the changes over time in financial instruments and innovations, given that these can alter the competitive environment. The Panzar Rose (P-R) (1987) analyses the transmission of changes in input prices to bank revenue. This method falls under approaches classified as non-structural methods that assess competition in respect of new empirical industrial organisations derived from the equilibrium conditions. One of the assumptions underlying the P-R test is that the test only applies for single-output firms. The other underlying assumption of the P-R approach relates to the cost structure, which must be homogeneous, and the price elasticity of demand, which must be greater than one. The Lerner index is an improvement of the H-statistic and depicts market power as the difference between output prices and marginal costs relative to prices. Coccorese (2009) asserts that the Lerner index is a true reflection of the financial market e.g., banks’ degree of market power as it represents the behavioral departure from monopoly and perfect competition. It is an inverse measure of competition meaning that the greater the value of the Lerner Index, the lower the competition and vice versa. The ‘profit elasticity’ (PE), or the Boone, indicator is another relatively improved measure of competition. Founded on the ‘relative profit differences’ (RPD) concept, and essentially as an elaboration on the efficiency hypothesis, the PE indicator is based on the idea that competition rewards efficiency (Boone, 2008). The underlying intuition is that in a more competitive market, firms are punished more harshly (in terms of profits) for being inefficient. The model considers the impact of efficiency on performance in terms of profits and market shares. This is based on the idea that more efficient firms (firms with lower marginal costs) gain higher market shares or profits. The higher the degree of competition in the market the stronger the impact and the more negative the indicator. Kar (2016) did a study to ascertain the effect of competition in the microfinance industry. The study established that increased competition in microfinance affects the MFIs and their clients in at least two ways. First, increased competition leads to a decline in the borrower quality, as better performing clients move to profit-oriented MFIs. Consequently, loan defaults rise. Second, with increased competition the interest rates drop, resulting in lower profitability and less cross-subsidization. Gwasi & Ngambi (2014) studied the role of competition on microfinance institutions performance in Cameroon. The study established a positive effect of competition on the performance of microfinance institutions. The study established that microfinance institutions performance was determined by operational expense ratio, portfolio at risk, and staff productivity.
Sabi (2013) compared key issues concerning the structure of microfinance institutions (MFIs) and the nature of competition in Tajikistan and Uzbekistan. The study established that there was high probability that if a client fails to repay a loan from one MFI, he/she will join another even in the absence of intense competition. Assefa studied the effect of competition among microfinance institutions using the Learner index as a measure of competition. They established that competition had a negative relationship with profitability. The study further found that lending standards improve information sharing and enhance efficiency, which might assist in overcoming the effect of competition without compromising the growth of the firms. Assefa found that more competition leads to more loans at risk thereby causing higher levels of loan write offs. Thus, these findings support the claim that competition leads to multiple loan taking by clients, resulting in heavy debt burdens and low repayment rates and/or it puts pressure on MFIs to increase output and lower costs, which may lead them to relax lending and client selection standards. Baquero et al. (2012) found that for-profit MFIs charge significantly lower loan rates and demonstrate better portfolio quality in less concentrated markets whereas nonprofit MFIs are comparatively insensitive to competition.
In saturated markets, MFIs try to maintain their customer base and decrease their costs by lowering lending standards or decreasing screening efforts (Schicks & Rosenberg, 2011) thus leading to higher loan defaults due to the increase of risky borrowers. Schicks & Rosenberg (2011) found that through its impacts on the clients, increased competition in microfinance creates information asymmetry in the industry coupled with repayment problems of the borrowers leading to the risk of over-indebtedness, debt-traps and increased sociological and psychological constraints. McIntosh & Wydick (2005) argue that competition reduces the ability of MFIs to cross-subsidize and increases asymmetric information on borrower quality. As a result, impatient borrowers become keen to acquire multiple loans, over-indebtedness increases and repayment rates decrease. Increased competition also induces the profitable and productive clients of the socially motivated MFIs to shift to the profit-oriented MFIs. Such transfer eventually worsens the loan-portfolio quality of the socially motivated MFIs and negatively affects their cross-subsidization possibilities.
Methodology
This section starts by evaluating the level or degree of competition for the period 2015 to 2018. The panel regression method is used to examine the determinants of competition in the second step. Competition is estimated using the Panzar and Rosse H-Statistic (Claessens & Laeven, 2004). The H-Statistic method measures competition by estimating deviation from competitive pricing. The H-statistic is calculated from reduced-form revenue equations and measures the elasticity of total revenues with respect to changes in factor input prices. The method assumes that profit maximisation condition holds for both the industry and firm-level Bikker and Haaf. Panzar & Rosse (1987) showed that the comparative static properties of this type of equations provide a proxy for the overall level of competition prevailing in the market. The derivation of the H-statistic is shown below:
At the firm level the profit maximisation condition is given as follows:

Where 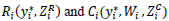 are the revenue and cost functions of bank i.
 is the output of the firm,
 is a K-dimensional vector of factor input prices of bank i,
 is a vector of j exogenous variables determining the revenue function
 is a vector of L exogenous variables that shift the cost function
 At the individual level, profit is maximised where the marginal revenue must equal marginal cost:

The H-statistic evaluates the elasticity of total revenues in respect of changes in factor input prices:

The P-R approach assumes log linearity in the specifications of the marginal revenue and marginal cost functions.
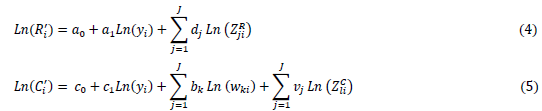
For a profit maximising firm, the equilibrium output results from equation 4.2;
Rearranging the terms:
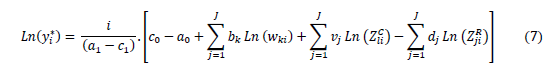
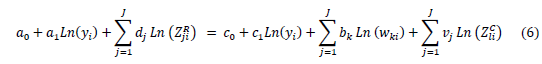
The reduced form equation for revenues of the representative bank is given by the equilibrium output of bank i and the common price level:

The price level is provided by the inverse demand equation, which also reads in Logarithms:
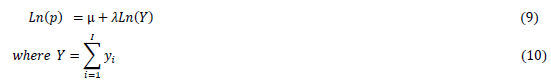
Y is the aggregate output of the industry. The reduced form revenue equation after algebraic manipulation is achieved as:

 is a vector of Q bank specific variables, without reference to their origin from the cost or revenue function
The H-statistic is then defined as follows;
Empirically the regression equation is specified below;

Where i denotes a microfinance firm and t denotes time in years. IRt is the ratio of interest income to total assets. WL, WK, WF are proxies of input prices. WL is the unit price of labour and is calculated as the ratio of personnel costs to total assets. WK is the unit price of capital and is calculated as the ratio of other operating expenses to total assets. WF is the unit price of loanable funds and is also calculated as the ratio of interest expense to total deposits. These cost variables are important in determining competition because they form the cost structure of the firm. The cost structure then informs the pricing of the services offered. Firms that incur huge costs are less likely to be competitive as compared to those that produce same output with less cost. TAit (Total Assets) which is a size variable captures the scale effects. CAPit (Capital adequacy ratio) captures regulatory risk while NPLit (Ratio of nonperforming loans) captures credit risk. INFit (Inflation) is a macroeconomic control variable capturing uncertainty. The H-statistic is calculated as the sum of coefficients of input prices as follows:

The Panzar-Rose model is only valid under the long-run equilibrium assumption hence we need to test for this using the following regression equation where we replace the dependent variable Rit with Return on Assets (ROA);

The long-run equilibrium test requires that the return on microfinance assets should not be correlated with input prices, hence must satisfy the following;

The underlying assumptions of the P-R approach are that it should be used where the observations are in long-run equilibrium. The resultant H is supposed to be significantly equal to zero in equilibrium and significantly negative in the case of disequilibrium (Abel & Le Roux, 2016).
It is important to understand the factors that determine competition in the microfinance industry, that is, determinants of competition. Ordinary Least Square method was applied in running multiple regression analysis on a variety of competition indicators. Use of multiple competition measures provides an in-depth understanding on how each of the independent variables influences selected dependent variables, in terms of direction of movement and magnitude. The study adopted and modified a multiple regression model used by (Katuka, 2015). The regression model is specified as follows:

Competition is measured by the H-statistic using the Panzar-Rosse methodology. The H-statistic was chosen as the dependent variable and is regressed against the determinants of competition discussed below. Capital adequacy (CAP) captures the regulatory restrictions while non-performing loans Capital adequacy is expected to have a negative relationship with competition. The demand for higher capital requirements by the authorities’ forces banks to raise margins in order to build up a sufficient revenue buffer necessary for maintaining solvency. A higher capital income ratio is expected to have a negative relationship with market power. As the cost of generating income increases banks are likely to increase their profit margins. (NPL) measures credit risk. Credit risk is expected to have negative effect on competition. As competition increases firms are likely to loosen on their credit screening mechanism which will lead to a rise in non-performing loans. Firms are interested increasing their market share (MS). As market share of firms increases this then reduces competition as the firm becomes more oligopolistic. If the number of firms increases, then competition increases in the industry. The number of bank branches (NB) has a positive effect on competition. As firms expand through increasing branch network competition also increases. Inflation (INF) is an indicator of macroeconomic uncertainty and is expected to have a positive relationship with market power. Higher rate of inflation is expected to influence banks to increase prices of bank products whilst cutting down on operating costs to remain profitable. Return on equity (ROE) is used to measure profitability. The profitability of the sector is expected to have a positive effect on competition. Given free entry and exit, profitability attracts new entrants into the sector.
The study data was obtained from a number of sources. The microfinance institution specific data was obtained for the individual institution financial statements posted on their websites. The industry specific data was gathered from the Central Bank annual and quarterly reports. The macroeconomic variables were obtained from Zimstats and World Bank. Table 1 shows list of variables, their coding, measurement and their prior expected sign.
| Table 1 Variable, Measurement And Expected Sign |
||
|---|---|---|
| Variable | Measurement | Expected sign |
| Dependant variables | ||
| Interest Income (IR) | interest revenue/total assets | N/A |
| Return on Assets (ROA) | net profit/total assets | N/A |
| H-statistic (H) | regression | N/A |
| Explanatory variables | ||
| Market Share (MS) | MF assets/MFI total assets | + |
| Net Profit (NP) | profit after tax | + |
| Capital Adequacy ratio (CAP) | total equity/total assets | + |
| Non-Performing Loans (NPL) | PaR>30 | - |
| Inflation (INF) | yearly changes in inflation rate | - |
| Number of Branches (NB) | RBZ data | + |
| Return on Equity (ROE) | Net profit after tax/shareholder's equity | + |
The study uses panel data to estimate regression equations for the estimate competition in microfinance competition for the period 2015 to 2018. The study also utilized Ordinary Least Squares to estimate yearly H-statistic. Panel data analysis approach has the advantage of being able to identify and measure effects that are simply not detectable when using pure cross-section or pure time series approaches. Furthermore, the use of panel data analysis allows the construction and testing of more complicated behavioural models compared to purely cross-sectional or time-series approaches.
The study utilized yearly data collected from Reserve Bank of Zimbabwe (RBZ) reports, which are in the public domain. The period chosen for consideration is 2015 to 2018. A sample of 28 Microfinance firms, representing 80% market share, was used. The sample was chosen based on completeness of data. Eviews Statistical package was used for econometric and statistical analysis of the data. The Hausman specification test was used to select between the fixed effects and random effects in the panel data analysis.
Table 2 above shows the average values of the variables, the maximum, minimum and the standard deviation for the measurement of competition in the Microfinance Industry of Zimbabwe. Results showed that the average Interest Income for MFIs stood at 0.32608, ROA had an average of 0.05426 with a minimum of -0.781 and maximum record of 0.40169. Standard deviation statistic for ROA was 0.145 suggesting that return on assets for MFIs is less volatile implying less deviation for the mean value hence less risk and variability. As indicated in the methodology section, these variables are important in determining cost structure of the firm, which ultimately influence the competitiveness of the firm.
| Table 2 Descriptive Statistics Of Measures Of Competition |
|||||||||
|---|---|---|---|---|---|---|---|---|---|
| Statistic | IR | WL | WK | WF | TA | INF | CAP | ROA | NPL |
| Mean | 0.326 | 0.106 | 0.288 | 0.066 | 9.013 | 0.019 | 0.670 | 0.101 | 0.091 |
| Median | 0.239 | 0.076 | 0.199 | 0.051 | 4.417 | -0.033 | 0.402 | 0.063 | 0.056 |
| Maximum | 1.441 | 0.602 | 1.729 | 0.353 | 55.163 | 0.106 | 10.396 | 0.781 | 0.816 |
| Minimum | 0.009 | 0.003 | 0.022 | 0 | 0.554 | -0.024 | -0.061 | 0.010 | 0.000 |
| Std. Dev. | 0.288 | 0.106 | 0.299 | 0.074 | 10.654 | 0.052 | 1.107 | 0.117 | 0.142 |
| Skewness | 1.461 | 2.133 | 2.563 | 1.617 | 2.123 | 0.977 | 6.631 | 2.573 | 3.334 |
| Kurtosis | 5.645 | 8.046 | 11.189 | 5.753 | 7.760 | 2.177 | 56.038 | 12.427 | 15.299 |
| Jarque-Bera | 72.471 | 203.794 | 435.287 | 84.153 | 189.863 | 20.972 | 13948.1 | 538.315 | 913.33 |
| Probability | 0 | 0 | 0 | 0 | 0 | 0 | 0 | 0.0000 | 0.0000 |
| Sum | 36.517 | 11.923 | 32.272 | 7.375 | 1009.500 | 2.122 | 75.033 | 11.344 | 10.226 |
| Sum Sq. Dev. | 9.192 | 1.258 | 9.904 | 0.611 | 12600.200 | 0.301 | 136.002 | 1.522 | 2.251 |
| Observations | 112 | 112 | 112 | 112 | 112 | 112 | 112 | 112 | 112 |
Source: Own computation from research data .
In choosing between the fixed effects or random effects, we conducted the Hausman test Table 3. The null hypothesis which states that the random effects is the appropriate model is tested against the alternative hypothesis, which postulates that the fixed effects is the appropriate model. Based on the findings from the test, it is found that the data utilized in this research favors the fixed effects model since the p-values from the two models were greater than 0.05.
| Table 3 Hausman Test |
||||||
|---|---|---|---|---|---|---|
| Fixed Effects Test | Random Effects Test | |||||
| ROA | Statistic | d.f. | Prob. | Statistic | d.f. | Prob. |
| ROA | 12.16565 | 13 | 0.4141 | 3.736262 | 7 | 0.8096 |
Table 4 below shows the results for testing for equilibrium in the microfinance Industry. Long run requires that the return on assets should not be correlated with input prices such that E = B1 + B2 + B3 = 0. The Wald test determines that E=0, confirming long run equilibrium. The dependent variable ROA is positively related to the price of capital (WK,), but negatively related to the cost of labour (WL,) and the cost of funds (WF,). Both the price of funds and price of labour variables have negative signs, meaning that increased factor costs leading to the lower return on assets. WL and WK are statistically significant implying these three variables contribute to the H-statistic.
| Table 4 Results For Testing For Equilibrium In The Microfinance Industry |
|
|---|---|
| Variable | Coefficient |
| C | 1.317045 (0.6928) |
| ln (WL) | -0.14066 (0.2446) |
| ln (WK) | 0.183475 (0.1373) |
| ln (WF) | -0.00509 (0.8948) |
| ln (TA) | 0.103033 (0.8122) |
| ln (INF) | 0.362379 (0.6641) |
| ln (CAP) | 0.022632 (0.7190) |
| ln (NPL) | -0.01271 (0.6872) |
Source: Own calculation Values in Parenthesis are the p-values
Table 5 shows the results for the estimation of the H-statistic for the Microfinance Industry in Zimbabwe using panel data fixed effects modelling. The results show that Microfinance institutions in Zimbabwe are operating under monopolistic competition. The dependent variable Interest Income is positively related to loanable funds ( F), the cost of labour ( L) and the cost of capital ( K). These findings seem to resonate with Kar (2016) findings in his study in which he found a number of countries to have competitive Microfinance sectors.
| Table 5 H-Statistics |
||||
|---|---|---|---|---|
| Year | H-stat | H=0 | H=1 | N |
| 2015 | 0.03419 | 2.08 | 2.49 | 27 |
| 2016 | 0.04573 | 2.14 | 2.51 | 27 |
| 2017 | 0.03314 | 0.74 | 0.43 | 27 |
| 2018 | 0.05478 | 1.52 | 2.04 | 27 |
Source: Own calculation
Table 6 shows the results for the trend of the Panzar and Rosse H-statistic over the period 2015 to 2018. The results show that competition increased in the microfinance sector between 2015 and 2018.The increase of the H-statistic from 0.03 to 0.05 shows an increase in the level of competition which could be attributable to the relaxation by the central bank of capital requirements as a way of promoting financial inclusion. This then attracted new entrance into the sector. The H-statistic was between zero and one throughout the period signifying that firms were operating under monopolistic competition.
| Table 6 Panzar-Rosse H-Statistic Trend (2015 – 2018) |
||||
|---|---|---|---|---|
| Year | 2015 | 2016 | 2017 | 2018 |
| H-Statistic | 0.03419 | 0.04573 | 0.03314 | 0.05478 |
Descriptive Statistics of the determinants of Competition
Tables 7 to 9 presents descriptive statistics of the variables using in estimating the determinants of competition as discussed in section four. The results show that there is little variability among the variables
Among explanatory variables, TA had the highest mean value of 9.013. INF variables shows lowest mean value of 0.019, reflecting stable economic environment under which microfinance institutions operated.
| Table 7 Descriptive Statistics Of The Determinants Of Competition |
|||||||||
|---|---|---|---|---|---|---|---|---|---|
| Statistic | TL | TA | ROE | ROA | NPL | NP | NB | MS | INF |
| Mean | 7.056 | 9.013 | 0.566 | 0.101 | 0.091 | 0.522 | 6.821 | 0.029 | 0.019 |
| Median | 3.546 | 4.417 | 0.203 | 0.063 | 0.056 | 0.244 | 4.000 | 0.016 | -0.003 |
| Maximum | 44.266 | 55.163 | 12.925 | 0.781 | 0.816 | 5.175 | 60.000 | 0.170 | 0.106 |
| Minimum | 0.391 | 0.554 | 0.000 | 0.010 | 0.000 | -2.682 | 0.000 | 0.002 | -0.024 |
| Std. Dev. | 8.875 | 10.654 | 1.706 | 0.117 | 0.142 | 1.092 | 8.133 | 0.033 | 0.052 |
| Skewness | 2.235 | 2.123 | 6.110 | 2.573 | 3.334 | 1.338 | 3.061 | 1.857 | 0.977 |
| Kurtosis | 7.912 | 7.761 | 41.515 | 12.427 | 15.299 | 7.873 | 17.985 | 6.536 | 2.177 |
| Jarque-Bera | 205.831 | 189.863 | 7619.507 | 538.315 | 913.33 | 144.192 | 1222.765 | 122.747 | 20.972 |
| Probability | 0.0000 | 0.0000 | 0.0000 | 0.0000 | 0.0000 | 0.0000 | 0.0000 | 0.0000 | 0.0000 |
| Sum | 790.321 | 1009.504 | 63.34 | 11.344 | 10.226 | 58.474 | 764.000 | 3.231 | 2.122 |
| Sum Sq. Dev. | 8743.43 | 12600.23 | 322.96 | 1.522 | 2.251 | 132.268 | 7343.429 | 0.118 | 0.301 |
| Observations | 112 | 112 | 112 | 112 | 112 | 112 | 112 | 112 | 112 |
Source: Own computation
Multicollinearity test results for explanatory variables are shown in table 8. The results show that there was no serious problem of multicollinearity among the variables.
| Table 8 Correlation Coefficients Of The Determinants Of Competition |
|||||||||
|---|---|---|---|---|---|---|---|---|---|
| Variable | H-statistic | ROE | ROA | NPL | NP | NB | MS | INF | CAP |
| H-statistic | 1 | -0.029 | 0.0455 | 0.0762 | -0.013 | 0.0400 | -0.0567 | 0.7234 | 0.0838 |
| ROE | -0.0290 | 1 | 0.28584 | -0.106 | -0.208 | 0.1285 | -0.1080 | -0.0933 | -0.2586 |
| ROA | 0.0455 | 0.2858 | 1 | -0.114 | 0.0667 | 0.0160 | -0.1571 | 0.0098 | 0.3663 |
| NPL | 0.0762 | -0.1062 | -0.1140 | 1 | -0.03 | -0.0633 | 0.0165 | 0.0802 | 0.0294 |
| NP | -0.0126 | -0.2085 | 0.0667 | -0.0300 | 1 | 0.3525 | 0.5285 | -0.0011 | 0.1228 |
| NB | 0.0400 | 0.1285 | 0.0160 | -0.0630 | 0.3525 | 1 | 0.1841 | 0.0820 | -0.0705 |
| MS | -0.0567 | -0.1080 | -0.1571 | 0.0164 | 0.5285 | 0.1841 | 1 | -0.0665 | 0.0312 |
| INF | 0.7234 | -0.0933 | 0.0098 | 0.0802 | -0.0010 | 0.0820 | -0.0665 | 1 | 0.0743 |
| CAP | 0.0838 | -0.2586 | 0.0366 | 0.0294 | 0.1228 | -0.0705 | 0.0312 | 0.0743 | 1 |
Source: Own calculation from research data
The results of unit root test are shown in Table 9. The test helps to identify whether research data has unit root or not. When performing unit root test, the researcher intends to see whether volatilities in variables are permanent or transitory. Temporary shock means that variables will restore to long-run equilibrium and permanent shocks infer the otherwise. The unit root test shows that the variables are all integrated of order zero. This implies that the variables are all stationary in their levels hence cointegration can be established.
| Table 9 Unit Roots Test Results |
||||
|---|---|---|---|---|
| Variable | ADF Statistic | Critical Value @5% | P-value | Order of integration |
| Market Share (MS) | -12.90962 | -2.887665 | 0.000 | I (0) |
| Net Profit (NP) | -3.985547 | -2.888411 | 0.005 | I (0) |
| Capital Adequacy ratio | -9.985547 | -2.887665 | 0.000 | I (0) |
| Non-Performing Loans (NPL) | -10.62493 | -2.887665 | 0.000 | I (0) |
| Inflation (INF) | -10.53604 | -2.887909 | 0.000 | I (0) |
| No. of Branches (NB) | -9.464697 | -2.887665 | 0.000 | I (0) |
| Return on Equity (ROE) | -10.855518 | -2.890327 | 0.000 | I (0) |
| Return on Assets (ROA) | -12.54464 | -3.49021 | 0.000 | I (0) |
The panel regression results are shown in table 10. The results show both firm specific as well as macroeconomic variables significantly determine the amount of competition in the microfinance industry. An increase in profitability had a positive impact on competition in the microfinance industry. As profits (Net income) increase relative to assets, there is likely to be innovation to reduce costs and competition increases as well. Khrawish (2011) indicates that profitability measures the efficiency of management in utilizing company assets in generating income. He asserts that profitability shows the effectiveness of the firm in making use of its resources and the setting up of new branches. This leads to more competition in the MFI sector. An increase in market share had a negative impact on competition. An increase in market share shows consolidation of the market and an industry dominated by a few players is the case in the microfinance industry. Industry concentration is followed by low competition. An increase capital adequacy had a negative impact on competition in the microfinance industry.
| Table 10 Regression Results For Determinants Of Competition |
|
|---|---|
| Variable | Coefficient and P-value |
| C | -0.97843 (0.000) *** |
| ln (ROE) | -0.04503 (0.006) *** |
| ln (NPL) | -0.00033 (0.876) |
| ln (NP) | 0.02686 (0.101) |
| ln (NB) | 0.00189 (0.000) *** |
| ln (MS) | -0.20196 (0.000) **** |
| ln (INF) | 0.06917 (0.000) *** |
| ln (CAP) | -0.04919 (0.005) *** |
Source: Own computation from research data
Capitalization is onerous and many MFIs may not be able to meet the prescribed capitalization levels, which ultimately reduces competition. This is supported by Simpasa (2010), who asserts that a negative relationship is expected between capitalisation and competition. Higher regulatory capital requirements will make microfinance institutions to be well capitalized and this will lead to improvement of buffer for risk absorption.
An increase in Number of branches has a positive impact on competition in the microfinance industry. As more and more branches are opened, MFIs even lower their interest charges to attract clients and this result in cutthroat competition. Inflation positively affects the level of competition in microfinance industry. In a related industry study by implied that inflation rate is expected to have a negative relationship with bank with bank competition. This is because high rate of inflation compels banks to increase their product prices leading to lower competition (Simpasa, 2010). In the case of Zimbabwe MFIs industry, it seems inflation was slowing down or was negative during the study period leading to a positive relationship.
Conclusion
The study shows that the microfinance industry in Zimbabwe is operating under monopolistic competition as shown by the Panzar and Rose H-statistic result. The results of Panzar and Rose H statistic results shows that competition increased during the study period rising from 0.03 to 0.05. The study established that profitability, market share, branch networks, capital adequacy and inflation determine competition in the microfinance sector. This implies that both firm specific and macroeconomic factors determine the level of competition in the microfinance industry. The study recommends that microfinance firms should adopt prudent lending policies and strengthen their risk management practices through screening borrowers. This is meant to reduce adverse selection and moral hazard problems since poor risk analysis has a negative effect on institutional operations. MFIs should also reduce high non-performing loans by desisting from unnecessary risk taking through aggressive lending as a means of competing, which may increase default risk and impose heavy financial losses.
References
Abel, S., & Le Roux, P. (2016). An application of Panzar-Rosse Approach in assessing banking sector competition in Zimbabwe. Journal of Economic and Financial Sciences, 92, 455-470.
Indexed at, Google Scholar, Cross Ref
Armendariz, B., & Labie, M. (2011). "The Handbook of Microfinance," World Scientific Books, World Scientific Publishing Co. Pte. Ltd
Indexed at, Google Scholar, Cross Ref
Baquero, G., Hamadi, M., & Heinen, A. (2012). Competition, Loan Rates and Information Dispersion in Microcredit Markets. European School of Management and Technology Working Paper, 12-02.
Indexed at, Google Scholar, Cross Ref
Batra, V., & Sumanjeet. (2012). The state of microfinance in India: Emergence, Delivery Models and issues. Journal of international Economics, 31, 69-72.
Bikker, A.J. (2010). "Measuring Performance of Banks: An Assessment," Journal of Applied Business and Economics, 11(4), 141-159.
Boone, J. (2008). “A new way to measure competition”. Economic Journal, 118, 1245-1261.
Indexed at, Google Scholar, Cross Ref
Carbo, S., Humphrey, D., Maudos, J., & Molyneux, P. (2009). “Cross-country comparisons of competition and pricing power in European banking”. Journal of International Money and Finance, 28, 115-134.
Indexed at, Google Scholar, Cross Ref
Chideme, N. (2015). An assessment of factors affecting the financial performance of microfinance institutions in Zimbabwe. A dissertation submitted in partial fulfilment of the requirements for the Degree of Master of Business Administration, GSBL, Harare.
Claessens, S., & Laeven, L. (2004). “What drives bank competition? Some international evidence”. Journal of Money, Credit, and Banking, 36, 563-583.
Indexed at, Google Scholar, Cross Ref
Coccorese, P. (2009). “Market power in local banking monopolies”. Journal of Banking and Finance, 33, 1196-1210.
Indexed at, Google Scholar, Cross Ref
Gwasi, N., & Ngambi, M.T. (2014). Competition and Performance of Microfinance Institutions in Cameroon. International Journal of Research in Social Sciences, 3(8), 1-36.
Imran, M., Hulme, D., & Rutherford, S. (2002). “Finance for the poor: from microcredit to micro financial services”. Journal of International Development, 14, 273-294.
Indexed at, Google Scholar, Cross Ref
Kar, A.K. (2016). “Measuring competition in microfinance markets: a new approach”. International Review of Applied Economics, 304, 423-440.
Indexed at, Google Scholar, Cross Ref
Katuka, B. (2015). “What Determines Banks' Profitability in Zimbabwean Dollarised Economy? Panel Evidence (2009-2013)”, International Journal of Novel Research in Marketing Management and Economics, 2(2), 75-91.
Khrawish, H.A. (2011). Determinants of Commercial Banks Performance: Evidence from Jordan. International Research Journal of Finance and Economics, 81, 19-45.
Ledgerwood, J., Earne, J., & Nelson, C. (2013). The New Microfinance Handbook- A Financial Market System Perspective. Washington DC: The World Bank.
Mago, S. (2013). Microfinance in Zimbabwe: A Historical Overview. Mediterranean Journal of Social Sciences, 1(4), 599-608.
Indexed at, Google Scholar, Cross Ref
Makina, D. (2012). “Migration and Characteristics of Remittance Senders in South Africa”. Special Issue: International Migration and Remittances, 51(1), e148-e158.
Indexed at, Google Scholar, Cross Ref
McIntosh, C., & Wydick, B. (2005). “Competition and microfinance”. Journal of Development Economics, 78(2), 271-298.
Indexed at, Google Scholar, Cross Ref
Olivares-Polanco, F. (2005). “Commercializing microfinance and deepening outreach? Empirical evidence from Latin America”, Journal of Microfinance, 7, 47-69.
Panzar, J.C., & Rosse, J.N. (1987). “Testing for ‘monopoly’ equilibrium”. Journal of Industrial Economics, 35, 443-56.
Indexed at, Google Scholar, Cross Ref
Robinson, M. (2001). The microfinance revolution sustainable finance for the poor. Washington, US: World Bank.
Sabi, M. (2013). Microfinance institution activities in Central Asia: a case study of Tajikistan and Uzbekistan, Post-Communist Economies. Taylor and Francis Journals, 25(2), 253-266.
Indexed at, Google Scholar, Cross Ref
Schicks, J., & Rosenberg, R. (2011). Too much Microcredit? A Survey of the Evidence on Over- Indebtedness. Occasional Paper No. 19. Washington, DC: CGAP.
Simpasa, A.M. (2013). Competition and market structure in the Zambian banking sector. African Development Bank Group. Working Paper Series, No.168.
United Nation. (2006). Micro-Finance and Poverty Eradication Strengthening Africa Microfinance Institution. United Nations, New York.
ZAMFI. (2013). Annual performance report for the microfinance sector, Harare, Zimbabwe.
Received: 06-Jan-2022, Manuscript No. AAFSJ-22-10785; Editor assigned: 10-Jan-2022, PreQC No. AAFSJ-22-10785(PQ); Reviewed: 24-Jan-2022, QC No. AAFSJ-22-10785; Revised: 13-Apr-2022, Manuscript No. AAFSJ-22-10785(R); Published: 20-April-2022