Research Article: 2022 Vol: 26 Issue: 6S
Measuring the Hotels' Performance Using Profitability Ratios
Luís Lima Santos, CiTUR - Centre for Tourism Research, Development and Innovation – Polytechnic of Leiria
Conceição Gomes, CiTUR - Centre for Tourism Research, Development and Innovation – Polytechnic of Leiria
Cátia Malheiros, CiTUR - Centre for Tourism Research, Development and Innovation – Polytechnic of Leiria
Filipa Campos, CiTUR - Centre for Tourism Research, Development and Innovation – Polytechnic of Leiria
Citation Information: Lima Santos, L., Gomes, C., Malheiros, C., & Campos, F. (2022). Measuring the hotels' performance using profitability ratios. Academy of Accounting and Financial Studies Journal, 26(S6), 1-12.
Keywords
Hotels' Performance, Management Accounting, Profitability Ratios, Hospitality Industry
Abstract
The hospitality industry in Portugal has grown significantly through the year 2019, making a significant contribution to the country's economy. However, with the emergence of the Covid-19 pandemic, this industry was severely damaged and saw its profitability affected. Thus, it becomes essential to evaluate the hotels’ performance, based on ratios and indicators that allow income to be related to other variables in the financial statements and thereby assist managers in the decision-making process. Thus, this study aims to measure the performance of Portuguese hotels through financial profitability ratios, more specifically the return on equity, return on assets and return on sales.
The study, through a quantitative methodology, collected data from 2,008 hotels between 2016 and 2020, with the help of the SABI platform. Variables such as region, net income for the year, equity, financial costs and losses, total assets, operating income, and turnover were used to calculate and analyze the profitability ratios and the results were analyzed using SPSS software.
The conclusions demonstrate how essential profitability is to inform hoteliers about performance. The Portuguese hotel industry, considered a driver of the country's economy, performs very well in terms of profitability indicators until the Covid-19 pandemic, a period that showed severe breaks in profitability and the need for extraordinary measures for recovery. It has become clear that the overall performance of hotels differs between regions, so the calculation of average profitability is crucial for hoteliers to effectively benchmark.
This research has theoretical and practical contributions, as it supports the broadening of knowledge about financial ratios and managers' perceptions of the importance of their use in such a competitive industry. In addition, the study aims to fill a gap in the literature about the importance of analyzing hotel performance through profitability ratios in Portuguese hotel companies.
Introduction
The hospitality industry has developed significantly over the years and is considered one of the most important economic activities in several countries, contributing to generating wealth about to various macroeconomic indicators such as Gross Domestic Product (GDP), employment, and tourism revenues (Teperek & Lima, 2021; World Tourism Organization, 2021). The way hotel businesses are oriented and the correct use of accounting tools allow more effective business management (Tourita et al., 2019).
However, at the end of 2019, the emergence of the Covid-19 disease and its large-scale spread drastically reduced economic activity worldwide and damaged the profitability of the hospitality industry (Jiang & Wen, 2020; Soehardi & Untari, 2020). In addition to these difficulties of cyclical nature, there are persistent difficulties for managers regarding the use of tools and systems that allow control over the management of companies (Campos et al., 2022), which reasons why it is essential to provide managers with skills in accounting and financial management topics, to optimize decision-making and better positioning of companies in the global and competitive market, to promote their success. Besides specific management training, another way to support managers in acquiring skills emerges from the sharing of research results (e.g., journal articles and conference papers), between academics and managers, a practice that has been adopted but needs to be strengthened (Anuar & Chin, 2016). However, although studies on accounting have existed for several centuries (Oliveira et al., 2009), in Portugal they only started in the second half of the 20th century (Lima Santos et al., 2022; Oliveira et al., 2009) covering studies, among other topics with interest for managers, on financial accounting, management accounting in hospitality and financial management. One way for managers to understand the performance of a company and anticipate the difficulties that may arise at the operational and financial level is through the analysis of financial ratios, such as profitability, solvency, and liquidity ratios (Altman, 1968).
Thus, this research work aims to inform hotel managers about the performance of their businesses through financial profitability ratios, in 5 years culminating with the emergence of the Covid-19 pandemic, illustrating the specific case of hotel companies in Portugal and comparing results by regions. For the mentioned reasons, the main objective of this study is to measure the performance of Portuguese hotels through financial profitability ratios.
Through the analysis of the performance of Portuguese hotel companies, the research seeks to contribute to the broadening of knowledge and managers' perception of the importance of using profitability ratios allowing to compare their hotel with the region and country averages in this very competitive and specific sector of activity. The comparison between several years (2016-2020) will allow a relevant analysis of the period when tourism reached records and the year when this sector almost closed due to the Covid-19 pandemic. The structure of this article follows the following logic: a literature review on ratios and financial indicators; then, the methodological option is explained; the last section is dedicated to the detailed analysis of the results and the research conclusions.
Literature Review
The hotel activity in Portugal is considered one of the most important contributors to the country's economy. According to data presented by Deloitte (2020), tourism developments are classified into 6 different typologies: hotel, tourist flat, flat hotel, rural hotel, tourist village and guesthouse. According to the same report, hotels represent a large part of the supply (71%) of tourism developments in Portugal; for this reason, it is considered important to analyze the financial ratios of this typology.
According to Mia & Patiar (2001), hotel managers could use the management accounting system to position their hotel in the competitive market. Altman (1968) has a similar opinion and states that "the detection of the company operating, and financial difficulties is a subject which has been particularly susceptible to financial ratio analysis” and that “in general ratios measuring profitability, liquidity and solvency prevailed as the most indicators". The same author adds that the order of their importance is not clear.
Chiu & Huang (2011), in a study designed to evaluate the optimal occupancy rate, operational efficiency, and profitability of Taiwan's international tourist hotels, found that using operational efficiency alone to evaluate performance is insufficient; the authors suggest that adding operational efficiency as an indicator helps a better analysis of hotel industry performance measures. Lamminmaki (2008) mentions that the outsourcing of management accounting is increasing the influence in terms of financial and non-financial accountability. However, Mia and Patiar (2001) state that managers place more emphasis on financial indicators than non-financial ones, which requires further research.
The analysis of financial ratios makes it possible to assess a company's performance and obtain useful information about it (Nikolaos et al., 2020). Faello (2015) agrees and highlights those financial ratios and indicators help clarify the information present in financial statements, assess a company's performance with other companies in the same industry, and help managers and users of financial statements identify problems in operations. In this context, Faello (2015) concludes that these benefits depend on the comparability of financial ratios and indicators of a company with itself and between companies over time, because they allow an accurate view of the past, present and future of the company under analysis (Vassilou & Nikolaos, 2008). Phillips’s research, a table is presented that includes previous studies of joint ventures, where financial ratios and indicators such as three-year average sales and earnings, profitability, return on sales, return on equity, return on assets, stock prices, "shareholder return, and earnings per share" are mentioned.
In an analysis of small independent hotels in Ireland, Melia & Robinson (2010) conclude that annual accounts, operating profit margin, asset turnover, return on investment, sales, and earnings per share are the preferred measures of financial performance that are critical to the success and development of their business.
In opposition, Karadag (2015) argues that Indian business owners consider financial accounting a waste of time without tangible benefits. On the other hand, Harris & Brown (1998) argue that accountants have a very important role in the hospitality management process.
Harris & Brown (1998) explain that accounting and financial accounting knowledge and skills are required by all members of the management team in hospitality organizations. Briciu et al. (2013) confirm that accounting information is very useful in the decision-making process in the Romanian hospitality industry. Karadag (2015) states that strategic financial information is one of Turkey’s main areas of management because of its vital role in its survival, growth, and performance.
According to Ryu & Jang (2004), the true economic health of a company cannot be fully measured with an accrual accounting system alone. Ryu & Jang (2004) add that financial ratio analysis has been widely used for a long time, to assess financial performance by managers. In the same authors' study, a table was presented with two categories of ratios, "traditional" and "cash flow", indicating the ratios and formulas, which are related to "liquidity", "solvency", and "profitability".
This set of financial ratios is important, as they should be considered as final indicators of hotels' performance that contribute to their financial balance (Ben & Goaied, 2016). The financial balance consists of a short- and long-term analysis, which ensures stability in terms of liquidity and structure (Mihajlovi? et al., 2015). Security in terms of profitability and turnover can be added. To assess financial balance, Schmidgall & DeFranco (2004) reinforce those ratios can be divided into liquidity, solvency, activity, and profitability.
According to most of the authors mentioned above, the ratios have been organized into four groups:
• Liquidity.
• Solvency.
• Activity.
• Profitability.
Liquidity ratios measure the hotel's ability to meet its short-term liabilities such as cash, bank accounts, and accounts receivable or inventories (Table 1). By calculating these ratios, hotels can assess the state of short-term financial balance because it establishes a relationship between current assets and liabilities (Lima Santos et al., 2021).
| Table 1 Liquidity Ratios |
|
|---|---|
| Current ratio | 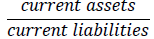 |
| Quick ratio | 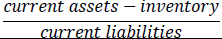 |
| Cash ratio | 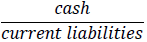 |
| Working capital |  |
| Liquidity margin |  |
Solvency ratios present the assessment of the hotel's ability to meet its long-term obligations (table 2). By calculating these ratios, hotels can assess the state of long-term financial balance, because it establishes a relationship between financing and investment (Bordeianu & Radu, 2020).
| Table 2 Solvency Ratios |
|
|---|---|
| Investment coverage ratio | 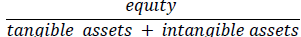 |
| Fixed assets coverage ratio | 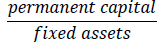 |
| Financial autonomy ratio | 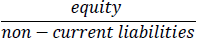 |
| Solvency |  |
The ratios and indicators are related to the hotel's activity (table 3). These ratios and indicators provide information about the reasonableness of the value expressed in some balance sheet items (CFI, 2022).
| Table 3 Activity Ratios |
|
|---|---|
| Average time of cash payments | 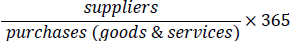 |
| Average time of cash receipts | 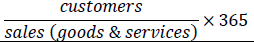 |
| Days’ sales in inventory |  |
| Breakeven point |  |
Profitability ratios and indicators, relevant to this study, provide knowledge of the profitability of the hotel. As the name suggests, it evaluates the management of the hotel, through the relationship between income and other variables in the financial statements (table 4) (Dimitri? et al., 2019). By (Bordeianu & Radu, 2020), profitability is the ability of a company to achieve profit to reflect performance. According to Lima, et al., (2021), “profitability reflects the company’s ability to generate profits” and “ratios provide an insight into the degree of success in achieving this purpose”, allowing you to relate the profits made to figures in the financial statements.
| Table 4 Profitability Ratios |
|
|---|---|
| Return on equity (ROE) |  |
| Return on assets (ROA) |  |
| Return on sales (ROS) |  |
ROE is a profitability ratio that describes the company's ability to provide benefits to shareholders/owners by showing the net income available to equity shareholders who have used the company (Almira & Wiagustini, 2020). This ratio is obtained by dividing net income after income tax by equity (Pareja, 2012). A high ROE reflects the company's success in generating profits from its capital. An increase in ROE will also increase the sale value of the company (Almira & Wiagustini, 2020). A low ROE, on the other hand, could mean trouble for a company. This ratio was previously used as a variable in a study on profitability and its determinants in a sample of over 2,000 hotels in Italy (Menicucci, 2018).
ROA serves to determine overall management effectiveness and derive a profit over total available assets; this ratio is obtained by dividing net income plus financial charges by the company's assets (Lima Santos et al. 2021; Pareja, 2012). ROA was also used in the study of Menicucci (2018) to compare the operating performance of the studied hotels; however, it is widely used in studies on banks (Al Nimer et al., 2015; Pointer & Khoi, 2019). A high ROA means that management is making good use of the company's capital. However, a low ROA can mean that the company is investing in unprofitable products or services, assets are being wasted, or are outdated. It can also mean that the company's operation has high expenses.
According to Chen & Lin (2015), ROE and ROA are the most popular profitability ratios used in the business and finance literature.
ROS compares net profit to company sales; this ratio measures how much each monetary unit sold is transformed into profit and determines the ability of management to generate profit through sales. A high ROS signifies operational efficiency; however, if the ROS is low, it may indicate financial difficulties for the company (AccountingTools, 2015).
ROS was used as a performance measure in the study of Lopez and Radzi (2012) to analyze the mediating effect of service quality on market orientation and business performance relationship of hotels in Klang Valley, Malaysia.
Lastly, following the literature review and the identification of the profitability ratios relevant to this study, the methodological option that led to the results will be explained.
Methodology
Portugal is a country where the tourism sector and the hospitality industry are very important in the economy. Considering the literature review on financial ratios, more specifically, profitability ratios (ROE, ROA, and ROS), we realize the need to conduct a larger number of empirical studies on these ratios.
Considering the objective of measuring the performance of hotels using profitability ratios and understanding the differences and similarities between hotels in the various regions of Portugal, this study allows us to assess the management of Portuguese hotels through the relationship between net income and the different variables in the financial statements.
By collecting information on various financial elements of hotel companies present in the SABI platform (Van Dijk, 2022), this study opted for a quantitative (Kauark et al., 2010), like the studies conducted by Lima Santos, et al. (2021); Lucas & Ramires (2021); Tourita, et al. (2019).
This research focused on the Portuguese hotel companies present on the SABI platform. Data was collected on April 28, 2022, and the Economic Activity Codes (EAC) representing the companies under study are: "55111-Hotels with the restaurant" and "55121-Hotels without restaurant" in the 7 Portuguese regions according to NUT II (Pordata, 2022). The period chosen for the data analysis was between 2016 and 2020 (table 5), to compare the period when the hotel industry evolved significantly and the year when the Covid-19 pandemic emerged, causing high economic losses in the hospitality industry.
| Table 5 Number Of Hotels And Rooms In Portugal |
||||||||||
|---|---|---|---|---|---|---|---|---|---|---|
| Regions of Portugal | Number of hotels | Number of rooms | ||||||||
| 2016 | 2017 | 2018 | 2019 | 2020 | 2016 | 2017 | 2018 | 2019 | 2020 | |
| North | 315 | 326 | 363 | 380 | 347 | 17,768 | 18,356 | 19,916 | 20,910 | 18,886 |
| Centre | 304 | 315 | 344 | 349 | 304 | 16,461 | 17,214 | 18,208 | 18,391 | 15,814 |
| Lisbon Metropolitan Area | 250 | 270 | 276 | 291 | 205 | 25,790 | 26,950 | 27,314 | 28,239 | 18,396 |
| Alentejo | 88 | 95 | 101 | 102 | 93 | 3,660 | 3,883 | 3,952 | 4,167 | 3,897 |
| Algarve | 135 | 148 | 158 | 164 | 149 | 18,040 | 18,766 | 19,410 | 20,345 | 17,397 |
| Autonomous Region of Azores | 68 | 71 | 73 | 75 | 48 | 4,156 | 4,344 | 4,448 | 4,612 | 2,951 |
| Autonomous Region of Madeira | 77 | 84 | 85 | 88 | 59 | 8,951 | 9,447 | 9,567 | 10,021 | 6,748 |
| Total | 1,237 | 1,309 | 1,400 | 1,449 | 1,205 | 94,826 | 98,960 | 102,815 | 106,685 | 84,089 |
The search on the SABI platform began with selecting companies by name, corporate tax number, region, net income for the year, equity, financial costs and losses, total assets, operating income, and turnover. This data was essential to identify the companies, elaborate the calculation of the profitability ratios, and allow the analysis across the various regions of Portugal. Thus, the initial search resulted in 5,266 hotels. Later, after the analysis of these variables, 1,363 hotel companies were eliminated due to lack of information, thus considering a total of 3,903 companies that remained in the sample.
After this first analysis, 1,139 hotels were eliminated due to a lack of data on return on equity and 712 due to a lack of data on return on sales. Thus, the sample consists of 2,052 hotels. The data were analyzed to the SPSS Software, as in the study of Poon & Low (2005) to obtain the results of the present study, and it was necessary to remove 44 outliers. The final sample comprises 2,008 hotels.
Results and Discussion
The sample in the study is made up of 2,008 hotel companies belonging to EAC Rev.3 – 55111 and 55121. The hotel companies are geographically distributed according to Nomenclature of Territorial Units for Statistics Purposes (NUT). This nomenclature of territorial units is segmented into three levels, and it was chosen the level 2 (NUT 2), as it can be consulted in the following table 6.
| Table 6 Hotel Companies According To Nut II |
|||
|---|---|---|---|
| Region | Number | Percentage | |
| Alentejo | 87 | 4.3% | |
| Algarve | 380 | 18.9% | |
| Centre | 218. | 10.9% | |
| Lisbon Metropolitan Area | 639 | 31.8% | |
| North | 462 | 23.0% | |
| Autonomous Region of Madeira | 129 | 6.4% | |
| Autonomous Region of Azores | 93 | 4.6% | |
| Portugal | 2,008 | 100% | |
Lisbon Metropolitan Area is the region with the largest number of hotels which were analyzed followed by the northern region. This does not coincide with Pordata information (table 6), where North is highlighted with the greatest number of hotels. This can be explained by the fact of hotels do not provide complete information, making it impossible to study them.
Return on Equity
According to figure 1, if the average hotel ROE is analyzed considering all the samples, a decrease is verified since 2016, but always with a positive ROE until 2019. However, in 2020 the situation has changed radically, with hotels showing a ROE of -65.82%. In Portugal, ROE dropped by more than 700%, between 2016 and 2020. This presents the state of the hospitality industry due to the COVID-19 pandemic. The situation by region is similar, with all regions presenting a decrease between 2016 and 2019. The region that follows the pattern of the country is Lisbon Metropolitan Area, while the other regions present some oscillations. For instance, the Autonomous Region of Madeira had a negative ROE of 3.91% in 2017, which was recovered the following year, as can be seen in figure 1. In 2020 all the regions present a large drop in ROE, highlighting Lisbon Metropolitan Area with -90.22%. Alentejo is the region with the highest ROE (-10.36%) despite being negative.

Figure 1: Roe
Return on Assets
ROA is analyzed in figure 2, describing a similar condition. The average ROA of Portugal increased between 2016 and 2017, although a decline was registered in the following years, but with a positive ROA. In 2020, a negative ROA has occurred. This behavior of hotels is similar in all the regions analyzed. The Autonomous Region of Madeira has the worst ROA in 2020, over -23%.

Figure 2: Roa
Return on Sales
ROS can be observed in figure 3, where, in Portugal, represents an excellent value in 2016 and 2017, particularly the Autonomous Region of Madeira.

Figure 3:Ros
In the following years is detected a slight decrease, but with a positive value. In 2020, a major fall was followed due to the Covid-19 pandemic, which can be justified by negative incomes and low sales. The same scenario repeats in all the regions some more affected than others. About ROS, Algarve presents the worst scenario with a value of -6.051%.
Comparing Regions Performance
Despite presenting different values, hotel performance is broadly similar across the regions analyzed, but it is worth exploring statistically whether there are differences. Then, the Kruskal-Wallis test was used to compare whether the behavior of hotels regarding their profitability differs according to region. The hypothesis “H0: ROE/ROA/ROS distribution is equal across region categories” was formulated and tested. This hypothesis was rejected for the most part.
| Table 7 Kruskal-Wallis According To Nut II |
||
|---|---|---|
| Years | Significance | Decision |
| ROE 2020 | 0,000 | Reject |
| ROE 2019 | 0,002 | Reject |
| ROE 2018 | 0,220 | Not reject |
| ROE 2017 | 0,002 | Reject |
| ROE 2016 | 0,005 | Reject |
| ROA 2020 | 0,000 | Reject |
| ROA 2019 | 0,017 | Reject |
| ROA 2018 | 0,514 | Not reject |
| ROA 2017 | 0,007 | Reject |
| ROA 2016 | 0,018 | Reject |
| ROS 2020 | 0,000 | Reject |
| ROS 2019 | 0,006 | Reject |
| ROS 2018 | 0,001 | Reject |
| ROS 2017 | 0,000 | Reject |
| ROS 2016 | 0,000 | Reject |
According to table 2, only for 2018 and about ROE and ROA, hotels show the same performance in the different regions. For the other years, the situation differs, in other words, hotels present different performances corresponding to the regions that are located. In table 8 is described the extremes found, i.e. the regions with the highest value and the lowest value. In this way it can be seen how hotels in different regions behave in good times and in times of pandemic, serving as a basis of comparison for hoteliers.
| Table 8 Performance |
||
|---|---|---|
| Years | The region with the best performance | The region with the worst performance |
| ROE 2020 | Alentejo | Lisbon Metropolitan Area |
| ROE 2019 | Autonomous Region of Azores | Lisbon Metropolitan Area |
| ROE 2017 | Lisbon Metropolitan Area | Autonomous Region of Madeira |
| ROE 2016 | Algarve | Autonomous Region of Azores |
| ROA 2020 | Alentejo | Autonomous Region of Madeira |
| ROA 2019 | North | Autonomous Region of Madeira |
| ROA 2017 | Lisbon Metropolitan Area | Autonomous Region of Azores |
| ROA 2016 | Lisbon Metropolitan Area | Autonomous Region of Azores |
| ROS 2020 | Alentejo | Algarve |
| ROS 2019 | Autonomous Region of Madeira | Centre |
| ROS 2018 | North | Centre |
| ROS 2017 | Autonomous Region of Madeira | Autonomous Region of Azores |
| ROS 2016 | Algarve | North |
Alentejo, the region with the lowest number of rooms (table 5) and hotel companies (table 6), presents the best performance although negative, in 2020. Considering ROE, ROA and ROS the region with the worst performance diverge, Lisbon Metropolitan Area, Autonomous Region of Madeira, Algarve, respectively. These regions in some years showed the best performance.
Therefore, and according to the year, the situation diverges, so it can be noted that several factors inherent to the location influence the hotels’ performance, being more evident that after the pandemic the regions in the interior of Portugal and with less rooms and hotel units had lower negative impacts on profitability.
When hoteliers are doing the performance evaluation, they should compare with the average profitability of the region due to their divergences.
Conclusion
In the period 2016-2019 the hospitality industry in Portugal grew significantly and showed vitality, gaining positions in the main economic indicators of the country. In 2020, with the Covid-19 pandemic, the hospitality industry almost stagnated which had evident adverse effects on profitability indicators.
The main objective of this study was to analyze the performance of Portuguese hotels through the most relevant profitability indicators studied in the literature review: ROE, ROA and ROS. The evolution over the five years under analysis (2016-2020) provides a critical and relevant analysis in a period where the hospitality industry reached records in the first four years and in a last year affected by the global pandemic, the hospitality industry stagnated, a phenomenon that has been witnessed all over the world. The volatile global environment gives rise to oscillations in the performance of organizations and hotels in particular, so this study seeks to show hoteliers that evaluating performance through profitability is crucial in providing better informed decisions.
In terms of ROE there has been a decrease since 2016, but always with a positive ROE until 2019. In 2020 the situation changed radically, with the hotels presenting a global drop of 700% in ROE with an average of -65.82%. This situation was similar for all regions, although with some oscillations, with the Lisbon Metropolitan Area presenting the lowest ROE with -90.22% and the Alentejo region the highest ROE which, despite being negative, stood at -10.36%. In the same period the ROA describes a similar behaviour, i.e., it increased in 2016 and 2017; however, it decreased in 2018 and 2019 but remained positive. For the reasons indicated above, also in 2020 the ROA appears negative in all regions analysed, with the Autonomous Region of Madeira showing the worst ROA with -23%. As for the ROS the Autonomous Region of Madeira leads the positive values in 2016 and 2017. Similarly to ROA, the decrease in the two following years did not stop positive values from being observed. The very low sales and the maintenance of the main cost items led, in 2020, to a dramatic decrease in the ROS, a scenario that was repeated in all regions, with the Algarve region having the worst scenario with an average ROS of -6,051%.
In conclusion, the Portuguese hospitality industry had presented an excellent performance evaluation through profitability indicators, being a driver of the country’s economy. However, the Covid-19 pandemic changed the performance for the worst scenario and excellent measures are needed to return to 2016 levels. As the overall performance of hotels is divergent across regions, the calculation of average profitability is urgent, so hoteliers are being able to do a benchmark themselves more effectively. Although, it is convenient to analyze those regions most affected by the pandemic in other to take extra measures.
Acknowledgement
This paper is financed by National Funds of the FCT – Portuguese Foundation for Science and Technology within the project UIDB/04470/2020.
References
AccountingTools. (2015). Return on Sales. In QFINANCE Calculation Toolkit.
Al Nimer, M., Warrad, L., & Al Omari, R. (2015). The Impact of Liquidity on Jordanian Banks Profitability through Return on Assets. European Journal of Business and Management Www.Iiste.Org ISSN, 7(7), 229–232.
Almira, N., & Wiagustini, N. (2020). Return on Asset, Return on Equity, Dan Earning Per Share Berpengaruh Terhadap Return Saham. E-Jurnal Manajemen, 9(3), 1069–1088.
Crossref, GoogleScholar, Indexed
Altman, E.I. (1968). Financial Ratios, Discriminant Analysis and the Prediction of Corporate Bankruptcy.The Journal of Finance, 23(4), 589–609.
Crossref, GoogleScholar, Indexed
Anuar, H., & Chin, O. (2016). The Development of Debt to Equity Ratio in Capital Structure Model: A Case of Micro Franchising. Procedia Economics and Finance, 35, 274–280.
Crossref, GoogleScholar, Indexed
Ben Aissa, S., & Goaied, M. (2016). Determinants of Tunisian hotel profitability: The role of managerial efficiency.Tourism Management, 52, 478–487.
Crossref, GoogleScholar, Indexed
Bordeianu, G.-D., & Radu, F. (2020). Basic types of financial ratios used to measure a company’s performance. Economy Transdisciplinarity Cognition, 23(2), 53–58.
Briciu, S., Scorte, C., & Mester, I. (2013). The impact of accounting information on managerial decisions - Empirical study conducted in the hospitality industry entities in Romania. Theoretical & Applied Economics, 20(9), 27–38.
Campos, F., Lima Santos, L., Gomes, C., & Cardoso, L. (2022). Management Accounting Practices in the Hospitality Industry: A Systematic Review and Critical Approach.Tourism and Hospitality, 3(1), 243–264.
Crossref, GoogleScholar, Indexed
CFI Education. (2022). Activity Ratios - Overview, Categories, and Formulas. CFI Education Inc.
Chen, M.H., & Lin, C.P. (2015). The impact of corporate charitable giving on hospitality firm performance: Doing well by doing good? International Journal of Hospitality Management, 47, 25–34.
Crossref, GoogleScholar, Indexed
Chiu, Y.-H., & Huang, C.-W. (2011). Evaluating the optimal occupancy rate, operational efficiency, and profitability efficiency of Taiwan’s international tourist hotels.Service Industries Journal, 31(13), 2145–2162.
Crossref, GoogleScholar, Indexed
Deloitte. (2020). Atlas da Hotelaria 2020 – 15a edição.
Dimitric, M., Tomas ?ikovic, I., & Arbula Blecich, A. (2019). Profitability determinants of hotel companies in selected Mediterranean countries.Economic Research-Ekonomska Istrazivanja, 32(1), 1977–1993.
Crossref, GoogleScholar, Indexed
Faello, J. (2015). Understanding the limitations of financial ratios. Academy of Accounting and Financial Studies Journal, 19(3), 75–86.
Harris, P.J., & Brown, J.B. (1998). Research and development in hospitality accounting and financial management.International Journal of Hospitality Management, 17(2), 161–182.
Crossref, GoogleScholar,Indexed.
Jiang, Y., & Wen, J. (2020). Effects of COVID-19 on hotel marketing and management: a perspective article.International Journal of Contemporary Hospitality Management, 32(8), 2563–2573.
Crossref, GoogleScholar, Indexed.
Karadag, H. (2015). Financial Management Challenges In Small And Medium-Sized Enterprises: A Strategic Management Approach.EMAJ: Emerging Markets Journal, 5(1), 26–40.
Crossref, GoogleScholar, Indexed.
Kauark, F., Manhães, F., & Medeiros, C. (2010). Research Methodology: A Practical Guide. Itabuna: Via Litterarum.
Lamminmaki, D. (2008). Accounting and the management of outsourcing: An empirical study in the hotel industry. Management Accounting Research, 19(2), 163–181.
Crossref, GoogleScholar, Indexed
Lima Santos, L., Gomes, C., & Lisboa, I. (2021). The Impact of Macroeconomic Factors on the Hotel Industry Through the Financial Leverage Trends. In Handbook of Research on Financial Management During Economic Downturn and Recovery (pp. 94–111).
Crossref, GoogleScholar, Indexed
Lima Santos, L., Gomes, C., Malheiros, C., & Lucas, A. (2021). Impact Factors on Portuguese Hotels’ Liquidity. Journal of Risk and Financial Management, 14, 144–162.
Crossref, GoogleScholar, Indexed
Lima Santos, L., Silva, R., Cardoso, L., & Oliveira, C. (2022). Accounting and business management research : Tracking 50 years of country performance. Academy of Accounting and Financial Studies Journal, 26(2), 1–22.
Lopez, M. B., & Radzi, S. M. (2012). The mediating effect of service quality on market orientation and business performance relationship of hotels in Klang Valley. Current Issues in Hospitality and Tourism Research and Innovations, 309–313. https://doi.org/10.1201/b12752-60
Crossref, GoogleScholar, Indexed.
Lucas, A., & Ramires, A. (2021). Restaurants in Portugal: Management for liquidity or profitability? Reinventing Tourism for Upcoming Challenges, 27–28.
Melia, D., & Robinson, L. (2010). Towards Performance Measurement in Hotels - An Incremental Approach. In Contemporary Issues in Irish and Global Tourism and Hospitality (p. 244).
Menicucci, E. (2018). The influence of firm characteristics on profitability: Evidence from Italian hospitality industry. International Journal of Contemporary Hospitality Management, 30(8), 2845–2868.
Mia, L., & Patiar, A. (2001). The use of management accounting systems in hotels: An exploratory study.International Journal of Hospitality Management, 20(2), 111–128.
Mihajlovic, D., Stankovic, S., & Nikolic, M. (2015). Analysis financial balance as base management company. ????????? (Economics), 61(1), 141–149.
Crossref, GoogleScholar, Indexed
Nikolaos, Z., Christos, K., George, T., & Efstratios, L. (2020). Financial Analysis of Major Retail Chains within a Turbulent Economic Environment. Studies in Business and Economics, 15(3), 208–222.
Crossref, GoogleScholar, Indexed at.
Oliveira, J., Pereira, S., & Ribeiro, J. (2009). Accounting and management control: Theory, methodology and practice - Research in management accounting (1 Edition). Escolar Editora.
Pareja, I. (2012). Financial Ratio Analysis. In Universidad Tecnológica de Bolívar.
Phillips, P. A. (1996). Strategic planning and business performance in the quoted UK hotel sector: Results of an exploratory study. International Journal of Hospitality Management, 15(4), 347–362.
Crossref, GoogleScholar, Indexed
Pointer, L., & Khoi, P. (2019). Predictors of Return on Assets and Return on Equity for Banking and Insurance Companies on Vietnam Stock Exchange. Entrepreneurial Business and Economics Review, 7(4), 185–198.
Crossref, GoogleScholar, Indexed.
Poon, W. C., & Low, K. L. T. (2005). Are travellers satisfied with Malaysian hotels? International Journal of Contemporary Hospitality Management, 17(3), 217–227.
Crossref, GoogleScholar, Indexed.
Pordata. (2022). Tourist accommodations: total and by type of establishment and number of rooms. Fundação Francisco Manuel Dos Santos.
Ryu, K., & Jang, S. (2004). Performance measurement through cash flow ratios and traditional ratios: A comparison of commercial and casino hotel companies. Journal of Hospitality Financial Management, 12(1), 15–25. https://doi.org/10.1080/10913211.2004.10653783
Crossref, GoogleScholar, Indexed.
Schmidgall, R. S., & DeFranco, A. L. (2004). Ratio analysis: Financial benchmarks for the club industry.Journal of Hospitality Financial Management, 12(1), 1–14. https://doi.org/10.1080/10913211.2004.10653782
Crossref, GoogleScholar, Indexed.
Soehardi, S., & Untari, D. T. (2020). The Effect of Covid-19 Pandemic on Hotel Employees, Hotel Occopancy Rates and Hotel Tax Income in Jakarta, Indonesia. Systematic Reviews in Pharmacy, 11(12), 964–972.
Crossref, GoogleScholar, Indexed
Teperek, A., & Lima Santos, L. (2021). The economic impacts of tourism in the equatorials countries. Proceedings Book - International Tourism Congress XIII.
Tourita, Í., Gomes, C., Malheiros, C., & Lima Santos, L. (2019). Accounting for dissimilarities in hospitality costs among Portuguese Regions.XI International Tourism Congress (ITC´19), 189–201.
Van Dijk, B. (2022). SABI, Información Financiera de Empresas Españolas y Portuguesas.
Vassilou, D., & Nikolaos, E. (2008). Financial Administration (1st ed.). Rosili.
World Tourism Organization. (2021). International Tourism Highlights, 2020 Edition. In International Tourism Highlights, 2020 Edition. World Tourism Organization (UNWTO).
Received: 10-May-2022, Manuscript No. aafsj-22-11962; Editor assigned: 12-May-2022; PreQC No. aafsj-22-11962(PQ); Reviewed: 23-May-2022, QC No. aafsj-22-11962; Revised: 27-May-2022, Manuscript No. aafsj-22-11962(R); Published: 13-Jun-2022