Research Article: 2020 Vol: 24 Issue: 1
Merger and Acquisition Announcements and Shareholder's Value Creation: Evidence from the Banking Sector in Bahrain
Batool K. Asiri, University of Bahrain
Salwa A. Hameed, University of Bahrain
Abstract
This paper attempts to measure the reaction of investors toward the Merger and Acquisition (M&A) announcements by all listed banks on Bahrain Bourse. Thirty different announcements are considered from 2005 to 2017. Event study is employed and results show that the investors gained on average 0.54% cumulative abnormal return (CAR) on the announcement date and lost 2.81% over 60 days around the announcement day. Separating the sample into Islamic and conventional banks, the investors gained 6.14% cumulative average abnormal returns (CAAR) from the Islamic banks while lost 13.03% from the conventional banks. Findings also point out that the investors lost 6.44% when the announcement was by the target banks compared to a loss of only 0.99% by the acquirer banks. The paper concludes that Bahrain Bourse is not efficient in the semi-strong form and there is a scope for abnormal profits for the investors.
Keywords
M&A, Banks, Islamic, Conventional, Target, Acquirer, Event Study.
JEL Classifications
G21, G34
Introduction
Strategic alliances and Mergers and Acquisitions (M&As) are the dominant corporate strategies followed by organizations looking for enhanced value creation. The growing tendency towards M&As world-wide has been driven by intensifying competition. There is a need to reduce costs, reach global size, take benefit of economies of scale, increase investment in technology for strategic gains, desire to expand business into new areas and improve shareholder value (Sinha et al., 2010).
The rising popularity of M&As led to a surge of acquisitions despite the lukewarm performance. The motive behind M&As cited by literature include: capital operating synergies, capitalizing on undervalued target companies, creation of market power, opportunities lower taxes, strengthening of competitive position, facilitating entry to new markets, wealth transfers to shareholders from employees and bondholders (Agrawal & Jaffe, 2003). This merger mania has yielded intensive research in the topic. Despite a large body of literature, many puzzling questions remain unanswered. For instance, a common finding is that bank mergers do not create value, yet they continue to occur. This popularity of M&As has triggered world-wide studies of post-performance. Considerable literature exists in M&As in general and in banking sector particularly. Empirical evidence indicates that, on average, there is no statistically significant gain in either market performance or operating performance of the combined firms. Moreover, shareholders of target firms gain at the expense of the bidder firms. This has been documented over the course of many studies covering different time periods and across countries, and it is true whether one examines accounting data or the market value of equity (Al Sharkas and Hassan 2010).
The current study attempts to investigate the reaction of M&As announcement on the market value of banks listed on Bahrain Bourse. Bahrain is known for being a financial hub where offshore commercial banks both conventional and Islamic are operating. Banking sector is chosen because M&As are observed within this industry. An Event study methodology is employed to capture the reaction to M&As. The method helps to pin-point whether announcement of M&As event emits a positive signal that creates value for the entity. A 30-day event window is employed to investigate 30 announcements made (10 for the target and 20 for the acquirer) by three conventional banks and three Islamic banks, during a 13-year period. Although a positive or a negative response indicates that M&As are considered as a signal by the investors, the announcement could be viewed differently when the bank is Islamic or conventional or when the bank is an acquirer or a target.
The study has several contributions. First, as the first study on M&As in the banking sector in Bahrain, it can provide some insight on the extent to which M&As news create values to shareholders in the sector. Second, the study attempts to investigate if a significant difference exists in investors’ reaction between conventional versus Islamic banks. Finally, the study determines whether the announcement of M&As differ if the bank is an acquirer or a target.
The rest of this study is organized as follows: Section 2 provides information about Bahrain Bourse and the banking sector in Bahrain. Section 3 reviews the literature and introduces the theoretical framework. Section 4 describes the methodology and Section 5 portrays the analyses and findings. Finally, Section 6 presents discussion and conclusions drawn from the results.
Bahrain Bourse
The Bahrain Stock Exchange (BSE) was established in 1987 and officially commenced operations in 1989, with 29 listed companies. It operated as an autonomous institution supervised by an independent Board of Directors, chaired by the Governor of the Central Bank of Bahrain1. In 2010 the Bahrain Bourse (BHB) was established as a shareholding company to replace the Bahrain Stock Exchange. By the year 2019, 42 companies are listed including 7 commercial banks (4 conventional and 3 Islamic). Bahrain All Share Index is the main index in addition to Bahrain Islamic Index.
Banking Sector in Bahrain
According to the Bahrain Central Bank, the banking system accounts for more than 85% of total financial assets in Bahrain and consists of both conventional and Islamic. The conventional is composed of 23 retail banks, 69 wholesale banks, 2 specialized banks and 36 representative offices of overseas banks. The Islamic is composed of 6 retail banks and 18 wholesale banks. Banking sector in Bahrain used to lead the country as a financial center in the region. The Central Bank reported that the total banking sector assets in Bahrain was USD 192.5 billion as of December 2018 representing 5.4 times GDP in Q4 2018. Retail banking total assets continued growing to reach BD32.5 billion (USD 86.6%) in December 2018. As the Central bank also claimed: “Industry growth has been supported by an open market economy; stable and prudent macro-economic and fiscal policies; a credible regulatory framework in line with international standards; and a notably strong and well qualified local workforce. All these factors have combined to cement Bahrain's position as a regional banking hub, successfully attracting numerous foreign banking organizations to establish a physical presence in the country.” Bahrain is also one of the global leaders in Islamic finance and has introduced lots of Islamic products such as “Sukuk”.
Literature Review
Mergers and Acquistions
Considerable literature exists in M&As in general and in banking sector in particular. Some studies attempted to investigate the extent to which simillarity or complementarity between merging firms create value while studies attempted to measure the creation of value either to the acquirer firm, target firm or the combined firm. Accounting based information or stock market data were used to capture the effect of M&As on creating value.
Datta et al. (1992); Ramaswamy (1997); Shelton (1988); and Singh & Montgomery (1987) have suggested that similarity between merging entities is likely to create value. Others have argued that complementarity between merging firms is more likely to be valuable in a merging context (Harrison et al., 1991; Hitt et al., 1998; Larsson & Finkelstein 1999). Swaminathan et al. (2008) proposed and tested a contingency framework of when and how both similarity and complementarity can contribute to greater value creation. Their study focused on the consequences of M&As for the combined firm following a merger, it captures investors’ beliefs regarding the extent to which the value of the merged entity exceeds the sum of the values of the two firms operating on their own. It also reflects expectations regarding future cash flows of the merged entity (Bradley et al., 1988; Singh & Montgomery 1987). Their study concludes that strategic misalignment (i.e., merging firms having dissimilar resource configuration) can be more beneficial when diversification is the primary motive. In contrast, strategic emphasis alignment can create value when consolidation is the aim particularly in dynamic growing industries.
Acquiring firms that are involved in diversifying mergers are valued at a discount compared to firms that operate a single division, Berger & Ofek (1995). Graham et al. (2002) argued that acquirers experience an increase in the diversification discount as a result of adding an already “discounted” target. Doukas & Kan (2004) showed that the increase in the diversification discounts around mergers can be explained by a decrease in acquirers’ excess cash flow; an effect driven mainly by their sample of unrelated acquisitions. Another study of the impact of mergers in different industries is conducted by Pramod & Vidyadhar (2008). Analysis of acquiring corporation revealed that mergers had a slightly positive impact on profitability of firms in banking and finance industry, whereas the pharmaceuticals, textiles and electrical equipment sectors had a negative impact on the operating performance. Bino & Pana (2010) investigated the change in diversification discount/premium around pure, stock-for stock mergers by using the pooling-of-interest method of accounting. Their study found that upon the announcement of a stock-for stock merger, resulted in a loss of 1% on average by the acquiring firm while the target firm gains about 11%. In addition, the acquiring firm trades at a premium one year before the merger, while the target firm trades at a discount. These results support the findings of Graham et al. (2002) who reported that the significant change in the acquirer diversification discount subsequent to the merger completion results from adding a target firm that trades at a high discount. Isabel and Susana (2010) analyzed family versus non-family firm returns under different legal environments when M&As is announced. The findings show that family ownership has a significant positive influence on acquirer shareholder M&As valuation. However, a major shareholder ownership of 32% has a negative impact. Indhumathi et al. (2011) analyzed the performance of acquirer and target corporate firms before and after the period of merger. Results indicated that the acquirer corporate firms improved their financial performance after the merger. Karla (2013) investigation of whether all the firms that are merged/acquired are ending up with maximization of profits and shareholders’ value, indicated that there is a significant improvement in the liquidity, profitability, operating performance and financial leverage for a few merged/acquirer firms.
Mackenzie (2017) surveys acquisition activity in individual EU countries. Research results confirm the dependence between acquisition activity and economic performance and tax conditions. The higher the country’s economic performance the higher is the acquisition activity. Moreover, low tax burden in a developed country is stimulating and leads to higher acquisition activity. The upsurge of the ChinNext market during 2009-2016 is explored by Xu et al. (2018). IPO over-financing is the major driving force for M&A and leads to larger transaction size and higher transaction frequency. Furthermore, enterprises tend to carry out M&A via cash payment or cash and stock mixed payment method. Another driving force is market value overvaluation. In addition, to increasing M&As where the company uses the overvalued equity to acquire other companies, it also increases transaction size and frequency and leads to more uses of stock or cash-and-stock mixed payment in M&A transactions.
Mergers and Acquisitions - Event Study
Empirical results do not provide support to claims made by acquiring CEO’s that account-based measures are a better indicator of post-mergers performance than market-based measures (Kukalis, 2012).
Event study methodology is the most popular tool used in the literature to measure the reaction of investors to this event. It tends to measure market reactions to an exogenous shock. In this case the shock is the announcement of merger or acquisition. Duso et al. (2010) examined the usefulness of event study methodology based on stock market reactions and the accounting data methodology for merger analysis. They concluded that event study best uncovers anticompetitive effects due to a merger when looking at appropriately defined rivals and using a reasonably long window (50 days) before the merger. Abnormal returns (AR) and ex-post profitability of mergers are positively and significantly correlated for merging firms, and partially, also for their competitors. Shukla & Gekara (2010) examined financial ratios for the largest multinational merger in India in order to test the impact of mergers on the operating performance of the acquiring firms. Employing a 20-day window event study, they provided evidence that shareholders suffered loss for different windows around the announcement period. In France, Hamza (2009) conducted an event study to analyze bidder short-term returns of friendly takeovers during the period of 1997-2005. Results provided strong evidence that the announcement of takeover bid caused substantial abnormal returns for the bidder with toehold. Moreover, it is found that size of the target relative to the bidder does not affect the bidder gain, and no difference in market reaction is reported in domestic and foreign takeover announcements. Finally, the study reported that friendliness of acquisitions has not increased the bidder gains.
Padmavathy & Ashok (2012) event study reported that the acquiring firm’s shareholders are not getting significant positive cumulative returns from the announcement of the merger and hence concluded that merger announcement does not hold important information to the Indian stock market. Asiri (2015) tested investors’ reaction to announcements made by corporate management in the telecommunication sector in Bahrain over the period 2011-2014. The event study showed that investors did react to two types of signals namely; three marketing and three financial announcements. They gained abnormal returns from two financial signals and two marketing signals. On the other hand, a negative reaction had been observed for the two remaining signals. Such findings could be an indication that Bahrain Bourse is inefficient in the semi-strong form in the telecommunication sector. Indian evidence is provided by Rani et al. (2012) on the impact of domestic M&As on acquirer shareholders’ wealth using event study methodology. Three findings are reported, first, the acquirer earns abnormal returns when the target remains as a subsidiary, and that shareholders lose when the target firm is absorbed within the acquiring firm. Second, while using cash to finance acquisitions generated positive abnormal returns no such returns are observed when acquisitions are financed with stock. Finally, acquirers targeting unlisted firms experienced higher returns than those targeting listed firms. Cross-border acquisitions are studied by Dakessian & Feldman (2013). The event study of 607 announcements of acquisitions made during the period 1989-2011 indicated that these announcements did not on average create value for their shareholders; as a matter of fact, they had a neutral impact on short-term returns to investors. Furthermore, analysis revealed that relative size of the deals had a negative and significant effect on investors’ reaction and finally, cultural distance did matter since it had a negative and significant effect on the investors’ perceptions.
Satapathy & Kaushik (2015) applied event study methodology to explore the relationship between mergers and corporate performance in Indian companies during the period 2004-2014. Results indicate that acquiring companies have destroyed shareholders’ wealth during the post event window period. Although positive abnormal returns are experienced during the pre-event period, acquirer companies experience negative abnormal returns on the event date and continue to do so during the post-acquisition period in the short run. Corporate governance impact on short-term performance of acquisitions by listed French hi-tech firms is studied by Thraya et al. (2019). Twenty two key governance variables are investigated for the hi-tech sample firms and a control sample from other sectors of activity. The event study reveals that the performance of hitech acquiring firms with a good governance score is significantly higher than that of firms in the same sector with a lower score as well as firms in different sectors. Moreover, the performance of the sample firms is particularly better in the case of diversification operations.
Mergers and Acquistion in the Financial Sector
Considerable literature exists in M&As in general and in the banking sector in particular. Sinha et al. (2010) conducted a study to evaluate the financial performance of M&As in the financial sector in India before and after mergers and to assess its impact in terms of value creation for the merged or acquiring firms. The study concludes that M&As cases in India show a significant correlation between financial performance and M&As deal in the long run, and that acquiring firms were able to generate value. Al Sharkas & Hassan (2010) employed two new event study methodologies; EGARCH model since the focus was on interstate mergers, and a three-factor model that controls for exchange rate and interest rate. Both models showed that merger in the US during the period 1980-2000 was regarded as good news for the target and combined shareholders and as bad news for the bidder shareholders. Lower value for the combined firms are observed under the EGARCH (1,1) methodology than under the modified market methodology, suggesting that using the modified market methodology overstates the CARs. Shobana & Deepa (2012) investigated six banks mergers (4 forced and 2 voluntary) in India. The event study indicated a decline in shareholder wealth in two cases and in one case the merger neither created nor destroyed the wealth for their shareholders. The remaining three banks, however, created wealth for their shareholders irrespective of whether the merger is forced or voluntary. Furthermore, there was a decline in the shareholder wealth when the securities of the banks are more prone to market risk, whereas there is an increase in the shareholder wealth when the market risk of the private and public sector banks are the same as that of the market. Kumar & Fernandez (2011-2012) documented that merger announcement let to excess positive returns for the shareholders of both Emirate Bank International and the National Bank of Dubai at different windows. There was a higher growth return in total operating income and net profit as well as an increase in operating cash flow returns. M&As in Pakistan’s banking sector is investigated by Tauseef & Nishat (2014) during the period 2003- 2008. Cumulative abnormal returns for a 61-day event period revealed that both targets and bidders accumulated significant returns associated with merger deals. However, for the individual target or bidder bank these abnormal returns range from significant positive to significant negative. Combined target group ended up with negative excess returns while combined bidder group ended up with positive mean cumulative returns.
The impact of M&A processes on the stocks of Brazilian banks during the period 1994- 2011, is investigated by Bergmann et al. (2015). 40 operations, one merger and the remaining acquisitions are analyzed by means of event study methodology. The study is not able to state whether acquisitions created or destroyed value leading to the conclusion that acquisitions have not significantly impacted the market value of Brazilian banks. Value creation in US bank mergers before and after the Global Financial Crisis is examined by Do?an & Yildirim (2017). Event study analysis is conducted for a sample of 450 banks for the whole sample period (2000- 2014) and the sub-sample period of 2000-2007 (pre-Crisis period), 2008-2009 (Crisis period) and 2010-2014 (post-Crisis period). Findings reveal that M&A after the Crisis period (2010- 2014) yield higher gains for target, bidders and combined firms compared to lower gains during the pre-Crisis period (2000-2007). Reasons given by the study for such results include setting new regulations following the Crisis, and the fact that stronger and healthier banks surviving the Crisis could increase the quality of target pool to the acquirers. Moreover, results indicate that cash involved transactions and, geographically focused in-state transactions yield higher gains for the target bank shareholders. Rathinam & Sridharan (2016) employed ratio analysis to investigate post-mergers and acquisitions performance in the Indian banking sector. Analysis of five select banks reveal a significant increase in the earnings of shareholders in addition to a significant upward change witnessed in the long-term solvency position and in the overall efficiency of the banks. However, a little change is witnessed in the liquidity position. Geyfman & Walker (2018) explore the impact on the performance of US community banks during the period 2010-2015. A sample of 66 merger deals is investigated using accounting-based measures supplemented by market-based measures. Findings show that operating performance and efficiency of acquiring banks are superior to those of target banks prior to mergers and improved even further during the post-merger period. Furthermore, separating the deals by geography and relative size results reveal significant revenue gains in out-of-state (geographically diversified) mergers but greater possibility of cost reduction in the same-state mergers. Revenue improvement is reported for all bank-size combinations and a slightly improved performance in mergers of non-equals, according to the study there could be an incentive for small banks to grow larger to exploit scale economies and to achieve other scale-related benefits.
Based on the above litereature the current study employs an event methodology to investigate market reactions to M&As announcements in the banking sector of Bahrain over a period of 13-year. Accordingly, the following null and alternative hypotheses are formulated as follows:
1. To invistgate market reaction to the M&As announcements made by banks in Bahrain, the first null and alternative hypothsis are formulated:
Ho: CAR = 0 against Ha: CAR ≠ 0.
2. The second hypothesis is set to test whether investors’ reactions to M&As announcements by Islamic banks differ from their reactions to announcements made by conventional banks:
Ho: CARIslamic = CARConventional= 0 against Ha: CARIslamic≠ CARConventional≠ 0.
3. To investigate whether investors react differently toward announcements made by the acquirer as opposed to those made by the target led to the formulation of the third hypothesis as follows:
Ho: CAR Acquirer = CAR Target= 0 against Ha: CAR Acquirer≠ CAR Target≠ 0.
Research Method
The study employs an event-study methodoloy which posits that the stock price accurately reflects all public information related to the performance of the firm (Fama, 1970). This method is based on measuring the abnormal stock return that immediately follows an event which is the merger announcement relative to the average stock price level before the event, adjusted for general market movement.
The Sample
The sample includes all seven commercial banks listed in the Bahrain Bourse. All announcements regarding M&As of sample banks are collected from the period 2005-2017 and are classified as acquirer or target (buyer or seller) and totaled 47 announcements.
Banks and announcements are dropped from the sample if they (1) did not have enough data or information; (2) did not have M&As announcements during the period of the study, (3) have overlapping of announcements. As a result, the sample ended up with 30 announcements for six commercial banks of which three are conventional and the other three are Islamic banks (Appendix 1). From these announcements 10 are for target (sellers) and 20 for acquirer (buyers) announcements. Consequently, the sample is then divided into Islamic versus conventional and target versus acquirer as detailed in Table 1.
| Appendix 1 | |
| Announce Date | Deal Title |
| 16 Apr '14 | Rumored Bidder rumored to offer to acquire Ahli United Bank |
| 16 Apr '14 | AUB offers to acquire Middle East Brokerage Co. LLC from |
| 01 June '13 | Alsalam announce to take over BMI |
| 10 Mar '13 | NBB, Social Insurance Org. Asset Mgt Co. Bsc takes a majority stake in BisB from The Investment Dar KSCC |
| 01 Oct '12 | Ithmaar Bank acquires First Leasing Bank |
| 31 Jan '12 | Kuwait & Middle East Financial Investment Co. KSCC |
| 12 Mar '12 | BBK takes a minority stake in Saudi Mais Co. For Medical Products |
| 09 Aug '11 | Bahrain Islamic Bank fails to acquire Al Salam Bank |
| 10 Aug '05 | AUB takes a minority stake in Bank of Kuwait & Middle East KSC |
| 01 Jul '10 | International Financial Advisors KSC takes a minority stake in Kuwait Clearing Co. |
| 14 Mar '10 | BBK takes a minority stake in Ebla Computer Consultancy Co. KSCC |
| 02 Feb '10 | BBK acquires Sakana Holistic Housing Solutions from Shamil Bank of Bahrain |
| 16 Jun '10 | Ithmaar Bank acquires RBS Pakistan from RFS Holdings BV |
| 02 Feb '10 | BBK acquires Sakana Holistic Housing Solutions BSC from Shamil Bank of Bahrain |
| 16 Feb '10 | AUB takes a minority stake in United Bank for Commerce & Investment |
| 23 Aug '09 | AUB takes a majority stake in Ahli United Bank (Egypt) SAE |
| 23 Aug '09 | AUB takes a majority stake in Commercial Bank of Iraq |
| 19 May '08 | Ithmaar Bank takes a minority stake in BBK |
| 18 Feb '08 | Ithmaar Bank takes a minority stake in BBK |
| 12 Feb '08 | Global Investment House KSCC takes a minority stake in BBK |
| 19 May '08 | Ithmaar Bank takes a minority stake in BBK |
| 18 Feb '08 | Ithmaar Bank takes a minority stake in BBK |
| 30 Jun '08 | Bahrain Islamic Bank takes a minority stake in Islamic Bank of Yemen for Investment & Finance |
| 19 May '08 | Ithmaar Bank BSC takes a minority stake in BBK |
| 18 Jun '07 | AUB takes a minority stake in Alliance Housing Bank |
| 15 Nov '07 | Ithmaar Bank acquires Shamil Bank of Bahrain |
| 15 Nov '07 | Ithmaar Bank takes a minority stake in CITIC International Assets Management Ltd. |
| 04 Dec '06 | from CITIC International Financial Holdings Ltd. |
| 21 Aug '06 | AUB takes a majority stake in Delta International Bank |
| 10 Jul '06 | Delta International Bank /Private Group/ offers to take a majority stake in Delta International Bank |
| 15 Aug '06 | Dar Al Maal Al Islami Trust acquires Islamic Investment Co. of the Gulf (Bahamas) Ltd. from Ithmaar Bank |
| 15 Aug '06 | Ithmaar Bank takes a majority stake in Shamil Bank of Bahrain from Dar Al Maal Al Islami Trust |
| 09 Dec '05 | AUB takes a minority stake in Commercial Bank of Iraq |
| 14 Jun '05 | Standard Chartered Bank acquires BBK /Indian Banking Operations/ from BBK |
| 08 Dec '05 | AUB takes a minority stake in Commercial Bank of Iraq |
| 06 Oct '05 | Kuwait Investment Co. SAK offers to take a minority stake in Bahrain Islamic Bank |
| 01 Oct '02 | Shamil Bank of Bahrain takes a majority stake in Faisal Finance (Switzerland) SA |
| 01 Dec '99 | Al Ahli Commercial Bank acquires United Bank of Kuwait |
| 01 May '98 | Workplace Systems Plc acquires Care Interactive Software Ltd. from United Bank of Kuwait |
| Table 1 List of the Banks and the Merger and Acquisitions’ Announcements | ||||
| Bank | Bank | No. of Announcements | Acquirer | Target |
| Islamic | Ithmar: Ithmar Bank | 8 | 7 | 1 |
| Alsalam: Alsalam Bank | 4 | 3 | 1 | |
| BisB: Bahrain Islamic Bank | 4 | 2 | 2 | |
| Total | 16 | 12 | 4 | |
| Conventional | NBB: National Bank of Bahrain | 1 | 1 | - |
| AUB: Al Ahli United Bank | 7 | 5 | 2 | |
| BBK: Bank of Bahrain and Kuwait | 6 | 2 | 4 | |
| Total | 14 | 8 | 6 | |
| Grand Total | 30 | 20 | 10 | |
Methodology
Event study methodology is used to test the reaction of the market to these announcements. Announcements are selected after a careful investigation ensuring that no other simultaneous events occurred during the same period or during the event window (±30 days of the event). The analysis of the sample events would then reveal whether investors’ reactions to M&As announcements by Islamic banks differ from the conventional banks. It will also question whether investors react differently toward the announcements by the acquirer bank or the target bank. If investors’ reactions are positive, it will be left to determine whether they react to all announcement types equally, and whether their reactions do, indeed, generate some abnormal returns. On the other hand, if investors showed no reaction to the announcements, then the banking sector of the Bahrain market could be deemed efficient in the semi-strong form.
In the event study, the event day, which is the announcement of M&As, is considered as the day zero (0) and thirty days before and after this day is tested. The stock market reaction is measured by the abnormal returns (AR) and the cumulative abnormal returns (CARs) during the “event window” of -30 to +30 days of the event. It is worth mentioning here that in addition to the ±30 days, a shorter window of ± 10 days (shaded area in Tables 2-4), is also used. The purpose of this shorter period window indicates how long it takes investors to react before and after the announcement. The ± 10-day is reported in the summary results as a shaded area.
| Table 2 Abnormal and Cumulative Abnormal Returns ++ “The Full Sample” | ||
| Days | Abnormal Returns (AR) % | Cumulative Abnormal Return (CAR) % |
| -30 | -0.70 | -0.70*** |
| - | - | - |
| -20 | -0.05 | 1.12*** |
| -19 | 0.63 | 1.75*** |
| -18 | -0.56 | 1.19*** |
| -17 | -0.68 | 0.51 |
| -16 | 0.81 | 1.32*** |
| -15 | -0.51 | 0.81** |
| -14 | 0.37 | 1.18*** |
| -13 | -0.08 | 1.10*** |
| -12 | -0.20 | 0.90*** |
| -11 | -0.69 | 0.21 |
| -10 | -0.36 | -0.16 |
| -9 | -0.08 | -0.23 |
| -8 | 0.64 | 0.41 |
| -7 | -0.09 | 0.31 |
| -6 | -0.63 | -0.32 |
| -5 | -0.58 | -0.90** |
| -4 | 0.37 | -0.53 |
| -3 | 0.19 | -0.34 |
| -2 | -0.57 | -0.92** |
| -1 | 0.19 | -0.73 |
| 0 | 1.27 | 0.54 |
| 1 | -0.28 | 0.26 |
| 2 | 0.63 | 0.89* |
| 3 | -0.35 | 0.54 |
| 4 | 0.80 | 1.33** |
| 5 | 0.91 | 2.24*** |
| 6 | -0.36 | 1.88*** |
| 7 | -0.63 | 1.25** |
| 8 | 0.21 | 1.45** |
| 9 | -0.37 | 1.09** |
| 10 | 0.18 | 1.27** |
| 11 | -0.47 | 0.80 |
| 12 | -0.57 | 0.23 |
| 13 | -0.56 | -0.33 |
| 14 | 0.23 | -0.10 |
| 15 | -0.43 | -0.52 |
| 16 | -0.26 | -0.78 |
| 17 | 0.20 | -0.58 |
| 18 | -0.40 | -0.98* |
| 19 | 0.17 | -0.82 |
| 20 | -0.07 | -0.89 |
| - | - | |
| 25 | 0.36 | -2.00*** |
| - | - | |
| 30 | -1.05 | -2.81*** |
Note: The Highlighted area is the ±10 days around the event day (0)
| Table 3 Cumulative Abnormal Return (CAR++) and Abnormal Returns (AR++) of the Conventional and Islamic Banks | |||||
| Days | Conventional | Days | Islamic | ||
| AR% | CAR% | AR% | CAR% | ||
| -30 | -1.83 | -1.83*** | -30 | 0.29 | 0.29** |
| -29 | 2.93 | 1.10 | -29 | -0.50 | -0.21* |
| ... | ... | ... | ... | ... | ... |
| -24 | 0.35 | 1.21 | -24 | 0.53 | 1.76*** |
| -23 | -0.50 | 0.71 | -23 | 0.31 | 2.07*** |
| -22 | -0.87 | -0.03 | -22 | 0.30 | 2.37*** |
| -21 | 0.20 | 0.17 | -21 | -0.32 | 2.05*** |
| -20 | 0.17 | -0.19 | -20 | 0.23 | 2.28*** |
| ... | ... | ... | ... | ... | ... |
| -15 | -0.96 | 0.36 | -15 | -0.11 | 1.21* |
| -14 | 0.01 | 1.24 | -14 | -0.09 | 1.12* |
| -13 | -0.38 | 0.86 | -13 | 0.19 | 1.31* |
| -12 | -0.29 | 0.54 | -12 | -0.11 | 1.22* |
| -11 | -1.44 | -0.91 | -11 | -0.04 | 1.18* |
| -10 | -0.25 | -1.35* | -10 | -0.29 | 0.89 |
| -9 | 0.16 | -1.19 | -9 | -0.28 | 0.61 |
| -8 | 0.22 | -0.28 | -8 | 0.40 | 1.01 |
| -7 | 0.55 | 0.27 | -7 | -0.66 | 0.34 |
| -6 | -0.53 | 0.00 | -6 | -0.97 | -0.61 |
| -5 | -1.19 | -1.19 | -5 | -0.05 | -0.66 |
| -4 | 0.62 | -0.39 | -4 | 0.00 | -0.65 |
| -3 | 0.15 | -0.24 | -3 | 0.23 | -0.43 |
| -2 | -2.43 | -1.47 | -2 | -0.01 | -0.43 |
| -1 | 0.53 | -0.94 | -1 | -0.11 | -0.54 |
| 0 | 0.11 | 1.14 | 0 | 0.55 | 0.01 |
| 1 | -0.93 | 0.21 | 1 | 0.29 | 0.30 |
| 2 | -0.43 | -0.10 | 2 | 1.43 | 1.75* |
| 3 | -0.78 | -0.88 | 3 | 0.03 | 1.78* |
| 4 | 0.08 | 0.05 | 4 | 0.68 | 2.45** |
| 5 | 1.11 | 1.16 | 5 | 0.73 | 3.19*** |
| 6 | -0.82 | 0.42 | 6 | -0.04 | 3.15*** |
| 7 | -1.56 | -1.14 | 7 | 0.19 | 3.34*** |
| 8 | -0.17 | -0.79 | 8 | 0.08 | 3.42*** |
| 9 | -0.38 | -1.17 | 9 | -0.36 | 3.06*** |
| 10 | -0.76 | -1.41 | 10 | 0.54 | 3.61*** |
| 11 | -1.37 | -2.78*** | 11 | 0.32 | 3.93*** |
| 12 | -0.98 | -2.69*** | 12 | -1.15 | 2.78*** |
| 13 | -0.85 | -3.54*** | 13 | -0.30 | 2.48** |
| 14 | -0.73 | -3.54*** | 14 | 0.44 | 2.91*** |
| 15 | -0.01 | -3.55*** | 15 | -0.79 | 2.12** |
| ... | ... | ... | ... | ... | ... |
| 20 | -0.73 | -5.86*** | 20 | 0.55 | 3.46*** |
| 21 | -1.68 | -7.54*** | 21 | -0.70 | 2.77*** |
| 22 | -0.41 | -7.34*** | 22 | -0.21 | 2.56** |
| 23 | -1.64 | -8.98*** | 23 | 0.20 | 2.76*** |
| 24 | -0.20 | -8.56*** | 24 | 0.30 | 3.06*** |
| ... | ... | ... | ... | ... | ... |
| 29 | -0.63 | -10.99*** | 29 | 1.00 | 6.31*** |
| 30 | -2.23 | -13.03*** | 30 | -0.17 | 6.14*** |
Note: The Highlighted area is the ±10 days around the event day (0)
| Table 4 Cumulative Abnormal Return (CAR++) and (AR++) of the Target and The Acquirer Banks | |||||
| Days | Target | Days | Acquirer | ||
| AR% | CAR% | AR% | CAR% | ||
| -30 | -0.68 | -0.68*** | -30 | -0.71 | -0.71*** |
| -29 | -0.47 | -1.15*** | -29 | 1.89 | 1.18*** |
| … | … | … | … | … | … |
| -24 | -0.17 | -0.82 | -24 | 0.64 | 2.66*** |
| -23 | -0.53 | -1.35 | -23 | 0.16 | 2.83*** |
| -22 | -0.33 | -1.69 | -22 | -0.12 | 2.72*** |
| -21 | -1.13 | -2.82** | -21 | 0.45 | 3.17*** |
| -20 | 0.00 | -2.82*** | -20 | 0.28 | 3.09*** |
| … | … | … | … | … | … |
| -15 | -0.50 | -1.13** | -15 | -0.51 | 1.78*** |
| -14 | -0.13 | -1.26** | -14 | -0.16 | 2.40*** |
| -13 | -0.45 | -1.71*** | -13 | 0.11 | 2.51*** |
| -12 | -0.47 | -2.18*** | -12 | -0.06 | 2.44*** |
| -11 | -1.75 | -3.93*** | -11 | -0.16 | 2.27*** |
| -10 | 0.47 | -3.46*** | -10 | -0.56 | 1.50** |
| -9 | -0.19 | -3.64*** | -9 | -0.02 | 1.47** |
| -8 | 0.75 | -2.90*** | -8 | 0.08 | 2.06*** |
| -7 | -0.30 | -3.19*** | -7 | 0.01 | 2.06*** |
| -6 | -0.04 | -3.23*** | -6 | -1.13 | 1.13 |
| -5 | -0.33 | -3.57*** | -5 | -0.70 | 0.43 |
| -4 | -0.07 | -3.64*** | -4 | 0.17 | 1.02 |
| -3 | 0.11 | -3.52*** | -3 | 0.23 | 1.25 |
| -2 | 0.03 | -3.49*** | -2 | -1.74 | 0.37 |
| -1 | -0.08 | -3.57*** | -1 | 0.32 | 0.69 |
| 0 | 0.08 | -3.49*** | 0 | 0.46 | 2.55*** |
| 1 | 0.56 | -2.93*** | 1 | -0.70 | 1.86** |
| 2 | 0.92 | -2.01* | 2 | 0.38 | 2.34*** |
| 3 | -0.08 | -2.09* | 3 | -0.49 | 1.85** |
| 4 | 0.80 | -1.29 | 4 | 0.18 | 2.64*** |
| 5 | 0.88 | -0.41 | 5 | 0.93 | 3.57*** |
| 6 | -0.49 | -0.90 | 6 | -0.28 | 3.26*** |
| 7 | -0.67 | -1.57 | 7 | -0.61 | 2.66*** |
| 8 | -0.34 | -1.91 | 8 | 0.21 | 3.14*** |
| 9 | -0.19 | -2.10* | 9 | -0.45 | 2.68*** |
| 10 | -0.56 | -2.66** | 10 | 0.17 | 3.23*** |
| 11 | 0.40 | -2.27* | 11 | -0.90 | 2.33*** |
| 12 | -0.81 | -3.07** | 12 | -1.22 | 1.88** |
| 13 | -1.12 | -4.19*** | 13 | -0.28 | 1.60** |
| 14 | -0.43 | -4.62*** | 14 | 0.03 | 2.16*** |
| 15 | -0.65 | -5.28*** | 15 | -0.31 | 1.85*** |
| … | … | … | … | … | … |
| 20 | -0.94 | -6.39*** | 20 | 0.37 | 1.87** |
| 21 | -0.03 | -6.42*** | 21 | -1.72 | 0.15 |
| 22 | 0.39 | -6.03*** | 22 | -0.86 | -0.08 |
| 23 | -0.67 | -6.70*** | 23 | -0.65 | -0.72 |
| 24 | -0.00 | -6.71*** | 24 | 0.08 | -0.19 |
| … | … | … | … | … | … |
| 29 | 0.08 | -4.47 | 29 | 0.32 | -0.41 |
| 30 | -1.97 | -6.44** | 30 | -0.73 | -0.99 |
Note: The shaded area is the ±10 days around the event day (0)
Closing daily share prices, cash dividends and the All-Share Index are extracted from the Factset database and the Bahrain Bourse. The data is used to calculate the abnormal returns for the sample over the period of the study from 2005 to 2017. All qualitative data regarding the M&As news is extracted from the Bahrain Bourse.
Actual returns are calculated by the change in prices plus the dividend yield using the following equation:
 (1)
(1)
Where,
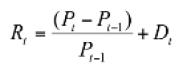
Rt = actual return for the period t
Pt = current market price for bank i
Pt-1 = price for the previous day
Dt = dividend yield
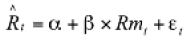
The expected returns are calculated using the security market line capital asset pricing model (CAPM) as follows:
 (2)
(2)
Where,
 = expected returns for time t
α, β = regression coefficients for the market model parameters
Rmt = market returns for period t
εt = error in the model
The event day, which is the announcement date is indicated as t = 0. Using ordinary least square (OLS) regression model, the parameters (α and β) are estimated using 300-day time period, -270 to -31 day before the announcement day of the event. Asiri (2015) used 240 days to estimate the parameters, i.e. -210 to -31 day before the announcement day of the event.
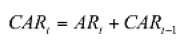
Expected returns are then determined using the above estimated parameters. Furthermore, the difference between the expected and the actual returns are computed in order to determine the abnormal returns (AR). Once ARs are determined in time t, cumulative abnormal returns (CARs) are calculated as follows:
 (3)
(3)
Where,
CARt = summation of AR for time t and CARt-1
The AR and the CARs are computed over the 60 days covering the event day (day 0), ±30 days before and after the event. Statistically testing CAR for the full sample, the null and the alternative hypothesis are formulated as follows: Ho: CAR = 0 against Ha: CAR ≠ 0. It is worth noting that since the study is a cross-sectional analysis, then AR represents average abnormal returns (AAR) and CAR represents the cumulative average abnormal returns (CAAR).
To test whether CARs are significantly different from zero, t-test is used and formulated as follows:
 (4)
(4)
Where,
n = number of observations
s = standard deviation of the CARs, computed as follows:
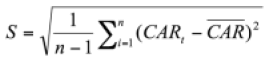 (5)
(5)
The second hypothesis to be tested is that there is no significant difference in the reaction of the market toward the announcements made by Islamic and conventional banks. Ho: CAR Islamic = CARConventional= 0 against Ha: CAR Islamic≠ CARConventional≠ 0. Here we run two tests, one for the Islamic banks and the other one for the conventional banks. The third hypothesis to be tested is that investors do not differentiate between announcements from target or acquirer banks. Hence, Ho: CAR Acquirer = CAR Target= 0 against Ha: CAR Acquirer≠ CAR Target≠ 0.
Results
Analyzing the movement of the Bahrain All Share Index during the study period 2005 to 2017, Figure 1 highlights the increase in the index for year 2000 to 2008 followed by a sharp drop during the Global Financial Crisis period 2008-2009. The decline continues until the year 2013 and starts again to rise till the year 2018. To avoid bias in the results, any announcement during this period is dropped from the study.

Figure 1 Bahrain all Share Index – 2003-2018
Table 2 highlights the results of the event study for the whole sample including all the M&A announcements. The results indicate that over the 60 days around the announcement day, investors, on average, generate positive value of abnormal returns (all figures are in percentage). On day -29, CAR equals to 0.4 and increased to 1.03 on day -25. The positive CAR continued until day -11 and reached to 0.21. On day -11, due to high negative AR (-0.69), the CAR turned to be negative 0.16 and continued to be negative till day -1 with the exception of day -8 and -7. Surprisingly, AR on day -1 becomes positive 0.19 and on day 0 equals 0.34. On the other side, CAR started to be positive 0.54 on the event day (day = 0). The positive increase continues noticeably and significantly till day 12 and then turned to negative and continued negative till day 30. Although the t-statistics is indicating an insignificant CAR on the announcement day, but the rest of the CAR following the event day are highly significant at 1% level leading to the rejection of the null hypothesis. One interpretation could be that once the news is disclosed, investors reacted positively and generated some abnormal returns until day 12 and gradually the abnormal returns decreased to reach zero on day 13 and negative till day 30. This also could indicate that Bahrain market is inefficient in a sense that investors on average could generate abnormal returns in a short period from such news. Figure 2 also shows the positive jump in the returns after the event day. Considering 10 days after the announcement, investors made 1.27% for (AR) abnormal returns.

Figure 2 Cumulative Abnormal Returns (Car)++ “The Full Sample”
Analyzing the second hypothesis, which is the reactions of investors toward signals by Islamic banks compared to the conventional ones, it is noted in Table 3 that on average, cumulative abnormal returns for the conventional banks fluctuated around the zero on the thirty days before the announcement. Two days before the announcement, investors had a negative of 2.43 abnormal returns and this turned to positive returns of 0.53 just before the event day and to 0.11 on the event day. As a result, the cumulative abnormal returns on the event day equaled to 1.14 and 0.21 one day after the announcement. It could show that investors did not expect this news, and with the announcement, the reaction was positive for a very short period of time, i.e. over the two days (0 and 1). The abnormal returns and the cumulative abnormal returns continued on a negative sign till the last day of the study with the exception of day 4 and 5. On the contrary, the Islamic banks had negative abnormal returns until the announcement day but most of the CARs are positive until day -6 where it turns to negative till day -1. On the event day, investors reacted positively and generated 0.54 abnormal returns and 0.01 CAR. It is very interesting to note that from day 0 till the 30th day after the announcement, CAR is continuously positive and reaches 6.14. Interestingly, t-values for these CARs are highly significant at 1% level. This result shows that investors’ reactions to Islamic banks are completely the opposite of conventional banks. Although investors generated on average 1.14 CAR on the day of the announcement from the conventional banks, they generated only 0.01 from the Islamic banks. Meanwhile, the CAR ended to -13.03 on the day 30 for the conventional banks compared to a positive 6.14 for the Islamic banks. This result rejects the second null hypothesis and concludes that there is a significant difference between the Islamic and conventional banks in providing signals to the market. Investors’ perception of news differs based on the type of the bank, being it is Islamic or conventional. Figure 3 highlights this opposite direction in CAR between the two groups. Before the event day, the difference between the two groups is not noticeable, while from day zero (event day) there is a sharp drop in the CAR for the conventional compared to a sharp rise in CAR for the Islamic Banks. Relatively, the sharp decline in conventional is more than the rise in the Islamic banks.

Figure 3 Cumulative Abnormal Returns (CAR) ++ for Islamic and Conventional Banks
Testing the third hypothesis, i.e. the difference between announcements by the acquirer and the target banks, is portrayed in Table 4. It shows that announcements by the target banks generated a significant positive 0.08 abnormal returns on the event day and 0.56 and 0.92 on the second and third day. These positive abnormal returns managed to reduce the negative CAR to - 0.41 on day 5. However, CARs are all negative over the 60 days of the study around the announcement day and it ends to -6.44 on day 30. Comparing to the acquirer banks, investors generated 0.46 abnormal returns on the event day with a highly statistically significant CAR of 2.55. Investors generated continuously positive CARs within the 30 days before the announcement day. The positive returns continued till day 20 where on average they earned cumulative returns of 1.87. Statistically, all CARs are highly significant at 1% level. Figure 4 highlights that the pattern for both groups over the 60 days is similar. But, they differ in a way that target banks move on the negative AR and CAR while the acquirer banks move on the positive side.

Figure 4 Cumulative Abnormal Returns (CAR) ++ for Acquirer and Target Banks
Therefore, whether the announcement is from the acquirer or target banks, investors react positively. If the announcement is from the acquirer banks, investors consider this as good news and generate positive abnormal returns and continue for a longer period. On the other hand, investors react positively for a few days when the announcement is from the target bank. However since investors are already having negative returns, this announcement will cause investors to suffer less. From Table 4 and Figure 4 it can be concluded that there is a significant difference between the reactions toward the target and the acquirer banks.
If we consider the 10 days window only, it shows that the reaction toward news from the target firms is different than the acquirer firm. Over the 10 days investors generated positive cumulative abnormal returns on the day of the announcement for the acquirer bank and the returns increased beyond the tenth day. While the cumulative abnormal returns are negative on the announcement day for the target banks remained negative till beyond the tenth day.
To summarize the results obtained from the analysis of the three hypotheses; the full sample, Islamic and conventional banks, and acquirer and target banks, Table 5 highlights the ± 10 days CAR around the event day.
| Table 5 Summary Results (CAR ++) for the Full Sample and The Sub-Samples | |||||
| Day | Full Sample | IslamicBanks | Conventional Banks | AcquirerBanks | Target Banks |
| -10 | -0.16 | 0.89 | -1.35 | 1.50 | -3.46 |
| -9 | -0.23 | 0.61 | -1.19 | 1.47 | -3.64 |
| -8 | 0.41 | 1.01 | -0.28 | 2.06 | -2.90 |
| -7 | 0.31 | 0.34 | 0.27 | 2.06 | -3.19 |
| -6 | -0.32 | -0.61 | 0.00 | 1.13 | -3.23 |
| -5 | -0.90 | -0.66 | -1.19 | 0.43 | -3.57 |
| -4 | -0.53 | -0.65 | -0.39 | 1.02 | -3.64 |
| -3 | -0.34 | -0.43 | -0.24 | 1.25 | -3.52 |
| -2 | -0.92 | -0.43 | -1.47 | 0.37 | -3.49 |
| -1 | -0.73 | -0.54 | -0.94 | 0.69 | -3.57 |
| 0 | 0.54 | 0.01 | 1.14 | 2.55 | -3.49 |
| 1 | 0.26 | 0.30 | 0.21 | 1.86 | -2.93 |
| 2 | 0.89 | 1.75 | -0.10 | 2.34 | -2.01 |
| 3 | 0.54 | 1.78 | -0.88 | 1.85 | -2.09 |
| 4 | 1.33 | 2.45 | 0.05 | 2.64 | -1.29 |
| 5 | 2.24 | 3.19 | 1.16 | 3.57 | -0.41 |
| 6 | 1.88 | 3.15 | 0.42 | 3.26 | -0.90 |
| 7 | 1.25 | 3.34 | -1.14 | 2.66 | -1.57 |
| 8 | 1.45 | 3.42 | -0.79 | 3.14 | -1.91 |
| 9 | 1.09 | 3.06 | -1.17 | 2.68 | -2.10 |
| 10 | 1.27 | 3.61 | -1.41 | 3.23 | -2.66 |
Discussion
The 30 announcements made by the sample banks and presented in Appendix 1 show that Banks enter into M&A for different motives which include expansion, diversification and internationalization in hope to increase bank’s financial strength and to create value for investors. Such a policy would help banks to find new customers and exploit opportunities available in various markets. Appendix 1 for example, shows that in 2014 Alsalam bank took over the entire business of Bank Muscat International (BMI). According to the CEO of Alsalam bank, the major purpose of the takeover is to enhance bank’s shareholder’s value (Trade Arabia-online, May 8, 2017). Another example is when Ahli United Bank (AUB) acquired 49% stake in the commercial bank of Iraq, AUB managed to significantly improve its operating environment. In addition to establishing operations in Iraq, the acquisition increases the range of their products and services to meet the requirements of both local and regional customers. Consequently, result in increasing the profitability of AUB.
In general, this study attempts to provide evidence about the effects of M&As announcements on the market value in the banking sector in Bahrain. A study which is pioneer in the M&As and Banking sector. It goes further by looking into the effect of such announcements as made by conventional banks versus Islamic banks; a hypothesis which as far as we know has not been tested in the finance literature. The study also investigates investors’ reaction to announcements made by acquirer banks as opposed to announcements made by target banks. Event study methodology is employed with a 30-day and 10-day event window to analyze announcements made during the period 2005-2017. The conclusion for the first hypothesis indicates that once the M&A news is disclosed, investors reacted positively and on average generated abnormal returns for a short period of up to 10 days after the announcement. This finding supports the claims made by Karla (2013), and by Kumar and Fernandez (2011-2012) that acquirer and target firms benefit from merging. The acquisition of Ithmar bank of the First Leasing Bank (Appendix 1) shows how acquisition may lead to business expansion and reaching a wider range of markets. This acquisition took place in February 2013 and has resulted in increasing the bank’s issued and paid up capital by $56.7 million to $758 million. Such increase has enhanced their capital base, capital adequacy ratios and has also improved bank’s shareholder’s profile.
Results from testing the second hypothesis (Table 3), reflect the mixed results reported by M&As research. Findings which assert that bank mergers do not create shareholder value ( e.g., Al Sharkas and Hassan, 2010; Hamza, 2009; Padmavathy and Ashok, 2012; Dakessian and Feldman, 2013; Satapathy and Kaushik, 2015; and Bergmann et al. 2015) are evidenced by the results for the conventional banks over the ± 30-day event study period. Thirty days before the M&As announcement a negative -1.83% CAR is reported, it increased to a positive +1.14% on the event date and then started to decrease until 30 days after the announcement date it became negative again at -13.3%. On the other hand, evidence for the Islamic banks falls in line with findings that M&As do create wealth and increase shareholder value (e.g., Al Sharkas and Hassan, 2010; Kumar and Fernandez, 2011-2012; Rathinan and Sridharan, 2016; and Geyfman, 2018). Table 3 shows that 30 days before the M&As announcement CAR is positive at +0.29%, witnessed a decline to +0.01% on the event day then started to increase until it reached +6.14% on day+30. Since this hypothesis is considered as a gap in the literature, some justifications for the result is worthwhile to be given. These results could be due to the popularity of Islamic banks to Muslims for the many reasons. First, Islamic banks operate according to the Principles of Islamic Law (Sharia) which prohibits receipt or payment of interest (usury or Riba) instead offers depositors/investors a share in the profit or loss. Second, Islamic banks are more risk-sensitive than conventional banks. Investors believe that their wealth will be safer since products of Islamic banks are asset-backed which may enhance stability during market distress and financial crisis. Third, Islamic banks give greater ethical attention to social welfare via Zakah which is a levy imposed to wealthier individuals and more prsoperous businesses and distributedd to the less fortunate thus helps to close the gap between the poor and the rich. These points give Muslims and non-Muslims a great confidence in the Islamic banks, an important factor that led to the world-wide growth of the Islamic banks especially in the Gulf region. All these reasons are sufficient to result in a positive response of the fund suppliers to the announcements made by Islamic banks.
The thrid hypothesis reported a negative reaction to news from a target bank and a positive reaction if the M&A announcement source is the acquirer bank. Being an acquirer, indicates some degrees of strength in management decision. So when the acquirer bank announces good news about M&A, investors believe that this announcment will lead to a success and wealth creation. It is equally true when they announce a bad news. This supports the findings of Padmavathy and Ashok (2012), Al Sharkas and Hassan (2010) and Tauseef and Nishat (2014). However, when the target firm announces the news of M&A, investors consider this as a bad news and might be interepreted as incompetent management, poor expected future performance, decline in share price and so on. This is also claimed by Agrawal and Jaffe (2003) that financial economists believe that takeovers are motivated by the desire to improve poorly performing firms. Refereing back to Table 5, the comparative results for these three hypotheses is summerozed over the 10 days before and after the announcement. Hence, whether the reaction is positive or negative to the announcement, it can be concluded that the Bahrain market is inefficient in the semi-strong form and investors can generate abnormal returns by M&A announcements.
Conclusion
As many empirical studies, this paper has its own limitations. First, the small sample size of six banks listed on Bahrain Bourse with 30 announcements lead to implications and conclusions limited to Bahrain only. Second, the study ignores explanatory variables like relative size, method of payment and the number of bidders that might affect market reactions to M&As announcements. Third, embracing the opportunity of applying financial technology (Fintech) solutions is increasing in the banking industry. Through technology banks can serve their customers faster and more efficiently and would result in increasing bank’s revenues, generating new businesses, enriching their data and offering products and services specifically tailored to individual customers’ needs. Unfortunately, this motive is missing in the current study. Fourth, results reported by the study are biased. The period investigated 2005 to 2017 witnessed the Global Financial Crisis (2008-2009) in addition to political and social unrest in Bahrain in 2011. As a result, Bahrain’s growth slowed down during 2009-2011 and the decline was most evident in two sectors, namely construction and finance. Fifth, the sample is not divided according to the type of M&A, the 30 announcements are a mixture of different announcements.
Further research could be conducted to overcome the above limitations. The study could be extended to investigate M&As announcements made by banks operating in GCC (Gulf Cooperation Council) which is made of six countries, namely; Kingdom of Bahrain (Bahrain), Kingdom of Saudi Arabia, United Arab Emirates, Kuwait, Qatar and Oman. A comparative study of these six countries would help in deriving a model for the GCC countries. Furthermore, a comparative study among different sectors listed in the Bahrain Bourse should give interesting results. In addition, examining the inefficient management hypothesis as conducted by Agrawal and Jaffe (2003) would provide answers to unsolved questions. A thorough case study of the three Islamic banks with the three conventional banks could give robust results. Finally, interesting outcomes could be found if research is carried out to explore target and acquirer Islamic banks or target and acquirer conventional banks.
End Note
1.Central bank of Bahrain: http://www.cbb.gov.bh/page-p-banking.htm
References
- Al-Sharkas, A.A., & Hassan, M.K. (2010) New evidence on shareholder wealth effects in bank mergers during 1980-2000. Journal of Economics and Finance, 34, 326-348.
- Agrawal, A., & Jaffe, J. (2003) Do takeovers target underperform? Evidence from operating and stock returns. Journal of Financial and Qualitative Analysis, 38(4), 721-746.
- Asiri, B.K. (2015). Investors’ reaction to marketing and financial announcements in the telecommunications sector. Journal of Applied Finance and Banking, 5(3), 123-143.
- Berger P.G., & Ofek, E. (1995). Diversification’s effect on firm value. Journal of Finance and Economics, 37(1), 39-65.
- Bergmann, D.R., Savoia, J.R.F, Souza, de Melo, B., & de Mariz, F. (2015). Evaluation of mergers and acquisitions processes in the Brazilian banking sector by means of an event study. Review of Business Management, 17(56), 1105-1115.
- Bino, A., & Pana, E. (2010) Firm value and investment policy around stock for stock mergers. Review of Quantitative Finance and Accounting , 37(2).
- Bradley, M., Anand, D., & Kim, E.H. (1988). Synergistic gains from corporate acquisitions and their division between the stockholders of acquiring firms. Journal of Financial Economics, 21, 3-40.
- Dakessian L.C., & Feldmann, P.R. (2013). Multilatinas and value creation from cross-border acquisitions: An event study approach. BAR Rio de Janeiro, 10(4), 462-489.
- Datta, D.K., Pinches, G.E., & Narayanan, V.K. (1992). Factors influencing wealth creation from mergers and acquisitions. Strategic Management Journal, 13, 67-84.
- Do?an, I., & Yildirim, H.S. (2017). Value creation in U.S. banks mergers before and after the global financial crisis. Quarterly Journal of Finance and Accounting , 55(3/4), 99-132.
- Doukas, J., & Kan, O. (2004). Excess cash flows and diversification discount. Financial Management, 33, 71-88.
- Duso, T., Klaus, G., & Yurtoglu, B. (2010). Is the event study methodology useful for merger analysis? A Comparison of Stock Market and Accounting Data. International Review of Law and Economics, 30, 186–192.
- Fama, E.F. (1970) Efficient capital markets: A review of theory and empirical work. Journal of Finance, 25, 383-417.
- Geyfman, V., & Walker, J.S. (2018). New evidence on the impact of mergers among community banks. North American Journal of Finance and Banking Research, 7(7), 1-23.
- Graham J., Lemmon M., & Wolf, J. (2002). Does corporate diversification destroy value? Journal of Finance , 2, 695-720.
- Hamza, T. (2009) Determinants of short-term value creation for the bidder: Evidence from France. Journal of Management and Governance, 15, 157-186.
- Harrison, J.S., Hitt, M.A., Hoskisson, R.E., & Ireland, R.D. (1991). Synergies and post-acquisition performance: Differences versus similarities in resource allocations. Journal of Management, 17, 173-90.
- Hitt, M.A., Harrison, J., Ireland, R.D., & Best, A. (1998). Attributes of successful and unsuccessful acquisitions of US Firms. British Journal of Management. 9, 91-114.
- Indhumathi, G., Selvan, M., & Babu, M. (2011). The effect of mergers on corporate performance of acquirer and target firms in India. Euro Journal Publishing, (1), 14-40.
- Isabel Feito-Ruiz, I., & Menendez-Requejo, S. (2010). Family firms mergers and acquisitions in different legal environments. Family Business Review, 23(1), 60-75.
- Karla R. (2013). Mergers and acquisitions: An empirical study on the post-merger performance of selected corporate firms in india. The IUP Journal of Business Strategies, 10(4), 7-67.
- Kukalis, S. (2012). Market-based versus accounting-based performance: A new investigation in post-merger situations. The International Journal of Finance, 24(3).
- Kumar, B.R., & Fernandez, M. (2011-2012). Emirates Bank International (EBI) Merger with National Bank of Dubai (NBD): A Valuation Perspective. International Journal of Business Insights and Transformation, 5 (1), 4-12.
- Kumar, B.R., Gera, S., & Saha, S. (2016). Wealth creation in the largest banking mergers: An empirical analysis. Asian Economic and Financial Review, 6(4), 206-217.
- Larsson, R., & Finkelstein, S. (1999). Integrating strategic, organizational and human resource perspective on mergers and acquisitions: A case survey of synergy realization. Organization Science, 10, 1-25.
- Mackenzie, I. (2017). Mergers and acquisitions in the European union. Acquisition Activity & Economic Performance. ACTA VŠFS, 2/2017, 11, 106-119.
- Padmavathy, S., & Ashok, J. (2012). Mergers announcements and stock price behavior: Empirical evidence from india stock market. International Research Journal of Finance and Economics, (83), 154-160.
- Pramod, M., & Vidyadhar, R.A. (2008). Post-merger performance of acquiring firms from different industries in india. International Research Journal of Finance and Economics. 22, 192-204.
- Ramaswamy, K. (1997). The performance impact of strategic similarity in horizontal mergers: Evidence from U.S. banking industry. Academy of Management Journal, 40, 697-716.
- Rani, N., Yadav, S.S., & Jain, P.K. (2012). The impact of domestic merges and acquisitions on acquirer shareholders’ wealth in India. Global Journal of Flexible Systems Management, 13(4), 179-193.
- Rathinam, I.B., & Sridharan, P.S. (2016). Post-mergers and acquisitions performance of select Indian banks. The IUP Journal of Bank Management , 15(1), 17-27.
- Satapathy, D.P., & Kaushik, K.P. (2015). Mergers and valuation creation. The IUP Journal of Applied Finance , 21(3), 57-67.
- Shelton, L. (1988). Strategic business fits and corporate acquisitions: Empirical evidence. Strategic Management Journal, 9(3), 279-287.
- Shobana, V.K., & Deepa, N. (2012). Impact of mergers and acquisitions on shareholder wealth of the select acquirer banks in India: An event study approach. The IUP Journal of Bank Management, 11(2), 26-31.
- Shukla, A., & Gekara, M.G. (2010). Effects of multinational mergers and acquisitions on shareholders’ wealth and corporate performance. The IUP Journal of Accounting Research and Audit Practices, 9(1, 2), 44-61.
- Singh, H., & Montgomery, C. (1987). Corporate acquisitions strategic and economics performance. Strategic Management Journal, 8, 377-386.
- Sinha, N., Kaushik K.P., & Chandhary, T. (2010). Measuring post-merger and acquisition performance: An investigation of select financial sector organizations in India. International Journal of Economics and Finance, 2(4), 190-200.
- Swaminathan, V., Murshed, F., & Hullan, J. (2008) Value creation following mergers and acquisition announcements: The role of strategic alignment. Journal of Marketing Research, 45, 33-47.
- Tauseef, S., & Nishat, M. (2014). Wealth effect of mergers and acquisitions in emerging markets: A case of pakistan’s banking sector. Business Review, 9, 24-39.
- Thraya, M.F., Lichy, J., Louizi, & Rzem, M. (2019). High-Tech acquirers and the moderating role of corporate governance. Journal of High Technology Management Research, 30, 1-12.
- XU, X., Liang, Y.J., & Song, S.l. (2018). What drives mergers & acquisitions waves of listed companies of the chinext market? IPO over-finance or stock overvaluation. Technological and Economic Development of Economy, 24(4), 1499-1532.