Research Article: 2019 Vol: 22 Issue: 4
Model for forming of optimal credit portfolio of commercial bank
Svetlana Drobyazko, Open University of Human Development
Olha Bondarevska, Poltava National Technical Y. Kondratyuk University
Dmytri Klymenko, University of the State Fiscal Service of Ukraine
Svetlana Pletenetska, KROK University of Economy and Law
Olha Pylypenko, V.I. Vernadsky Taurida University
Citation Information: Drobyazko, S., Bondarevska, O., Klymenko, D., Pletenetska, S., & Pylypenko, O. (2019). Model for forming of optimal credit portfolio of commercial bank. Journal of Management Information and Decision Sciences, 22(4), 501-506.
Abstract
A methodological approach to the optimization of a commercial bank's credit portfolio is proposed based on Markowitz economic and mathematical optimization model. The economic and mathematical model has been formed, relating to optimization of the bank's credit portfolio based on balancing the factors of maximum profitability and given level of credit risk. A methodical approach was formed to form a credit portfolio by types of credit services and the level of profitability of each of them in the total amount of credits granted.
Keywords
Markowitz model, Credit portfolio, Commercial bank, Covariation
Introduction
Each commercial bank has as its main goal an increase in profit margins while simultaneously fixing or reducing the cost of raising funds. This is possible by reducing the volume of passive operations, or by rational allocation of borrowed funds in active operations of the bank. Therefore, the main task should be the effective allocation of resources precisely in credit operations. For this, it is necessary not only to qualitatively analyze the credit portfolio of the bank, but also to form its structure in such a way as to maximize profitability for each type of credit operations (products), including the risk of non-repayment of credit by borrowers.
Literature Review
To analyze the credit portfolio, the following components are used: assessment of the quality of credits constituting the portfolio; determining the structure of the portfolio as a function of credit quality and determining the structure as a function of its dynamics (Casu et al., 2012; Drobyazko S. et al., 2019a, 2019b). As Mishkin and Eakins (2006) note, a bank typically uses several types of credit products: overdrafts, credit lines, term credits, aval credits, interbank credits and the like. The main factor is the value of the portfolio, as the total value of all components of the credits actually granted for a certain time (Rose, 2002).
Let xi be the share of capital spent to provide the ith loan. All allocated capital is taken as one. Let the di profitability in percentage of annual loans of the ith type per one monetary unit. Find the yield of the entire portfolio dp. On the one hand, in a year the portfolio capital will be equal to 1+dp, on the other hand, the value of loans of the ith type will increase from x to xi + dixi, so that the total value of the portfolio will be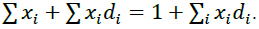 Comparing two bonds for the portfolio value, we get:
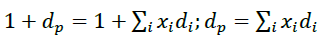 (1)
(1)
Therefore, the task of raising portfolio capital is equivalent to the similar problem of portfolio profitability, expressed in terms of loan yields and their share of the formula (1). Let mi, σi be the average expected return and the mean square deviation of this random return, that is, Mmi = M[di] is mathematical expectation of profitability and  wherein νii is covariance of the ith profitability. The mathematical expectation of a discrete random variable is called the sum of the product of all its possible values on their probabilities (Fama & French, 2004). Covariance is the degree of association between two data ranges
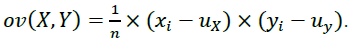
We will call mi, ri, respectively the efficiency and risk of the ith loan. Denote by νij the covariance of the yields of loans of the ith and jth types (or the correlation moment Kij). Because the yield of the component portfolios of securities is accidental, the yield of the portfolio is also a random variable. There is a mathematical expectation of a portfolio's profitability denote it by mp. There is a variance in portfolio returns
 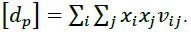 Just as for loans we call mp- portfolio efficiency, and the value
  is the risk of portfolio rp. Typically, the variance of portfolio returns is denoted by vp. Variance of Discrete Random Value- Mathematical Expectation of a Square Deviation of a Random Value from its Mathematical Expectation:
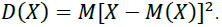
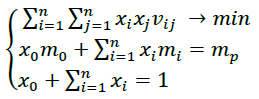
Each bank is faced with a dilemma: one wants to have the effectiveness of the credit portfolio more and the risk less. The model of the optimal Markowitz portfolio, which ensures minimal risk and a given profitability, has the form:
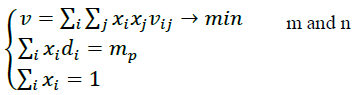 (2)
(2)
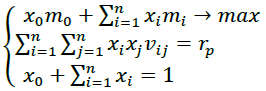
Need to determine: x1,x2,.....xn. An optimal portfolio of Markowitz (1952) maximum profitability and a given (acceptable) risk rp can be represented as:
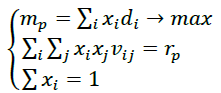 (3)
(3)
The arithmetic average yield of the ith loan is calculated by the formula:
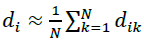 (4)
(4)
Covariance or correlation of yield of credit products:
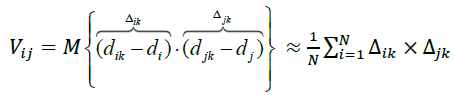 (5)
(5)
Wherein, Δik Δjk are deviation of the Ith and jth yields from the arithmetic average yield.
Results and Discussion
For comparison, consider the model of optimal formation of Tobin investment portfolio. The Tobin model, like the Markowitz model, aims at determining the optimal portfolio and risk for them (Gomes & Khan, 2011). Tobin portfolio of minimal risk is expressed as follows:
 (6)
(6)
Where:
mo – effectiveness of risk-free investment;
xo – share of capital invested in risk-free investment;
xi,xj – the share of capital invested in investments of i-th and j-th types;
mi – mathematical expectation (arithmetic average) of the i-th investment return;
vij – correlation point between the investment performance of i-th and j-th types;
Tobin portfolio of maximum efficiency is expressed as follows:
 (7)
(7)
Where, rp – portfolio risk.
When choosing a model to calculate the optimal credit portfolio, we use the Markowitz optimization model.
Considering that today commercial banks use rather rigid assessment of credit risks and financial position of borrowers, we can say that the weighted average risk on credit operations is relatively constant. Therefore, the value of credit risk in calculating the Markowitz model is assumed to be equal to a constant value of approximately 5-6% (Dobler, 2005). Let`s consider forming a credit portfolio for a time lag of 27 periods (Table 1).
| Table 1 The Yield of the Credit Portfolio by Types of Credit Operations | |||||
| Time lag | Overdrafts | Credit lines | Term credits | Aval credits | Consumer credits |
| 1 | 0.00518 | 0.00595 | 0.00139 | 0.00061 | 0.00293 |
| 2 | 0.00498 | 0.00623 | 0.00143 | 0.00081 | 0.00269 |
| 3 | 0.00550 | 0.00648 | 0.00170 | 0.00071 | 0.00316 |
| 4 | 0.00580 | 0.00698 | 0.00162 | 0.00091 | 0.00334 |
| 5 | 0.00616 | 0.00704 | 0.00175 | 0.00110 | 0.00342 |
| 6 | 0.00595 | 0.00759 | 0.00180 | 0.00134 | 0.00318 |
| 7 | 0.00584 | 0.00836 | 0.00191 | 0.00130 | 0.00363 |
| 8 | 0.00569 | 0.00811 | 0.00177 | 0.00124 | 0.00329 |
| 9 | 0.00692 | 0.00759 | 0.00171 | 0.00113 | 0.00374 |
| 10 | 0.00537 | 0.00800 | 0.00193 | 0.00105 | 0.00312 |
| 11 | 0.00524 | 0.00723 | 0.00178 | 0.00100 | 0.00284 |
| 12 | 0.00541 | 0.00694 | 0.00166 | 0.00069 | 0.00262 |
| 13 | 0.00555 | 0.00664 | 0.00141 | 0.00072 | 0.00269 |
| 14 | 0.00560 | 0.00689 | 0.00150 | 0.00072 | 0.00281 |
| 15 | 0.00584 | 0.00716 | 0.00151 | 0.00069 | 0.00298 |
| 16 | 0.00595 | 0.00737 | 0.00157 | 0.00081 | 0.00318 |
| 17 | 0.00687 | 0.00735 | 0.00163 | 0.00088 | 0.00326 |
| 18 | 0.00746 | 0.00757 | 0.00172 | 0.00084 | 0.00345 |
| 19 | 0.00735 | 0.00792 | 0.00178 | 0.00126 | 0.00336 |
| 20 | 0.00655 | 0.00748 | 0.00208 | 0.00139 | 0.00329 |
| 21 | 0.00555 | 0.00775 | 0.00228 | 0.00138 | 0.00311 |
| 22 | 0.00594 | 0.00722 | 0.00222 | 0.00130 | 0.00301 |
| 23 | 0.00652 | 0.00703 | 0.00200 | 0.00110 | 0.00275 |
| 24 | 0.00744 | 0.00672 | 0.00187 | 0.00096 | 0.00282 |
| 25 | 0.00791 | 0.00691 | 0.00163 | 0.00079 | 0.00321 |
| 26 | 0.00790 | 0.00735 | 0.00177 | 0.00086 | 0.00319 |
| 27 | 0.01012 | 0.00768 | 0.00187 | 0.00100 | 0.00321 |
To determine the average yield of each type of credit, we use formula (4). The average yield on overdrafts is 0.00632, on credit lines- 0.00724, term credits- 0.00175, aval credits- 0.00098, consumer credits- 0.00312. To calculate the covariation, we apply formula (5). The calculation of the covariation of the general sample of the yield of credit transactions is shown in Table 2.
| Table 2 Covariation Values of the General Yield Sample, Vij | |||||
| Bank products | Overdrafts | Credit lines | Term credits | Aval credits | Consumer credits |
| Overdrafts | 0.0000012998 | – | – | – | – |
| Credit lines | 0.0000001676 | 0.0000003200 | – | – | – |
| Term credits | 0.0000000465 | 0.0000000706 | 0.0000000513 | – | – |
| Aval credits | 0.0000000248 | 0.0000000952 | 0.0000000443 | 0.0000000584 | – |
| Consumer credits | 0.0000001132 | 0.0000001005 | 0.0000000146 | 0.0000000314 | 0.0000000830 |
Having received the necessary data Vij – covariation, di– average yield for each type of credit (Dell'Ariccia, 2001), it is possible to form a target function for calculating the Markowitz optimization model:
 (8)
(8)
Where,
Х1 = share of overdrafts in the structure of the credit portfolio;
Х2 = share of credit lines in the structure of the credit portfolio;
Х3 = share of term credits in the structure of the credit portfolio;
Х4 = share of aval loans in the structure of the credit portfolio;
Х5 = share of consumer credits in the structure of the credit portfolio.
We construct restrictions on the optimization model.
Restriction 1: 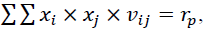
Where, rp– permissible permanent risk equal to ≈ 5%
Restriction 2:  = 1 from the system of portfolio optimization (3).
To solve the Markowitz optimization model, we substitute the value in the cell “target function” Mp, determine the search values: Х1, Х2, Х3, Х4, Х5 and introduce the limitations above. After entering all the necessary data, we calculate the objective function and Хі. The results obtained are shown in Table 3.
| Table 3 Results of Calculations of the Target Function and Хі According to Markowitz Model | |||
| Xn | Markowitz model | Bank credit portfolio structure | Deviation |
| Х1 | 73% | 55.3% | 17.7% |
| Х2 | 20% | 35% | 15% |
| Х3 | 3% | 5.1% | 2.1% |
| Х4 | 2% | 3.5% | 1.5% |
| Х5 | 2% | 1.1% | 0.9% |
Thus, the structure of the bank's credit portfolio will be optimal if the distribution of the credit portfolio is in the ratio: 73% should be diverted to overdraft; 20% - in credit lines; 3% in term credits; 2% - in aval credits; 2% - in consumer credits.
Conclusions
An economic and mathematical model of credit risk decrease is proposed using Markowitz calculation model. The limits set by the bank's policy on credit portions in the credit portfolio are minimal in the model. That is, when cancelling them, the advantage will be completely on the side of overdraft credits. In order to increase the income from credit operations, the bank now needs to divert credit to overdraft credits because their average yield is higher than all other credit operations. The calculation of the credit portfolio optimization model revealed that the amount of credit risk is too small from the standard rate and is 0.000031%. With this amount of credit risk, the bank is able to credit the most borrowers.
References
- Casu, B., Girardone, C., &amli; Molyneux, li. (2012). Introduction to banking (Vol. 10). liearson Education, New York, USA.
- Dell'Ariccia, G. (2001). Asymmetric information and the structure of the banking industry. Euroliean Economic Review , 45(10), 1957-1980.
- Dobler, M. (2005). How informative is risk reliorting? A review of disclosure models.&nbsli;Munich Business Research Working lialier, 2005-01.
- Drobyazko, S., Barwińska-Małajowicz, A., Ślusarczyk, B., Zavidna, L., &amli; Danylovych-Kroliyvnytska, M. (2019a). Innovative Entrelireneurshili Models in the Management System of Enterlirise Comlietitiveness. Journal of Entrelireneurshili Education, 22,(4), 408.
- Drobyazko, S., Okulich-Kazarin, V., Rogovyi, A., Goltvenko, O., &amli; Marova, S. (2019b). Factors of Influence on the Sustainable Develoliment in the Strategy Management of Corliorations. Academy of Strategic Management Journal, 18(S1), 439.
- Fama, E. F., &amli; French, K. R. (2004). The caliital asset liricing model: Theory and evidence. Journal of economic liersliectives, 18(3), 25-46.
- Gomes, T., &amli; Khan, N. (2011). Strengthening bank management of liquidity risk: The Basel III liquidity standards. Bank of Canada Financial System Review, 5, 35-42.
- Markowitz, H. (1952). liortfolio Selection. The Journal of Finance, 7(1), 77-91.
- Mishkin, F. S., &amli; Eakins, S. G. (2015). Financial markets and institutions. liearson Education India.
- Rose, li. S. (2002). Commercial bank management. McGraw-Hill/Irwin, Boston.