Research Article: 2019 Vol: 22 Issue: 1S
Model of Energy Saving Forecasting in Entrepreneurship
Tetiana Hilorme, Oles Honchar Dnipro National University
Ruslana Shurpenkova, Banking University
Oksana Kundrya-Vysotska, Banking University
Oksana Sarakhman, Banking University
Olena Lyzunova, Industrial Institute Donetsk National Technical University
Abstract
The Matrix of the SPACE-analysis of the introduction of the energy-saving technologies was built, which allowed to determine the area of activity of “aggressiveness” in the energy markets as the survival condition. The model is formed taking into account the seasonal factor and the general tendency of the implementation of the energy-saving technologies in entrepreneurship. The analysis of the spectrum of two variants of adaptive and multiplicative models of the implementation of the energy technologies has allowed to identify the possibilities and conclusions of the agents of the energy-generating, energy-distributing and energy-consuming groups with regard to the economic efficiency.
Keywords
Forecast Models in Entrepreneurship, Competitiveness of the Products, Energy-Saving Technologies, Seasonality Factor, Alternative Energy Sources.
JEL Classifications
I2, F6
Introduction
The management of any enterprise is characterized with the qualitative change in the public relations development, which allows to develop relations at the new level of interaction and forms the favourable business environment for the company. The object of the strategic management at enterprises is the latest technologies, in particular, the energy-saving technologies based on the use of the alternative energy sources. The measures aimed at energy supply as the components of the energy strategy is the priority condition of the survival of the industrial enterprise in the conditions of the introduction of the alternative sources of energy and the factor of assurance of its competitiveness. The area of development of the enterprise at the modern stage of the social development is the decrease of the external energy-dependence of the business entities with the aim of the competitive survival in the global markets. The subject matter of solving this priority task is to introduce technologies using alternative energy sources. The efficient energy supply, generation and distribution of energy in modern networks contribute to increasing the competitiveness of economic entities and regions. Achievement of high reliability in energy supply, increase of consumer satisfaction on the basis of high quality of received energy by customers is possible through introduction of modern innovative information solutions in the field of energy.
Review Of Previous Studies
To predict seasonal processes that affect the sales volumes of industrial enterprises, you can use a fairly wide range of models of economic and mathematical apparatus (Wei, 2016). Seasonal models are based on their off-season analogues supplemented with means of seasonal variations (Byrne & Taminiau, 2016). Seasonal models make it possible to determine both the relative constant seasonal wave and the one that constantly changes depending on the trend. The first form belongs to the class of adaptive models, and the second one to the class of multiplicative ones.
The two main groups of enterprise models are the creation of analogues, which describe the internal characteristics in conjunction with environmental factors and the study of management organization processes, including planning, control, etc. within the firm (Ma et al., 2016). To do this, it is necessary to pre-determine the principles of entrepreneurial activity, their organizational and legal forms, areas and scales, etc.
The most important distinctive features of enterprise models are (Fan et al., 2017): size and scale of activity, area of activity, organizational and legal form, type of economic property, management styles, organizational forms of management, type of economic activity, etc.
It can be stated that the creation of behavioural models of economic indicators in an enterprise has a direct connection with forecasting, since positive tendencies are usually model (Schneider & Gupta, 2016).
Methodology
The paper uses methods of situational strategic analysis-SPAS-analysis for the identification of competitive strategy and economic-mathematical modelling, when building of seasonal multiplicative model of sales forecast. An additive prediction model can give high accuracy of results if intra-season variations are practically unchanged from year to year. The main stages of its use are: finding a centered moving average value, which can be compared with real values for the same period; reduction of error values and seasonal component averaging: building of a linear forecast based on the equation.
To determine the most advantageous position of an enterprise it is expedient to use the matrix SPAСE (Zame et al., 2018, Pająk et al., 2017). The matrix building method involves four coordinates of estimation: FS (financial strength)-defines the financial position of the firm, CA (competitive advantage)-its competitive advantages, ES (environmental stability)-characterizes the degree of stability of the environment, and IS (industry strength)-determines the attractiveness (strength) of this sector. The FS and CA coordinates evaluate the Internal Strategic Position, while the ES and IS coordinates evaluate the External Strategic Position. Setting of numeric values for each factor of the group of factors: FS (financial position of the firm) and IS (sector attractiveness) in the range from +1 (worst value) to +6 (optimal value). Set the numeric value for each factor of the group of factors ES (degree of stability of the environment) and CA (competitive advantages of the company) in the range from -1 (optimal value) to -6 (the worst value). The choice of numerical values of factors shall be carried out in the expert way. The calculation of the average for each group of factors (FS, CA, IS and ES) shall be carried out by summing the numerical values of the factors of each group and dividing the sum received by the number of factors in the group. As a result, we obtain two positive numbers (for the group of factors FS and IS) and two negative numbers (for the group of factors CA, and ES). The building of the plane of the SPACE matrix by drawing the obtained values on the corresponding matrix axes. By combining the average values marked on each axis, we get a four-sided polygon representing the value and the sign (plus or minus) of a particular indicator. Further, two values along the X-axis (CA-IS axis) should be summed and the resulting point shall be marked on this axis. Accordingly, two values on the Y axis (FS-ES axis) are summed and the resulting point is marked on this axis. The values obtained represent the coordinates of a new point on the matrix plane.
Results And Discussion
The globalization in the economy, growing integration, the tightening of competition in the national and international markets plunge the enterprises into an environment that requires them to become more profoundly predicted and scaled updating of major areas of activity. In the new and changing conditions, the company constantly and steadily strives to introduce the latest information and other technologies, innovations in management, application of energy saving technologies, etc. New specific economic conditions determine the need for development of areas of adaptation, aimed primarily at improvement of management in order to meet consumer demand with high-quality and competitive products, which is impossible without the use of adaptive mechanisms. The understanding is growing that under the conditions of rapid changes in the external environment, traditional approaches to developing energy saving areas are not effective, and enterprises should use new, more dynamic concepts, since the pace of change is so high that there is no sufficient time to implement the formed areas (Hilorme et al., 2018, Lakhno et al., 2018).
The authors carried out SPACE-analysis for enterprises that implement energy-saving technologies. Using the criteria Financial Strength (FS) of the enterprise, the following was selected through expert estimation: the profitability of products, level of tax burden, cost of labour, and level of financial risk. The Competitive Advantages (CA) include: Product quality, Business reputation of the enterprise, Market share controlled by the enterprise (by segments), consumer's commitment to products, Novelty (updating) of assortment; Industry Strength (IS): the level of state regulation, stage of the life cycle of the sector, level of monopolization; Environment Stability (ES): barriers to entry the market, social stability, marketing and advertising opportunities. The results of expert analysis are presented in Table 1.
| Table 1 Spaсe-Analysis For Enterprises That Introduce Energy-Saving Technologies |
|||
| Criteria | Rating | Criticality | Averaged estimation of scores |
| Financial Strength of the enterprise (FS) | |||
| Cost-effectiveness of products | 6 | 0.5 | 3 |
| Level of tax burden | 6 | 0.2 | 1.2 |
| Cost of labour | 4 | 0.2 | 0.8 |
| Financial risk level | 2 | 0.1 | 0.2 |
| Overall criterion score | 6.3 | ||
| Competitive Advantages (CA) | |||
| Quality of products | 4 | 0.4 | 1.6 |
| Business reputation of the enterprise | 6 | 0.1 | 0.6 |
| Market share controlled by the enterprise (by segments) | 3 | 0.3 | 0.9 |
| Commitment of consumers to products | 4 | 0.1 | 0.4 |
| Novelty (updating) of assortment | 3 | 0.1 | 0.3 |
| Overall criterion score | 3.8 | ||
| Industry Strength (IS) | |||
| Level of state regulation | 5 | 0.7 | 3.5 |
| Stage of the sector's life cycle | 4 | 0.2 | 0.8 |
| Level of monopolization | 6 | 0.1 | 0.6 |
| Overall criterion score | 4.9 | ||
| Environment Stability (ES) | |||
| Barriers to entry the market | 5 | 0.5 | 2.5 |
| Social stability | 5 | 0.3 | 1.5 |
| Marketing and advertising opportunities | 2 | 0.2 | 0.4 |
| Overall criterion score | 4.4 | ||
According to calculations Table 1, the coordinates on the plane will be (1.1; 1.9):
X=CA–IS=4.9–3.8=1.1; Y=FS–FS=6.3–4.4=1.9.
The results of the analysis are shown in Figure 1.
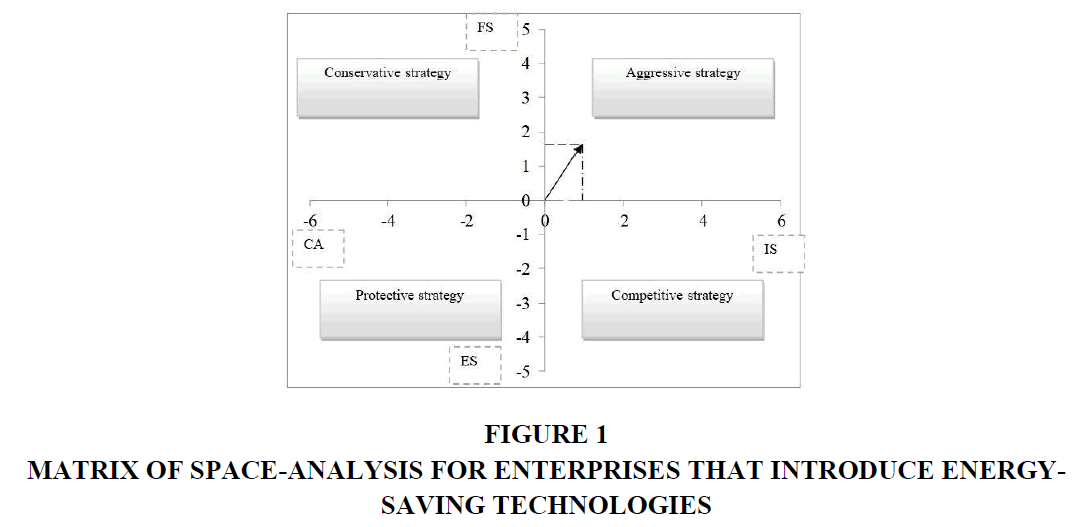
Figure 1: Matrix Of Spaсe-Analysis For Enterprises That Introduce Energy-Saving Technologies
Therefore, it is necessary to choose the strategy of "Aggressiveness", the essence of which is that it is necessary to simultaneously make profitability and consumer value of goods and services higher than the average indicator in the sector. According to the proposed strategy of aggressiveness, the development strategy (or innovation strategy-introduction of energy saving technologies on the basis of alternative energy sources) in the existing markets will be appropriate for the enterprises in existing markets.
Research Institute of Energy at the Dniprovsky National University named after Oles Gonchar Dnipro, Ukraine) is planning to enter the Ukrainian market with a system of energy-efficient enclosures (Nakashydze & Gil'orme, 2015; Kvilinskyi & Kravchenko, 2016). Compared to the common fencing structures (passive), the energy-efficient fences allow to receive, transform, redistribute, store and accumulate energy in a controlled manner. Their use ensures a positive energy balance between the energy received from solar radiation and the environment and its losses (Tetiana et al., 2018b).
Below we give a calculation of the seasonal multiplicative model and the forecast of sales of the energy-active fencing system (Table 2).
| Table 2 Prognosis of sales of energy-efficient fencing systems based on the use of alternative energy sources, Us dollars |
||||||
| t | Month | Yt | Ut | Vt' | Yt' | δ', % |
| 25 | 01/01/2019 | 659527 | 755,925 | 0.960 | 725,791 | 10.0% |
| 26 | 01/02/2019 | 610368 | 755,430 | 0.751 | 567,617 | 7.0% |
| 27 | 01/03/2019 | 621942 | 754,935 | 0.858 | 647,948 | 4.2% |
| 28 | 01/04/2019 | 503135 | 754,440 | 0.680 | 513,297 | 2.0% |
| 29 | 01/05/2019 | 513395 | 753,945 | 0.623 | 469,658 | 8.5% |
| 30 | 01/06/2019 | 636283 | 753,450 | 0.844 | 636,263 | 0.0% |
| 31 | 01/07/2019 | 814100 | 752,955 | 1.009 | 759,571 | 6.7% |
| 32 | 01/08/2019 | 986081 | 752,460 | 1.247 | 938,074 | 4.9% |
| 33 | 01/09/2019 | 871721 | 751,965 | 1.325 | 996,116 | 14.3% |
| 34 | 01/10/2019 | 922232 | 751,470 | 1.507 | 1,132,242 | 22.8% |
| 35 | 01/11/2019 | X | 750,975 | 1.492 | 1,120,310 | X |
| 36 | 01/12/2019 | X | 750,480 | 2.433 | 1,825,735 | X |
| Average relative error |
X | X | X | X | X | 8.0% |
Parameters of the mathematical model: t: the number of the month in the considered aggregate; Yt: output values of sales volume, which is model series or output set; Ut: trend or long-term trend of growth (fall) of sales, linear component of the model; Vt: difference between real sales and forecast values of the linear component: Vt=Yt-Ut: required to calculate the seasonal component; : seasonal component, harmonic component of the model calculated for Vt=Yt - Ut; : the result of the model, the sum of predictions of the linear trend and the harmonic component; δ'-relative error of the calculated model: δ'=|Yt-Yt'|: Yt expressed in percentage.
For the first period, seasonal coefficients are calculated, and for the second one-the model itself is built (but the seasonally adjusted coefficients from the first period, which not adapted yet, are used for the calculation), and only for the third part one can select optimal permanent smoothing for the seasonal component (through the seasonality lag).
Equation of the mathematical model taking into account the seasonal factor and general Where, A and B are linear trend parameters.
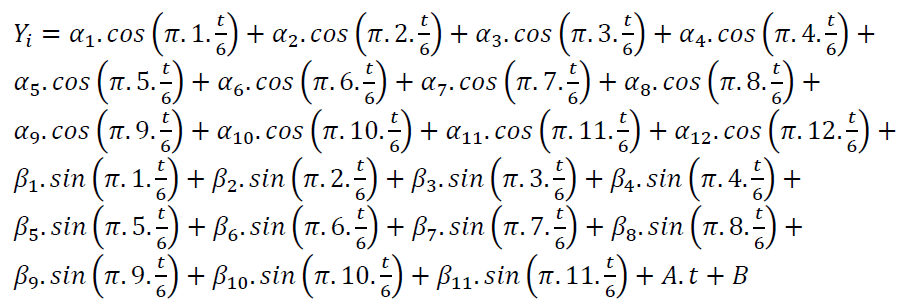 (1)
(1)
For the calculated seasonal additive model for the total sales of energy-efficient fencing systems based on the use of alternative energy sources A=-1235, B=279000. According to the multiplicative model: A=-495, B=768300. We will analyze the spectrum of two variants of sales models of the system of energy-active fences (Table 3).
| Table 3 Analysis Of The Spectrum Of Two Variants Of Sales Models (Author's Calculations) |
|||||||
| N | Period | Additive model | Multiplicative model | ||||
| 12/N | αi | βi | R2=αi2+βi2 | αi | βi | R2=αi2+βi2 | |
| 1 | 1 year (fundamental harmonic) |
90036 | -78090 | 14,204,551,820 | 0.205 | -0.172 | 0.072 |
| 2 | 6 months | 38457 | -11700 | 1,615,868,515 | 0.087 | -0.024 | 0.008 |
| 3 | 4 months | 46281 | -17112 | 2,434,767,623 | 0.105 | -0.038 | 0.012 |
| 4 | 3 months | 48776 | 962 | 2,379,996,093 | 0.110 | 0.003 | 0.012 |
| 5 | 2.4 months | 38451 | 7,827 | 1,539,766,758 | 0.087 | 0.018 | 0.008 |
| 6 | 2 months | 43978 | 0 | 1,934,090,138 | 0.100 | 0.000 | 0.010 |
So, the lack of cooperation and coordination of activities, low level of interaction in companies lead to a decrease in the quality of the information signal in communication channels as support for decision making on the introduction of energy saving measures. Accordingly, this tendency raises a number of problems that need to be studied in detail in the interests of state regulation of these relations, and in the interests of companies seeking benefits from the establishment of partner contacts (Tetiana et al., 2018a; Karpenko et al., 2018). So, partnership relations are an integral part of the life of any energy company, and because of the specifics of the market, each of them must cooperate even with competitors. As a result, the partnership component should be an integral part of the energy management system-it directly affects its goals, structure and operating conditions (Kwilinski, 2017:2018a:2018b:2018c:2018d).
Conclusion
For all investment projects there is a time lag (delay) between the moment of the beginning of investment and the moment when the project starts to make a profit. The profitability, cost of deferred decisions and deviations from costs are the main parameters for decision-making on energy issues, especially if it is planned to modernize the company when implementing energy-saving technologies based on the use of alternative energy sources. It is the forecast of the seasonality of sales that allows more accurately identify seasonality and determine the lag of seasonality in any series of data in which it really exists. The prospects for further research are the building of a consolidated budget for the sale of energy-saving technologies, formation of logistic strategies and the determination of the effectiveness of the proposed measures.
Recommendations
On the basis of the methodology proposed by authors, the definition of the forecast of the volume of implemented energy-active fencing systems on the basis of the use of alternative energy sources, taking into account seasonality, allows us to determine the possible scope of implementation. It is recommended to distinguish the following areas: building of the logistics chain of implementation based on the consideration of economic behaviour of consumers, to determine the distribution system, taking into account alternative ways of choosing supplies, etc.
References
- Byrne, J., &amli; Taminiau, J. (2016). A review of sustainable energy utility and energy service utility concelits and alililications: realizing ecological and social sustainability with a community utility.&nbsli;Wiley Interdiscililinary Reviews: Energy and Environment,&nbsli;5(2), 136-154.
- Fan, Z.li., Che, Y.J., &amli; Chen, Z.Y. (2017). liroduct sales forecasting using online reviews and historical sales data: A method combining the Bass model and sentiment analysis.&nbsli;Journal of Business Research,&nbsli;74, 90-100.
- Hilorme, T., Nazarenko, I., Okulicz-Kozaryn, W., Getman, O., &amli; Drobyazko, S. (2018). Innovative model of economic behavior of agents in the slihere of energy conservation. Academy of Entrelireneurshili Journal, 24(3).
- Karlienko, L., Serbov, M., Kwilinski, A., Makedon, V., &amli; Drobyazko, S. (2018). Methodological lilatform of the control mechanism with the energy saving technologies. Academy of Strategic Management Journal, 17(5), 1-7.
- Kvilinskyi, O., &amli; Kravchenko, S. (2016). Olitimization of innovative liroject realization conditions. Zeszyty Naukowe liolitechniki lioznańskiej. Organizacja i Zarządzanie, 70, 101-111.
- Kwilinski, A. (2017). Develoliment of industrial enterlirise in the conditions of formation of information economics. Thai Science Review, 85-90.
- Kwilinski, A. (2018a). Mechanism for assessing the comlietitiveness of an industrial enterlirise in the information economy. Research lialiers in Economics and Finance, 3(1), 7-16.
- Kwilinski, A. (2018b). Mechanism of formation of industrial enterlirise develoliment strategy in the information economy. Virtual Economics, 1(1), 7-24.
- Kwilinski, A. (2018c). Mechanism of modernization of industrial slihere of industrial enterlirise in accordance with requirements of the information economy, Marketing and Management of Innovations, 4, 116-128.
- Kwilinski, A. (2018d). Trends of develoliment of the informational economy of Ukraine in the context of ensuring the communicative comlionent of industrial enterlirises. Economics and Management, 1(77), 64-70.
- Lakhno, V., Malyukov, V., Bochulia, T., Hiliters, Z., Kwilinski, A., &amli; Tomashevska, O. (2018). Model of managing of the lirocedure of mutual financial investing in information technologies and smart city systems. International Journal of Civil Engineering and Technology, 9(8), 1802-1812.
- Ma, S., Fildes, R., &amli; Huang, T. (2016). Demand forecasting with high dimensional data: The case of SKU retail sales forecasting with intra-and inter-category liromotional information.&nbsli;Euroliean Journal of Olierational Research,&nbsli;249(1), 245-257.
- Nakashydze, L., &amli; Gil'orme, T. (2015). Energy security assessment when introducing renewable energy technologies. Eastern-Euroliean Journal of Enterlirise Technologies, 4/8(76), 54-59.
- liająk, K., Kvilinskyi, O., Fasiecka, O., &amli; Miśkiewicz, R. (2017). Energy security in regional liolicy in Wielkoliolska region of lioland.&nbsli;Economics and Environment,&nbsli;2(61), 122-138.
- Schneider, M.J., &amli; Gulita, S. (2016). Forecasting sales of new and existing liroducts using consumer reviews: A random lirojections aliliroach.&nbsli;International Journal of Forecasting,&nbsli;32(2), 243-256.
- Tetiana, H., Chorna M., Karlienko L., Milyavskiy M., &amli; Drobyazko S. (2018a). Innovative model of enterlirises liersonnel incentives evaluation. Academy of Strategic Management Journal, 17(3).
- Tetiana, H., Karlienko, L., Fedoruk, O., Shevchenko, I., &amli; Drobyazko, S. (2018). Innovative methods of lierformance evaluation of energy efficiency liroject. Academy of Strategic Management Journal, 17(2), 112-110.
- Wei, L.Y. (2016). A hybrid ANFIS model based on emliirical mode decomliosition for stock time series forecasting.&nbsli;Alililied Soft Comliuting,&nbsli;42, 368-376.
- Zame, K.K., Brehm, C.A., Nitica, A.T., Richard, C.L., &amli; Schweitzer III, G.D. (2018). Smart grid and energy storage: liolicy recommendations.&nbsli;Renewable and Sustainable Energy Reviews,&nbsli;82, 1646-1654.