Research Article: 2018 Vol: 22 Issue: 4
Modelling the Determinants of Foreign Portfolio Investments: A Bounds Testing and Causality Analysis for Jordan
Mohamed Ibrahim Mugableh, Irbid National University, Jordan
Mohammad Salem Oudat, Applied Science University, Bahrain
Abstract
This paper models the variables that affect foreign portfolio investments in Jordan for the period of 1978-2016. To fulfil to goals of the paper, autoregressive distributed lag approach and vector error correction model have been employed. Results show the existence of co-integration between foreign portfolio investments and their determinants (i.e., domestic market capitalization, foreign direct investments, money supply, and government expenditures). Granger causality based on vector error correction model shows bidirectional causality among variables in long-run and short-run. However, the results of this paper provide different recommendations to policy makers in Jordan’s government.
Keywords
ARDL Approach, Foreign Portfolio Investments, Jordan, VECM.
GEL Classifications
C1, E6, F4
Introduction
In the late 1990’s, a number of developing economies initiate reforms to liberalize their capital markets. These reforms, however, enable foreign investors to access local markets and domestic investors to diversify their portfolio internationally. Foreign portfolio investments reflect deep changes in the functioning of emerging market and economy. Bekaert and Harvey (1996); Harvey (1998); King and Levine (1993); Levine and Zervos (1996); and Rajan and Zingales (1997) argued that the attraction of foreign portfolio investments depends on the performance of stock market. The increasing of share prices in stock market attracts overseas investors, and eventually boosts their confidence in order to further invest in stock market.
On the other hand, most of the studies emphasized on the positive aspects of foreign capital on economic growth (Adeniyi and Omisakin, 2012; Azam and Ahmed, 2015; Aizenman et al., 2013; Boboye and Ojo, 2012; Jawaid and Saleem, 2017). Foreign capital improves the process of economic growth by filling the gap between savings and investment. Chaudhry et al. (2014) argued that foreign capital flows are divided into two types: foreign aid and foreign private investment. Foreign private investment is the most important source of foreign capital. Foreign private investment is further divided into foreign portfolio investment and foreign direct investment. Portfolio investment is a cluster of financial investment instruments. These financial instruments include stocks, bonds, debt securities, dividends and mutual funds of different businesses from abroad and domestic.
Foreign portfolio investments lead to structure the capital of firms by improving managerial incentives and firm’s value. The flows of foreign portfolio investments stabilize exchange rate and balance of payments. The flows of foreign portfolio investments improve the economy due to the creation of employment opportunities and the development of financial sector. The main objective of the current paper is to examine factors affecting foreign portfolio investments in Jordan. The originality of this paper stems from three features. It tries to find out equilibrium relationships and causality analysis among foreign portfolio investments, domestic market capitalization, foreign direct investments, money supply, and government expenditures. The present paper is very important because of a very high market risk and geopolitical situation of Jordan. Finally, the current paper contributes in finding out policies to attract foreign portfolio investments flows into Jordan. Like Jordan, this study would be of interest to policy makers and investors in other developing economies. The rests of this paper is structured as follows: section 2 gives a snapshot of Jordan’s economy, section 3 is for data and model, section 4 is for methodology and results analysis, and section 5 concludes the paper and provides policy recommendations.
Snapshot of Jordan’s Economy
Jordan is a middle income country. Services account for almost 70% of the economy, while industry accounts for around 30%. There is also a small agricultural sector. Jordan's main exports include potash, phosphate, clothing, and pharmaceutical products. The main export destinations are United States of America (USA), India, Iraq, and Saudi Arabia (Jordan’s Economic Outlook, 2017). It has committed to becoming a regional centre of excellence in education, information technology, and health services. Jordan has concluded free trade agreements with a number of economies, including United States of America, the European Union, Canada, Singapore, Bahrain, Egypt, Morocco, Syria, Tunisia, and United Arab Emirates. Prior to the effects of the global financial crisis, Jordan was experiencing robust gross domestic product (GDP) growth of around 8% per year. The international monetary fund (IMF) forecasts GDP growth of around 3.3% in 2017 (Jordan’s Country Brief Report, 2017).
Historically, the Jordanian economy has benefited from massive investment by the governments of Gulf countries, which continued to skyrocket until 2006. However, since then Foreign Direct Investments (FDI) has declined due to the international economic crisis, followed by geopolitical instability. In 2014, FDI totalled USD 1.76 billion. They have since remained stable. However, in 2016, Jordan secured substantial loans and financial assistance from several international donors (including the IMF and World Bank) and partners. Thus, the USA decided to raise the amount of their annual aid to USD 1,275 billion. These funds aim to support Jordan in its reception of Syrian refugees (Santander Trade Portal Report, 2017).
In order to boost FDI flows into Jordan, the government has planned large-scale infrastructure projects (water, transportation, nuclear energy) for which it needs foreign and private funds. A project linking the Dead Sea to the Red Sea is expected to start in 2018 and will require FDI. Jordan is trying to become a regional logistics hub, notably for electric and transport networks. Investments are mainly concentrated in the field of real estate (residential and commercial), financial services and large tourism projects (Bekhet and Al-Smadi, 2017; Bekhet and Matar, 2013). The country's attractiveness lies mainly in the quality of its infrastructure, its solid and dynamic banking system, as well as its level of economic openness, which has allowed the establishment of free trade zones and public-private partnerships (Mugableh, 2015a). As a result, the foreign portfolio investments in Jordan registered USD 336 million in 2017 (Figure 1).
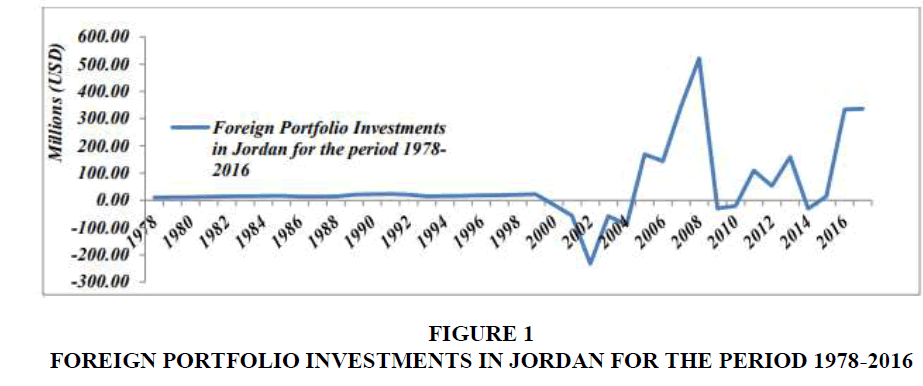
Figure 1: Foreign Portfolio Investments in Jordan for the Period 1978-2016
Source: World Bank, Development Indicators Database 2018, Available online at: https://data.worldbank.org/ country/Jordan
Data and Model
In order to examine equilibrium relationships and causality analysis between foreign portfolio investments and their determinants, annual time series data has been used for the period of 1978 to 2016 according to the availability of data. Foreign Portfolio Investments (FPI) is in million JD (constant 2010); Domestic Market Capitalization (DMC) is in % of GDP; FDI, net inflows are in % of GDP; Money Supply (MS) is in annual %; and Government Expenditures (GE) is in annual %. All the variables are retrieved from World Development Indicators Database (2017). General form of the model can be written as in Eq. (1):
FPI=ƒ (DMC, FDI, MS, GE) (1)
The log-linear formulation is more appropriate than the linear one (Eq. (1)). The loglinear specification avoids estimation problems, particularly variations, skewness, heteroscedasticity, and multicollinearity (Mugableh, 2017a; Mugableh, 2017b; Bekhet and Mugableh, 2016; Mugableh, 2015b; Mugableh, 2015c; Bekhet and Mugableh, 2013; Mugableh, 2013; Bekhet and Mugableh, 2012). Thus, the log-linear specification is shown as in Eq. (2).
LogFPIt=β0+β1LogDMCt+β2LogFDIt+β3LogMSt+β4LogGEt+εt (2)
Where, εt is the white noise term distributed with zero mean and constant variance (i.e., εt ~ N (0, σ2 )). Based on economic and financial theory, the signs of coefficients are expected to be as follows: β1, β2, β3, β4>0. Positive relationships are hypothesized between (DMC, FDI, MS, and GE) and FPI.
Methodology and Results Analysis
ARDL for Co-Integration and Equilibrium Relationships Estimates
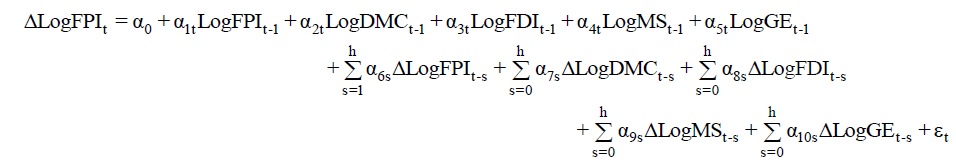
Autoregressive distributed lag (ARDL) approach by Pesaran et al. (2001) has been employed to test co-integration. This approach is applicable irrespective the variables are stationary at level i.e., I (0) or purely I (1) or mixture of both I (0) and I (1). Therefore, the ARDL approach helps to avoid traditional unit root testing1. In general, it is rare that any variable moves to second difference i.e., I (2) especially in case of small sample. Engle and Granger (1987) model is for two variables and the order of integration should be same i.e., I (1). Johansen and Juselius (1990) model is used only for large sample and the variables should be integrated of same order i.e., I (1). ARDL approach for long-run and short-run estimates is presented as in Eq. (3):
 (3)
(3)
In Eq. (3), Δ is a lag operator; α0 is constant; εt is white noise error term; α1 α2 α3 α4 α5 are for longrun estimates, while other coefficients: α6 α7 α8 α9 α10 are for short-run estimates. For ARDL approach, the first step is to test Eq. (3) by ordinary least square. The null hypothesis of no cointegration is H0:α1=α2=α3=α4=α5=0 against alternative H1:α1 ≠ α2 ≠ α3 ≠ α4 ≠ α5 ≠ 0. The Fstatistics is used to test the existence of co-integration among variables. Critical values for Fstatistics test are given by Narayan (2005). Pesaran et al. (2001) argued that if the calculated Fstatistics value is higher than the upper bound i.e., I (1), then, the H0 of no co- integration is rejected and concludes the existence of co-integration. If the calculated F-statistics value is below the lower bound i.e., I (0), then, the H0 of no co-integration is accepted and concludes that there is no long-run relationships among variables. If the calculated F-statistics value is between lower and upper bounds, then results are inconclusive. Oskooee and Brooks (2003) stated that the F-statistics value is very sensitive to the order of variables and number of lags. Vector autoregressive (VAR) model is used to find maximum lag order that was 2 through Akaike information criterion and Schwarz Bayesian criterion as they are ideal for small sample size. Table 1 shows the results of co-integration test. The calculated F-statistics value (5.39) is higher than the upper bound (4.19) at 5% significance level, showing a co-integration phenomenon between foreign portfolio investments and their determinants.
| Table 1 RESULTS OF CO-INTEGRATION TEST |
|||||||
| Function | Calculated F-statistics value | Tabulated F-statistics values | |||||
| LogFPIt=ƒ (LogDMCt, LogFDIt, LogMSt, LogGEt). | 5.39** | 1% | 5% | 10% | |||
| I (1) | I (0) | I (1) | I (0) | I (1) | I (0) | ||
| 5.76 | 4.13 | 4.19 | 2.91 | 3.52 | 2.40 | ||
Notes: (1) The tabulated F-statistics values were retrieved from Narayan (2005, Case II: restricted intercept and no trend, 1987). (2) ** denotes the significance at 5% level. (3) The computed F-statistic value was obtained from Micro−Fit software package 5.1.
Once co-integration has been confirmed, next step is to estimate long-run and short-run relationships between foreign portfolio investments and their determinants. In Table 2 the longrun and short-run results show that all variables have positive impact on foreign portfolio investments. Domestic market capitalization measures the size of Amman stock exchange. The increases of domestic market capitalization would attract the flows of financial assets. According to UNCTAD (2017), foreign direct investment is an investment made by a company or individual in one country in business interests in another country, in the form of either establishing business operations or acquiring financial assets in the other country, such as ownership or controlling interest in a foreign company. Foreign direct investments are distinguished from foreign portfolio investments in which an investor merely purchases equities of foreign-based companies. The increase of foreign direct investments flows into Jordan, would improve the development of financial sector. According to Brigham and Ehrhardt (2014), money supply is physical cash in circulation plus the money held in checking and savings accounts. It is a monetary tool and does not include other forms of wealth, such as investments or financial assets. They must be sold to convert them to cash. It also does not include credit, such as loans, mortgages and credit cards. The increase of money supply in Jordan’s economy would attract the flows of financial instruments through transition channels. Government expenditure is a fiscal tool which includes all government consumption, investment, and transfer payments (Brigham & Ehrhardt, 2014). The increases of government spending raises aggregate demand and consumption, which in turn increases production and faster financial development.
| Table 2 LONG-RUN AND SHORT-RUN ESTIMATION RESULTS |
|
| Variable | Coefficient |
| Constant term | -2.634 (0.596) |
| Long-run: | |
| LogDMCt-1 | 6.443** (0.029) |
| LogFDIt-1 | 9.112* (0.009) |
| LogMSt-1 | 8.556** (0.015) |
| LogGEt-1 | 4.556** (0.053) |
| Short-run: | |
| ?LogDMCt-1 | 0.687* (0.001) |
| ?LogFDIt-1 | 1.156** (0.011) |
| ?LogMSt-1 | 2.561** (0.025) |
| ?LogGEt-1 | 4.789*** (0.059) |
Notes: (1) P-values in parentheses. (2) *, **, *** represent 1%, 5%, and 10% levels of significance, respectively. (3) Author’s estimations using E-views software package 9.0.
Results of diagnostic tests in Table 3 confirm that Eq. (3) is free from heteroskedasticity problem, correctly specified, and residuals are normally distributed.
| Table 3 RESULTS OF DIAGNOSTIC TESTS |
|||
| Diagnostic tests | Null Hypotheses (H0) | F-statistics value | Decision |
| Normality | Residuals aren’t normally distributed | 5.52** (0.021) | Reject H0 |
| Ramsey reset | Model isn’t correctly specified | 3.51** (0.032) | Reject H0 |
| Homoscedasticity | Heteroskedasticity problem | 6.76* (0.010) | Reject H0 |
Notes: (1) P-values in parentheses. (2) * and ** represent 1% and 5% levels of significance, respectively. (3) Author’s estimations using Micro−Fit software package 5.1.
The VECM Granger Causality Analysis
In the absence of co-integration, the VAR model can be used to find causality between variables. However, once co-integration is confirmed among variables, it is better to employ the VECM. The negative and significant error correction term (ECT) shows long-run causal relationships while the F-statistics test illustrates the short-run causality. General form of the VECM Granger causality analysis can be written as in Eq. (4).
Where αit (i=1,….. 5) denote the intercept terms; λijt (i, j=1,…… 5) represent the coefficients to test the H0 of no Granger causality in short-run; 1-L is a lag operator; βit (i=1,….. 5) denote the coefficients of (ECTt-1)s. These coefficients test the H0 of no Granger bidirectional causality in long-run. The results of VECM Granger causality analysis are given in Table 4. There are bidirectional causal relationships between foreign portfolio investments and their determinants in long-run and short-run. These results are same to the results obtained by Haider et al. (2016) for China, Kuar and Dhillon (2010) for India, and Zadeh and Madani (2012) for Iran. The negative and highly significance error correction term confirms long-run relationships among variables. For the first model (i.e., foreign portfolio investments), the error correction term is highly significance at 1% level and register -0.70. In other words, disturbance in the system will take less than a year to reach its equilibrium path in long-run.
| Table 4 RESULTS OF VECM GRANGER CAUSALITY ANALYSIS |
||||||
|---|---|---|---|---|---|---|
| Dependent variables | Sources of causation | |||||
| Short-run | Long-run | |||||
| ?LogFPIt | ?LogDMCt | ?LogFDIt | ?LogMSt | ?LogGEt | ECTt-1 | |
| ?LogFPIt | - | 6.75* (0.01) | 7.65* (0.01) | 4.3** (0.02) | 2.5** (0.03) | -0.7*(.01) |
| ?LogDMCt | 8.3* (0.01) | - | 6.3* (0.01) | 4.1** (0.02) | 5.2* (0.01) | -0.6*(.01) |
| ?LogFDIt | 7.1* (0.01) | 5.3* (0.01) | - | 3.3** (0.02) | 2.3** (0.03) | -0.5*(.01) |
| ?LogMSt | 2.3** (0.03) | 4.3** (0.02) | 1.3** (0.04) | - | 1.5** (0.04) | -0.6*(.01) |
| ?LogGEt | 4.3** (0.02) | 7.3* (0.01) | 3.9** (0.02) | 4.5** (0.02) | - | -0.4*(.01) |
Notes: (1) P-values in parentheses. (2) * and ** represent 1% and 5% levels of significance, respectively. (3) Author’s estimations using E-views software package 9.0.
Conclusions and Policy Recommendations
This paper investigates equilibrium and causality relationships between foreign portfolio investments and their determinants for Jordan. Annual time series data has been used for the period of 1978-2016. ARDL bounds testing approach has been employed to test the existence of co-integration, and to check long-run and short-run coefficients. However, the results of Fstatistics test confirm the existence of co-integration between foreign portfolio investments and their determinants. Domestic market capitalization, FDI, money supply, and government expenditures were having positive impact on foreign portfolio investments in long-run and shortrun. Different diagnostic tests confirm the perfectness of foreign portfolio investments model. VECM Granger causality shows bidirectional causality between foreign portfolio investments and their determinants in long-run and short-run.
From the results of this research paper, it can be concluded that Domestic market capitalization, FDI, money supply, and government expenditures are supportive to foreign portfolio investments in Jordan. The policy makers in the government of Jordan should review economic and financial policies time to time and pay high attention towards rights of foreign investors. The stable political situation and good economic policies provide welcoming atmosphere to foreign investments, which brings economic prosperity to Jordan. The policy makers in Amman stock exchange are ought to increase the number of listed corporations, this in turn increase domestic market capitalization. The policy makers in Jordan’s central bank should encourage the growth of money supply through decreasing lending interest rate. In addition, interest rate on deposits should be increased in order to attract foreign portfolio investments. An interesting future research could examine more determinants of foreign portfolio investments in Jordan.
Endnote
The results of unit root test are not reported, hence, available on request
References
- Adeniyi, O., & Omisakin, O. (2012). Foreign direct investment, economic growth and financial sector development in small open developing economies. Economic Analysis and Policy, 42(1), 105-127.
- Aizenman, J., Jinjarak, Y., & Park, D. (2013). Capital flows and economic growth in the era of financial integration and crisis, 1990-2010. Open Economies Review, 24(3), 371-396.
- Azam, M., & Ahmed, M.A. (2015). Role of human capital and foreign direct investment in promoting economic growth: Evidence from commonwealth of intendance states. International Journal of Social Economics, 42(2), 98-111.
- Bekaert, G., & Harvey, C.R. (1996). Capital markets: an engine for economic growth. The Brown Journal of World Affairs, 5(1), 33-53.
- Bekhet, H.A., & Al-Smadi, R. (2017). Exploring the long-run and short-run elasticities between FDI inflow and determinants in Jordan. International Journal of Business and Globalisation, 18(3), 337-362.
- Bekhet, H.A., & Matar, A. (2013). Co-integration and causality analysis between stock market prices and their determinates in Jordan. Economic Modeling, 35, 508-514.
- Bekhet, H.A., & Mugableh, M.I. (2012). Investigating equilibrium relationships between macroeconomic variables and Malaysian stock market index through bounds tests approach. International Journal of Economics and Finance, 4(10), 69-81.
- Bekhet, H.A., & Mugableh, M.I. (2013). Examining the equilibrium relationships between foreign direct investment inflows and employment in manufacturing and services sectors: evidence from Malaysia. Journal of Social and Development Sciences, 4(1), 32-38.
- Bekhet, H.A., & Mugableh, M.I. (2016). Blueprinting the equilibrium relationships between inward FDI and employment in the Malaysian economic sectors: time series models approach. Global Business and Economics Review, 18(2), 136-150.
- Boboye, A.L., & Ojo, O.M. (2012). Effect of external debt on economic growth and development of Nigeria. The International Journal of Business and Social Science, 3(12), 297-304.
- Brigham, E.F., & Ehrhardt, M.C. (2014). Financial management: theory and practice, 14th edition. USA.
- Chaudhry, I.S., Farooq, F., & Mushtaq, A. (2014). Factors affecting portfolio investment in Pakistan: evidence from time series analysis. Pakistan Economic and Social Review, 52(2), 141-158.
- Engle, R.F., & Granger, C.W.J. (1987). Co-integration and error correction representation: estimation and testing. Econometrica, 55(2), 251-276.
- Haider, M.A., Khan, M.A., & Abdulahi, E. (2016). Determinants of foreign portfolio investments and its effects on China. International Journal of Economics and Finance, 8(12), 143-150.
- Harvey, C.R. (1998). Capital flows and the behaviour of emerging market equity returns. Working paper at national bureau of economic research. Retrieved from http://www.nber.org/papers/w6669.pdf
- Jawaid, S.T., & Saleem, S.M. (2017). Foreign capital inflows and economic growth of Pakistan. Journal of Transnational Management, 22(2), 121-149.
- Johansen, S., & Juselius, K. (1990). Maximum likelihood estimation and inference on co-integration with applicants to the demand for money. Oxford Bulletin Economics and Statistics, 52(2), 169-210.
- Jordan’s Country Brief Report (2017). Retrieved from http://dfat.gov.au/geo/jordan/ pages/jordan-country-brief.aspx
- Jordan’s Economic Outlook 2017. Retrieved from http://www.worldbank.org/en/country/ jordan/overview
- King, R., & Levine, R. (1993). Finance, entrepreneurship, and growth. Journal of Monetary Economics, 32(3), 513-542.
- Kuar, M., & Dhillon, S. (2010). Determinants of foreign institutional investors’ investment in India. Eurasian Journal of Business and Economics, 3(6), 57-70.
- Levine, R., & Zervos, S. (1996). Stock market development and long-run growth. Policy Research Working Paper. Retrieved fromhttps://hvtc.edu.vn/Portals/0/files/63633467281 01536641813-9450-1582pdf
- Mugableh, M.I. (2013). Analysing the CO2 emissions function in Malaysia: Autoregressive distributed lag approach. Procedia Economics and Finance, 5, 571-580.
- Mugableh, M.I. (2015a). Economic growth, CO2 emissions, and financial development in Jordan: Equilibrium and dynamic causality analysis. International Journal of Economics and Finance, 7(7), 98-105.
- Mugableh, M.I. (2015b). Time series analysis of inward foreign direct investment function in Malaysia. Procedia-Social and Behavioral Sciences, 172, 679-685.
- Mugableh, M.I. (2015c). Equilibrium models of the Malaysian stock market and macro economy (First Edition), LAP LAMBERT Academic Publishing. Germany: Berlin. ISBN: 978-3-659-78870-3
- Mugableh, M.I. (2017a). World oil price volatility and stock returns fluctuations: evidence from Southeast Asian equity markets. Science International, 29(4) 759-762.
- Mugableh, M.I. (2017b). Estimating elasticity function of Jordanian aggregate import demand. Applied Economics and Finance, 4(2), 33-37.
- Narayan, P.K. (2005). The saving and investment nexus for China: evidence from co-integration
- tests. Applied Economics, 37(17), 1979-1990.
- Oskooee, M.B., & Brooks, T. (2003). A new criteria for selecting the optimum lags in Johansen’s co-integration technique. Applied Economics, 35(8), 875-880.
- Pesaran, M. H., Shin, Y., & Smith, R.J. (2001). Bounds testing approaches to the analysis of level relationships. Journal of Applied Econometrics, 16(3), 289-326.
- Rajan, R.G., & Zingales, L. (1997). Financial dependence and growth. The American Economic Review, 88(3), 559-586.
- Santander Trade Portal Report (2017). Retrieved from https://en.portal.santandertrade.com/establish-overseas/jordan/investing
- UNCTAD (2017). United Nations Conference on Trade and Development. Retrieved from http://unctad.org/en/Pages/DIAE/Foreign-Direct-Investment-(FDI).aspx
- World Development Indicators Database (2017). Retrieved from http://databank.worldbank.org/ data/reports.aspx?source=world-development-indicators
- Zadeh, H.A., & Madani, Y. (2012). Financial market development, FDI and economic growth in Iran. Journal of Basic and Applied Scientific Research, 2(1), 228-230.