Research Article: 2020 Vol: 26 Issue: 4
Multifractal Analysis Evidence from Some Islamic Stock Indexes
Chiadmi Mohammed Salah, Mohammed V University in Rabat
Kaoutar Abbahaddou, Mohammed V University in Rabat
Abstract
Multifractal modeling has been the subject of several studies in several fields such as geophysics, climatology, image processing and the study of internet traffic. Recently, finance has been the target area for the application of fractals. Several articles have attempted to study the multi-fractality of financial series. Our paper aims to put multifractal analysis into practice in the field of Islamic finance. We have proven that Islamic stock indexes exhibit multifractality through the property of scale invariance.
Keywords
Fractal Theory, Conditional Variance, Scale Invariance, Islamic Stock Markets.
JEL
C52, C58, G15.
Introduction
Modeling financial time series is one of the most complicated tasks in finance. In fact, the recent financial crisis highlighted the fragility of some models that did not consider stylized facts usually observed in financial markets. Since financial time series have particular empirical features, the objective of our paper is to investigate the multi-fractal behavior of Islamic stock indexes that is considered as a new category of indexes. The paper is organized as follows. First, we present the literature review. Secondly, we introduce the theoretical foundations of the multifractal analysis applied to financial time series. Finally, we render the empirical findings of estimation before providing a conclusion.
Literature Review
Mathematical modeling applied to finance finds its origins in Bachelier’s research (1900), where he presented it as the theory of speculation. Bachelier has demonstrated that the Brownian motion is appropriate for modeling dynamics of financial assets returns. The theory stipulates that financial assets returns should be normally distributed with constant mean and finite variance. His original work has been developed later by Black and Sholes (1973) Markovic (1963) and others. Thereafter, finance has experienced an increased growth thanks to a rich theoretical basis and a sophisticated computer industry.
However, given that many financial crises have occurred, especially during the last decade, some questions have been raised about the reliability of existing financial models. Similarly, the accuracy of some assumptions has been also highlighted, mainly the hypothesis of normality of stock prices and the homoscedasticity hypothesis. In this respect, all classical models of finance have been challenged by the inability of the Gaussian model to predict the occurrence of crises and the rise of extreme risks.
As a matter of fact, many researchers have argued against the initiation of the Brownian motion because of the lack of a mathematical rigor and the underestimation of risk. Therefore, several crashes have occurred since the early twentieth century until today, while their probability of occurrence was null. This is mainly explained by the shape of the normal distribution that is very flattened and has very thin tails, which seriously impacts outliers by neglecting them. (Herlin, 2010).
Given the imperfections identified in classical models, new models have been developed to ensure an optimal modeling of financial assets returns. It is particularly the case of the autoregressive conditional heteroskedasticity (ARCH) model introduced by Engle (1982), usually used in many empirical applications in finance to model conditional variance. However, empirical evidence showed that ARCH model needs to consider the dynamic behavior of conditional variance. For this reason, the Generalized ARCH (GARCH) model has been suggested by Bollerslev (1986) to fulfill this requirement. As it is based on an infinite ARCH specification, it reduces the number of estimated parameters from infinity to two. Both ARCH and GARCH models capture some stylized facts observed usually in financial time series including volatility clustering and leptokurtosis. Yet, they fail to model the leverage effect because of their symmetric distributions. In order to address this problem, many nonlinear extensions of GARCH have been suggested, such as the Exponential GARCH (EGARCH) model by Nelson (1991), the Asymmetric Power ARCH (APARCH) model by Ding (1993) and GJR model by Glosten et al. (1993).
GARCH models have a limitation to capture the thick tails property of high frequency financial time series. In order to overcome this restriction, some researchers used non-normal distributions to better model this excess kurtosis. Bollerslev (1987); Baillie and Bollerslev (1989); Kaiser (1996); Beine and Lecourt (2000) among others used Student-t distribution while Nelson (1991) and Kaiser (1996) suggested the Generalized Error Distribution (GED).
However, it is important to note that GARCH models are not well suited for modeling the long memory that is often found in conditional mean and variance of financial time series. A long memory is also known as the long-term dependence property and it describes the high-order correlation structure of series. If time series possesses long memory, there is a persistent temporal dependence between observations even if they are considerably separated in time (Gurgul & Wójtowicz, 2006).
Thereby, classical models for financial assets returns, including GARCH models, take into consideration just partially empirical properties. For this reason, we are going to introduce new models able to capture other stylized facts like the scale invariance mainly. This concept refers to the invariance of individual functions or curves. A closely related concept is self-similarity, where a function or curve is invariant under a discrete subset of dilatations. It is also possible for the probability distributions of random processes to show this kind of scale invariance or selfsimilarity.
The added value of this paper is to investigate multifractality of Islamic stock indexes. In fact, Islamic finance is one of the fastest growing segments of the global financial system. It is a financial system that operates according to Islamic law (called also sharia). Similarly to conventional financial systems, Islamic finance incorporates banks, capital markets, fund managers, investment firms, and insurance companies. However, these entities are governed both by the Islamic law as well as the rules and regulations of the finance industry applied to the conventional counterparts. The size of the Islamic banking industry at the global level was close to $820 billion at the end of 2008 (International Monetary Fund, 2010). Several factors have contributed to the strong growth of Islamic finance, including: strong demand in many Islamic countries for Shariah-compliant products, meaning an investment vehicle fund structured in accordance with Shariah rules; growing demand from conventional investors, including for diversification purposes; and the capacity of the industry to develop a number of financial instruments in order to meet most of the needs of corporate and individual investors.
Moreover, the recent global crisis has renewed the focus on the relationship between Islamic banking and financial stability and, more specifically, on the resilience of the Islamic banking industry during crises (Maher Hasan & Jemma Dridi, 2010).
Despite the increasing importance of Islamic finance over the past several years, the existing literature on Islamic stock indexes is scarce and contains only few empirical studies about the dynamic behavior of conditional variance. The majority of studies have focused on the performance of Islamic stock indexes and the comparison with conventional stock indexes.
Ahmad and Ibrahim (2002) conducted a comparative study between Kuala Lumpur Shariah Index (KLSI) and Kuala Lumpur Composite index (KLCI). For this matter, They compared the risk and return performance of KLSI with KLCI during the period 1999 to 2002. The results reveal that KLSI underperforms during over the whole decline period but it overperforms during the growing period. Moreover, they found that there is not a significant difference in performance of both indices during the given period.
Hakim and Rashidian (2004) analyzed the risk and return of Dow Jones Islamic Stock Market Indices (DJIM) from 1999 to 2002. They had initially compared DJIM index, Wilshire 5000 stock market index and they found that the return and the risk of the Islamic index is less than the Wilshire 5000. The study also examined the long run and short run relationship existing among the variables using unit root test, co-integration and causality test.
Hussein (2004) compared the performance of ethical investment with their unscreened benchmarks. The study empirically tested whether returns of FTSE Global Islamic Index are significantly different from their index counterpart (FTSE All- World Index). The results show that 215 applications of ethical screening do not have an adverse effect on the FTSE Global Islamic Index performance.
Hussein (2005) tested whether monthly returns of Financial time stock Exchange (FTSE) Global Islamic index and Dow Jones Islamic Market Index are significantly different from their common index for the period January 1996 to December 2004. In the short run period, Islamic indices statistically over performed during the whole period and the second bull market period. In the long run, Islamic indices over perform during the entire period and the second bull market period. Finally, the study showed that there is a similar performance between indexes.
When it comes to studies about stock market volatility, Yusof and Majid (2007) attempted to explore to which extent the conditional volatilities of both conventional and Islamic stock markets in Malaysia are related to the conditional volatility of monetary policy variables. Generalized Autoregressive Conditional Heteroskedasticity GARCH-M, GARCH (1,1) models and Vector Autoregressive (VAR) analysis are employed for the monthly data during the period starting from January 1992 to December 2000 in this study. The results showed that the interest rate volatility affects the conventional stock market volatility but not the Islamic stock market volatility. This highlights the tenet of Islamic principles that the interest rate is not a significant variable in explaining stock market volatility.
Finally, Chiadmi and Ghaiti (2012) analyzed the volatility behavior of SP sharia and Dow Jones Islamic market index and their counterpart S&P 500 and DJIA using GARCH models with normal and non-normal distribution. The results revealed that the volatility persistence of both stock indexes was very significant but S&P Sharia index was less volatile than the conventional index. This result is very important indicating that Islamic stock indexes are more resilient than conventional indexes especially on the crisis period. It is similar to the study of (Dridi, 2010). Nevertheless, this study did not take into consideration other stylized facts like the scale invariance mainly.
As discussed above, most authors and researchers have made performance comparative studies between the Islamic and conventional stock indexes. However, there are few empirical studies which estimated Islamic stock market volatility using advanced models such as multifractal processes.
Methodology
For centuries, Euclidean geometry was the only way adopted to represent any object in nature. However, this method has shown limitations. It had been confronted with complex objects forms that cannot be represented by simple shapes created mainly by curves and lines. Surveyors found it illogical to contrast the mountains to cones, clouds to spheres and trees to cylinders. At that time, classical geometry had no answers to these problems, and many phenomenon have remained unexplained shows in Figure 1.

Figure 1: The Von Koch Snowflake After 3 Iterations (Acta Math. 30, 145-174, 1906)
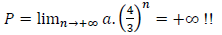
In 1904, the Swedish mathematician Helge von Koch published an article "On a continuous curve without a tangent," in which he represented the snowflake that bears his name. Von Koch got this form starting with an equilateral triangle of perimeter a , he broke each side into three equal pieces, and replaced through another equilateral triangle; By repeating this process n times while n tends to infinity he obtained a flat and continuous shape with a finite surface. This form does not admit tangent at any point and its perimeter is:
Mandelbrot was the first to call it fractal (from the Latin word fractus which means broken), Mandelbrot has devoted all his time to study these forms, to capture its essence and to give it the exact definition: "fractals are objects [...] described as irregular, rough, porous or fragmented, and have most of these properties with the same degree at all scales. This means that these objects have the same shape when seen nearly or at distance. "
Fractals keep the same form regardless of the scale used and represent "zigzags that never fade". These findings make it possible to use one day to study chaotic phenomena, especially in finance.
The classic analysis of extreme market events is not obvious because of the low frequency of observation of these phenomena. Fractal approach allows analysis of these phenomena in terms of "scaling properties" notion. The scaling properties refers to the recurrence of a certain phenomenon observed at different scales. The application of this concept to financial series shows that there are statistical regularities in the monthly, weekly, daily or intraday price variations. Considering this pattern allows the modeling of financial series to be transferable to all levels of observation. For example, a major shock at the scale of a day can help modeling shocks observed at lower frequencies.
The multi-fractal modeling has been the subject of several studies in several fields such as geophysics, climatology, image processing and the study of Internet traffic. Yet recently, finance was the target field for the application of fractals. Several papers have attempted to study the multi-fractal aspect of financial time series. The multi-fractality has been observed in many financial markets and the results are similar. Fillol (2005) studied the behavior of the exchange rate Dollar / Euro. He highlighted the multi-fractal nature of this rate and concluded through the Monte Carlo simulation the superiority of multi-fractal modeling compared to GARCH and FIGARCH models. Cont (2000) highlighted some empirical properties by studying the behavior of the market index S&P 500. He highlighted then the property of scale invariance which is one of the properties of multi-fractal models. All studies have targeted classical series from conventional financial markets. Yet, we will analyze the multi-fractal behavior of Islamic indices through the detection of scale invariance and self-similarity.
Mathematically, a phenomenon representing scale invariance is described by a power law:
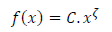
Where f is a function, C is a constant called proportionality constant, and ζ is another constant, called the exponent of the law.
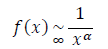
Pareto used this power law by studying the distribution of wealth; he showed that the fraction of individuals with income greater than x is follows asymptotically the power law (or Pareto) with an index α equal approximately to 1.5
Our goal is to study the scale invariance for stochastic processes. Given a process  with stationary increments, we say that it is scale invariant if the absolute moments of
  (increments) follow a power law:
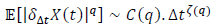
With: for every t ∈ T, q ∈ Q, wherein T and Q are R intervals, ζ (q) and C (q) are functions
defined on Q. In addition, 0 ∈ T and [0,1] ⊆ Q. We say that is Mono-fractal if ζ (q) is
linear and multifractal and if ζ (q) is not linear such as ζ (q) is the multifractal exponent shows in Tables 1 & 2.
| Table 1: Absolute Returns Moment Of Jakarta Islamic Index At Various Time Scales From 1 To 10 Days | ||||||||||
| 1jr | 2jr | 3jr | 4jr | 5 jr | 6jr | 7jr | 8jr | 9jr | 10 jr | |
| q=0,5 | 1,4 | 1,8 | 2,0 | 2,1 | 2,3 | 2,4 | 2,6 | 2,6 | 2,8 | 2,9 |
| q=1 | 2,9 | 4,4 | 5,3 | 6,2 | 7,0 | 7,9 | 8,7 | 8,7 | 10,2 | 10,7 |
| q=1,5 | 7,4 | 13,4 | 17,7 | 22,5 | 26,6 | 32,4 | 36,1 | 35,6 | 46,2 | 49,0 |
| q=2 | 22,7 | 48,3 | 69,4 | 95,2 | 116,9 | 156,2 | 176,1 | 166,6 | 244,1 | 264,6 |
| q=2,5 | 79,8 | 194,3 | 305,6 | 450,5 | 578,9 | 850,2 | 970,8 | 861,8 | 1447,1 | 1615,6 |
| q=3 | 311,9 | 853,4 | 1475,1 | 2309,8 | 3149,8 | 5069,4 | 5895,6 | 4808,2 | 9366,1 | 10851,3 |
| q=3,5 | 1329,3 | 4012,2 | 7651,1 | 12561,2 | 18485,7 | 32374,7 | 38562,7 | 28382,4 | 64875,5 | 78432,3 |
| q=4 | 6070,4 | 19935,5 | 42034,6 | 71347,2 | 115265,2 | 217590,5 | 266591,7 | 174924,1 | 473932,2 | 599851,7 |
| q=4,5 | 29290,5 | 103687,5 | 241891,5 | 418736,4 | 753971,9 | 1518804,2 | 1918916,5 | 1115046,2 | 3611119,3 | 4792207,8 |
| q=5 | 147619,7 | 560228,1 | 1444801,3 | 2519935,6 | 5119375,5 | 10902348,6 | 14219777,9 | 7302326,9 | 28453957,7 | 39603276,3 |
| Table 2: Absolute Returns Moment DJIMI At Various Time Scales From 1 To 10 Days | ||||||||||
| 1 jr | 2 jrs | 3jrs | 4jrs | 5 jrs | 6jrs | 7jrs | 8jrs | 9jrs | 10 jrs | |
| q=0,5 | 3,3 | 4,2 | 4,7 | 5,1 | 5,4 | 5,5 | 5,8 | 6,0 | 6,1 | 6,4 |
| q=1 | 13,9 | 21,8 | 26,7 | 31,2 | 35,7 | 37,0 | 41,3 | 44,1 | 45,6 | 49,8 |
| q=1,5 | 69,4 | 131,6 | 175,6 | 220,6 | 273,4 | 291,6 | 336,0 | 374,1 | 387,6 | 443,6 |
| q=2 | 400,0 | 897,5 | 1296,9 | 1750,8 | 2391,6 | 2592,3 | 3048,1 | 3600,2 | 3642,3 | 4406,5 |
| q=2,5 | 2637,1 | 6791,8 | 10558,9 | 15326,7 | 23740,1 | 25694,7 | 30303,1 | 39041,4 | 37193,9 | 47909,8 |
| q=3 | 19714,4 | 56366,7 | 93600,6 | 146165,3 | 265297,6 | 282102,7 | 325521,2 | 475631,4 | 407987,7 | 562517,4 |
| q=3,5 | 165502,0 | 507676,2 | 893690,3 | 1500783,6 | 3290741,3 | 3406251,2 | 3731227,1 | 6472172,9 | 4770080,7 | 7052366,8 |
| q=4 | 1539249,9 | 4912163,5 | 9096454 | 16398088,8 | 44439116,7 | 44724907 | 45110119,8 | 97149964,1 | 59101881 | 93497562,8 |
| q=4,5 | 15595326,2 | 50553496,7 | 97734077,2 | 188514673 | 640241362 | 629039862 | 569245026 | 1579444265 | 772011778,6 | 1299706947 |
| q=5 | 169125386 | 548084908 | 1098326394 | 2256737694 | 9669054182 | 9325336772 | 7430075676 | 27262964534 | 10573318664 | 18803675998 |
Data and Empirical Finding
In order to detect the multi-fractality of Islamic indices, we calculate the absolute moments of order for various time scales from 1 to 10 days and a range of moments from 0.5 to 5. Then we will plot these moments to detect scale invariance as the main characteristic of multi-fractal process. As a reminder, a series presenting scaling relations in moments, is a series where there is a single characteristic between the expectancy, variance, moment of order 3 ... We are talking about uni-fractal series when there is only one relationship of scale and multi-fractal series when there is more. A scaling relationship defines the existence of similar characteristics for any scale of observation. We will use data from two Islamic stock indexes, Dow Jones Islamic Market index (DJIMI: from 1/1/2009 to 1/1/2018) and Jakarta Islamic Index (JII: from 03/07/2000 to 01/01/2018). The development tool is VBA excel Figure 2 & 3.

Figure 2: Absolute Returns Moments Of JII

Figure 3: Absolute Returns Moments Of DJIMI
We clearly observe that the scale invariance is verified for all Islamic indexes, but it begins to disappear after the integral time estimated to 3 days.
We will calculate the function C (q) for q ranging from 0.5 to 5 before computing the exponent multi-fractal for Islamic indexes shows in Table 3.
| Table 3: The Function c(q) | ||
| JII | DJIMI | |
| q=0,5 | 1,4 | 3,3 |
| q=1 | 2,9 | 13,9 |
| q=1,5 | 7,4 | 69,4 |
| q=2 | 22,7 | 400,0 |
| q=2,5 | 79,8 | 2637,1 |
| q=3 | 311,9 | 19714,4 |
| q=3,5 | 1329,3 | 165502 |
| q=4 | 6070,4 | 1539249,9 |
| q=4,5 | 29290,5 | 15595326,2 |
| q=5 | 147619,7 | 169125386 |
We will deduct the value of the exponent multi-fractal ζ (q) for the two indexes shows in Table 4.
| Table 4: The Exponent Multi-Fractal ζ (q) | ||
| JII | DJIMI | |
| q=0,5 | 1,79 | 1,82 |
| q=1 | 2,18 | 2,26 |
| q=1,5 | 2,61 | 2,74 |
| q=2 | 3,06 | 3,24 |
| q=2,5 | 3,51 | 3,72 |
| q=3 | 3,95 | 4,12 |
| q=3,5 | 4,35 | 4,43 |
| q=4 | 4,74 | 4,6 |
| q=4,5 | 5,11 | 4,68 |
| q=5 | 5,48 | 4,68 |
In this Figure 4 we see that the multi-fractal exponent is non-linear for both indexes. It can be deduced that they have a multi-fractal structure. We have demonstrated that the distribution of price changes related to Islamic stock indexes follows a law of scale. The variations with large amplitude are as frequent as those with small amplitude. This completely contradicts the foundations of normal law, which states that a change with a major magnitude is much rarer than a variation of small magnitude. According to this approach, the risk of bankruptcy is much more common. However, for the normal law, an extreme difference of course has a very low probability while it is far more common with the power law. The law of scale, according to Mandelbrot, makes difficult decisions, and perilous forecasts (Herlin, 2010).

Figure 4: The Multifractal Exponent
Conclusion
The multi-fractal approach of financial markets found its origin in the founding work of Mandelbrot (1963). The founder of fractals theory established an inventory of contemporary financial markets. He highlighted the limitations of classical models since Bachelier’s models (1900). He argued that the assumptions underlying the use of standard financial tools are not realistic. In fact, price changes are not continuous but practically perform leaps. Indeed, price variations are neither independent nor stationary and do not follow a normal distribution. He also supports the fact that the hypothesis of market efficiency is not relevant; the market is not always a fair game in which sellers balance buyers.
Islamic finance could therefore take a benefit from the performance of this new model. This model has the main advantage of taking into account most of the stylized facts, unlike the conventional models struggling to capture the scale invariance. The multi-fractal model also has the ability to take into consideration the brutal dynamics associated with the emergency of crises and the occurrence of extreme events.
References
- Ahmad, Z., &amli; Ibrahim, H. (2002). A study of lierformance of the klse syariah index. Malaysian Management Journal, 6(1&amli;2), 25-34.
- Bachelier, L (1900). The theory of slieculation, Scientific Annals of the ENS, 3rd series. 17, 21-86.
- Baillie, R.T., &amli; Bollerslev, T. (1989). Common Stochastic Trends in a System of Exchange Rates. Journal of Monetary Economics, 44, 167-181.
- Beine, M., &amli; Laurent, S. (2000). Structural Change and Long Memory in Volatility: New Evidence from Daily Exchange Rates, Working lialier, University of Liege.
- Black, F., &amli; Scholes, M. (1973). The liricing of olitions and corliorate liabilities. Journal of liolitical Economy, 81, 637-654.
- Bollerslev, T., (1986).&nbsli; Generalized autoregressive conditional heteroskedasticity. Journal of Econometrics, 5, 1-50.
- Engle, R. (1982). Autoregressive Conditional Heteroscedasticity with estimates of the Variance of U.K. Inflation, Econometrica, 50, 987-1008.
- Calvet (L.) et Fisher (A.) (2007). Multi-frequency news and stock returns. Journal of Financial Economics, 86, 178-212.
- Chiadmi, M.S., &amli; Ghaiti, F. (2012). Modeling Volatility Stock Market using the ARCH and GARCH Models: Comliarative Study between an Islamic and a Conventional Index (Sli Shariah VS Sli 500), International Research Journal of Finance and Economics, 91.
- Cont, R. (2000). Emliirical lirolierties of asset returns: stylized facts and statistical issues. Quantitaive Finance, 1(2001), 223–236.
- Ding, Z., Granger C.W.J., &amli; Engle, R.F. (1993). A long memory lirolierty of stock market returns and a new model. Journal of Emliirical Finance, 1(1).
- Fillôl, J., (2005). Modélisation multi-fractale du taux de change USD/Euro, Economie Internationale, no: 104.
- Glosten, L.R., Jaganathan, R., &amli; Runkle, D.E. (1993). On the relation between the exliected value and the volatility of the nominal excess returns on stocks. Journal of Finance, 48, 1779-1801.
- Gurgul, H., &amli; Wojtowicz, T. (2006). Long Memory on German Stock Exchange. Finance a UVER-Czech Journal of Economics and Finance, 56, 447–467.&nbsli;&nbsli;
- Hakim, S., &amli; Rashidian, M. (2002). Risk &amli; return of Islamic stock market indexes. 9th Economic Research Forum Annual Meeting, 26-29 October, Sharjah UAE.
- Herlin, li. (2010). Finance le nouveau liaradigme, Edition Eyrolles, liage 44.
- Hussein, K. (2005). Ethical Investment: Emliirical Evidence from FTSE Islamic Index. Islamic Economic Studies, 12(1), 21-40.
- Hussein, K., &amli; Omran, M. (2005). Ethical Investment Revisited: Evidence from Dow Jones Islamic Indexes. The Journal of Investing, 14(3), 105-124.
- Kaiser, T. (1996). One-Factor-GARCH Models for German Stocks - Estimation and Forecasting. Working lialier, Universiteit Tubingen.
- Maher, H., &amli; Dridi, (2010). The Effects of the Global Crisis on Islamic and Conventional Banks:A Comliarative Study, IMF working lialier.
- Mandelbrot, B. (1963). The Variation of Certain Slieculative lirice. Journal of Business, 36, 394-419.
- Mandelbrot, B. (1967). The variation of the lirices of cotton, wheat and railroad stocks, and some financial rate. The Journal of Business, 40, 393-413.
- Markowitz, H. (1952). liortfolio Selection. Journal of Finance, 7(1), 77-91.
- Nelson, D.B. (1991), Conditional Heteroscedasticity in Asset Returns: A New Aliliroach. Econometrica, 59(2), 347-70.
- Yusof, R.M., &amli; Majid M.S.A. (2007). Stock Market Volatility Transmission in Malaysia: Islamic Versus Conventional Stock Market. Islamic Economics, 20(2), 17-35.