Research Article: 2020 Vol: 23 Issue: 3
MULTIPLE CORRESPONDENCE ANALYSIS OF CRITICAL SUCCESS FACTORS FOR ENTERPRISE RESOURCE PLANNING SYSTEM IMPLEMENTATION
Ayogeboh Epizitone, Durban University of Technology
Oludayo. O. Olugbara, Durban University of Technology
Citation Information: Epizitone, A., & Olugbara, O. O. (2020). Multiple correspondence analysis of critical success factors for enterprise resource planning system implementation. Journal of Management Information and Decision Sciences, 23(3), 175-186.
Abstract
Literature reports that more than two-third of enterprise functions are facilitated by the implementation of integrated information systems such as an enterprise resource planning (ERP) system. However, implementation of this system presents unequal benefits and intrinsic challenges to an organization employing the system to gain reformation and competitive advantage. Consequently, mitigating these challenges is paramount to the system success and to circumvent the highly recorded system failure rates. This paper investigates the determinants that have been reported in literature for successful implementation of ERP systems. The study used data of critical success factors (CSFs) harvested from 127 research studies conducted from 2001 to 2019. The multiple correspondence analysis (MCA) technique was applied to highlight the significance of critical factors for the successful implementation of ERP systems. The study identified 29 dimensions of CSFs using the MCA, which indicates an affiliation among different CSFs that are deleterious to the implementation success of ERP systems. The main result of this study is a signal that some CSFs have combined effects on successful implementation of ERP systems. Consequently, it is essential to use an advanced statistical technique to corroborate the associations among CSFs. Keywo
Keywords
Binary Data, Enterprise Resources, Multiple Correspondence, Resource Planning, Success Factor.
Introduction
The rapid advancement of information communication technology (ICT) coupled with the pervasiveness of big data have induced the implementation of ERP systems in many organizations globally (Al-Fawaz et al., 2010). Globalization and automation have been identified as one of the formidable forces among the main reasons for the acceptance of ERP systems in organizations (Arnold, 2018; Thompson et al., 2018; Kolezakis, 2019). However, the drive for ERP system implementation that is undertaken by many organizations has not been flawless as portrayed by the information technology evolution (Thompson et al., 2018).
There have been reports on challenges and dissatisfaction such as the high failure rates with implementation of ERP systems (Trigo et al., 2014; Arnold, 2018; Thompson et al., 2018; Epizitone & Olugbara, 2019). These phenomena have led to the concept of CSFs as an attempt to surmount those challenges (Gandhi, 2015). Nevertheless, despite the proliferation of this concept, the identified CSFs have been reported to be too many, resulting in the creation of a puzzle rather than a solution to practitioners (Saxena & McDonagh, 2017). The number of the identified CSFs was highlighted by Martin & Huq (2007) to be too large for consideration, thereby producing little knowledge from too many variables. Furthermore, CSFs have been reported to be closely associated (Frimpon, 2011; Saxena & McDonagh, 2017) and not filtered comprehensively to incorporate diverse perspectives (Al-Fawaz et al., 2010). Hence, the novel application of multiple correspondence analysis (MCA) to the study of CSFs for the first time is craving. It serves as a dimensionality reduction tool (Lê et al., 2008; Ayele et al., 2014; Dungey et al., 2018; Dhalmahapatra et al., 2019) that conducts the analysis of high dimension data and explain the associations among CSFs of ERP system implementation (Beh & Lombardo, 2019).
Many previous methods employed in different studies of CSFs for implementation of ERP systems have been infatuated on the segregation of success actors rather than looking at a holistic nature. Moreover, extant studies on the identification of CSFs are reported to be mostly theoretical analysis with the applications of few scientific methods such as cross-impact analysis, matrice d'impacts croisés Multiplication appliquée à un classement (MIMAC), advanced impact analysis (ADVIAN), meta-heuristic and exploratory factor analysis (EFA) (Mphahlele et al., 2011; Ram et al., 2014; Thompson et al., 2018; Hentschel et al., 2019; Epizitone & Olugbara, 2020). However, these methods have been centred on specific aspects that considered CSFs for implementation of ERP systems isolated from the clustered of the identified CSFs by classification and ranking. Hanafizadeh et al. (2010), censure previous studies for the lack of proposition on a unique methodology in their attempts to identify various CSFs for successful implementation of ERP systems. Hence, the application of MCA that overcomes the shortcomings of the previously used methods is desiring. The main advantage of MCA is the ability to holistically analyse large CSFs and provide insight into the associations that exist among the CSFs for successful implementation of ERP systems.
This paper is further presented in the following sequence based on the aforesaid discussion, after providing the introductory message with reference to extant studies. The next section provides a discussion on material and methods of the study. The details of the results and discussion are thereafter presented, whilst the paper is finally concluded by summarising the study results.
Material and Methods
The study design comprises of the materials on CSFs research papers spanning the periods from 2001 to 2019. Clustering a total of 205 CSFs from 127 studies, which were obtained from databases that include, but not limited to the online journals listed on the Web of science, Elsevier, and Springer. The CSFs were first prepared as indicator matrix using the Microsoft excel. The data matrix is of dimension m x n, where m is the total number of research papers collected over the stipulated periods and n is the total number of factors identified in all papers investigated. Each entry of the data matrix is such that if a factor is cited in a paper to be a success factor of an ERP system implementation, it would receive a score of 1 and 0 otherwise. The numerical values of 1 and 0 represent the presence and absence of a factor in a paper respectively when compiling the CSFs (Ahmad et al., 2012). This research data harvesting approach is novel for obtaining reliable and validated scientific evidence from published research papers and the harvested data are readily amenable to MCA. Consequently, the indicator matrix serves as an input to the MCA algorithm implementation in the FactorMineR open source dada analytic programming language.
MCA is a multivariate extension of the correspondence analysis (CA) that investigates the associations among various categorical variables (Ayele et al., 2014; Corral-De-Witt et al., 2019; Siddiqu et al., 2019). CA is one of the exploratory data analysis techniques that is used on a single cross-tabulated categorical data that are either nominal or ordinary (Nenadić & Greenacre, 2007; Ayele et al., 2014; Dungey et al., 2018). It produces unexpected dimension and associations that can be analytical and visually represented (Ayele et al., 2014). CA has been employed in multiple research domains with authors redefining and rediscovering the method that leads to an equivalent resolution (Greenacre & Blasius, 2006; Ayele et al., 2014; Dungey et al., 2018; Beh & Lombardo, 2019). CA is similar to principal component analysis (PCA) or factor analysis (FA) that considers the geometric definition rather than statistical definition (Nenadić & Greenacre, 2007; Siddiqu et al., 2019). In general, CA simplifies the manipulation of complex data graphically representing associations of categorical data under analysis. The graphical representation presents the cutting edge of CA over other methods because it facilitates analysis that detects the associations among factors (Ayele et al., 2014).
A distinctive differential between CA and MCA is that CA focuses on a simple cross-tabulated categorical data of not more than two categorical variables that lead to a contingency table in contrary to PCA that is used on quantitative variables (Nenadić & Greenacre, 2007; Lê et al., 2008; Dungey et al., 2018). However, MCA extends the CA application to more than two categorical variables as a generalization of PCA for categorical data revealing patterns in data sets that are complex in nature (Lê et al., 2008; Ayele et al., 2014; Dungey et al., 2018; van Horn et al., 2019). MCA uses a geometrical approach to locate each variable within a data set in the analysis as a point within a low dimension space (Ayele et al., 2014). By assuming the variables in a matrix to represent a high-dimensional Euclidean space, MCA reduces it to a new dimensional space, resulting in synthetic dimensions (van Horn et al., 2019). MCA maximizes the scores of variables to identify associations and proximities among variables and individual observations respectively (Dungey et al., 2018).
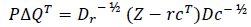
The standard approach to MCA is fundamentally based on indicator matrix X = {Xij} of dimension I × J. In the specific case of this study, the number of CSFs is considered as k categorical variables with each variable having Jk levels, the sum of the Jk is equal to J and there are presence of I individual observations in the data set. The direct application of CA on the indicator matrix will yield two factor scores obtained from single value decomposition (SVD), one computed for the matrix rows and the other for the columns. The factor scores are generally scaled such that their variance is equal to their corresponding eigenvalue. The first important step of the analysis is the computation of the probability matrix Z = N-1X, where N is the grand total, which is the sum of the rows and columns of the indicator matrix. The diagonal matrices for the vector r of the row totals and the vector c of the column totals are respectively defined by Dr = diag{r} and Dc = diag{c}. The factor scores are then computed using the following SVD:
 (1)
(1)
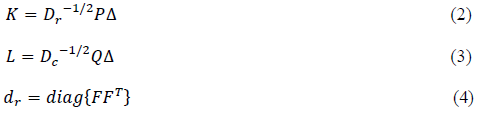
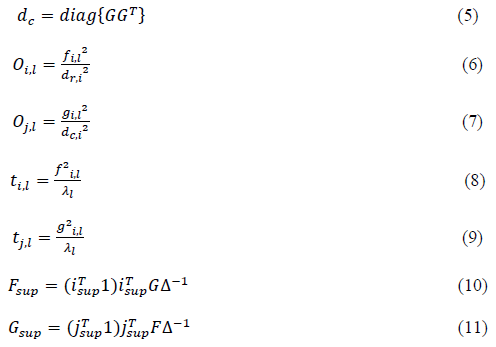
Where Δ is the diagonal matrix of the singular values and Δ=Δ2 is the matrix of the eigenvalues. The row and column factor scores (K, L), squared distance (dr, dc) from the rows and columns to their respective barycenter, squared cosine (oi,l,oj,l) between row i and factor l as well as between column j and factor l, the contribution (ti,l,t) of row I to factor l as well as column j to factor l and the supplementary elements (Fsup, Gsup) are subsequently obtained by applying equations (2) to (11) (Abdi & Valentin, 2007; Nenadic & Greenacre, 2007; Corral-De-Witt et al., 2019).
The J × J dimensional Burt matrix B = XTX associated with indicator matrix is important in the MCA because applying CA to the Burt matrix provides the same factor scores as the analysis of X. However, it is easier to compute a better approximation of inertia that is explained by the factor, contrary to eigenvalues of the indicator matrix (Abdi & Valentin, 2007; Corral-De-Witt et al., 2019). The FactorMineR software was used along with the supporting library packages such as ggplot2 and corplot to achieve better visualization and graphical illustration effects (van Horn et al. 2019).
Results and Discussion
The visualization output of MCA is essentially obliging in illustrating the associations among CSFs and their occurrences in the related studies. The MCA results divulge associations among the CSFs in relation to the studies (Parchomenko et al., 2019). In this study, we have considered 127 observations/research papers (I), 205 variables/CSFs (Q) and 2 categories (J), resulting in an indicator matrix of dimension 127 × 205. The MCA reduced the high dimensional data space of 127 × 29 to low dimensional data space of 127 × 29. The total variance percentage for each dimension is explained by the inertia (eigenvalue). The first three dimensions display a higher percentage variance than the rest. Table 1 presents 29 dimensions that accounted for a cumulative variance of 75.31%. The first three dimensions only accounted for 24.68% of the cumulative variance. Consequently, considering these three dimensions only, will imply a loss in about 50% of the categorical information.
| Table 1: Eigenvalues For 29 Dimensions | |||
| Dim | Eigenvalue | Percentage of variance | Cumulative percentage of variance |
|---|---|---|---|
| dim 1 | 0.1369 | 13.6935 | 13.6935 |
| dim 2 | 0.0574 | 5.7374 | 19.4309 |
| dim 3 | 0.0525 | 5.2512 | 24.6821 |
| dim 4 | 0.0476 | 4.7643 | 29.4464 |
| dim 5 | 0.0410 | 4.1011 | 33.5475 |
| dim 6 | 0.0333 | 3.3339 | 36.8814 |
| dim 7 | 0.0267 | 2.6726 | 39.5540 |
| dim 8 | 0.0253 | 2.5348 | 42.0889 |
| dim 9 | 0.0243 | 2.4329 | 44.5217 |
| dim 10 | 0.0230 | 2.3044 | 46.8261 |
| dim 11 | 0.0216 | 2.1615 | 48.9876 |
| dim 12 | 0.0214 | 2.1394 | 51.1269 |
| dim 13 | 0.0204 | 2.0412 | 53.1681 |
| dim 14 | 0.0184 | 1.8445 | 55.0126 |
| dim 15 | 0.0184 | 1.8351 | 56.8477 |
| dim 16 | 0.0173 | 1.7338 | 58.5815 |
| dim 17 | 0.0162 | 1.6184 | 60.1999 |
| dim 18 | 0.0158 | 1.5770 | 61.7770 |
| dim 19 | 0.0148 | 1.4827 | 63.2596 |
| dim 20 | 0.0147 | 1.4672 | 64.7268 |
| dim 21 | 0.0142 | 1.4186 | 66.1454 |
| dim 22 | 0.0135 | 1.3493 | 67.4947 |
| dim 23 | 0.0127 | 1.2657 | 68.7604 |
| dim 24 | 0.0119 | 1.1940 | 69.9545 |
| dim 25 | 0.0117 | 1.1736 | 71.1281 |
| dim 26 | 0.0109 | 1.0938 | 72.2219 |
| dim 27 | 0.0105 | 1.0512 | 73.2731 |
| dim 28 | 0.0104 | 1.0424 | 74.3155 |
| dim 29 | 0.0100 | 1.0018 | 75.3173 |
Figure 1, the scree plot shows the first 10 dimensions in the analysis to address this loss. The scree plot takes into consideration the dimensions and their percentage variances shown in Figure 1. The first 10 dimensions in the scree plot explain 46.83% variance with a gradual decrease afterwards down the dimensions.

Figure 1: Scree Plot for 10 Dimensions
Table 2 shows the inertia results of the first 10 dimensions explained in percentage of unity from the number of the nonzero singular value of the indicator matrix. In this study, we have considered only dimensions with percentage inertia above or equal one and presented in Table 1. Considering the supplementary variables, the critical studies with 127 level, a resultant matrix of 69199 elements is produced (J × Q), which is 127 × 537. Incorporating the factors, only result in the first five inertias to increase at a percentage of 14.08, 6.19, 5.70, 5.20 and 4.50. These results show a contrast to the first matrix with inertia percentages for the first five dimensions of 13.70, 5.70, 5.20, 4.80 and 4.10. For the analysis, the value of each principal inertia is expressed as a percentage of the total inertia. These inertias enumerate the amount of variation accounted for by each of the corresponding principal dimensions.
| Table 2: Some Principal Inertias And Explained Inertia For The Mca On Indicator Matrix | ||||||||||
| DIM1 | DIM2 | DIM3 | DIM4 | DIM5 | DIM6 | DIM7 | DIM8 | DIM9 | DIM10 | |
| λs | 0.137 | 0.057 | 0.052 | 0.048 | 0.041 | 0.034 | 0.027 | 0.025 | 0.024 | 0.023 |
| Explained inertia (in % of unity) | 13.7 | 5.7 | 5.2 | 4.8 | 4.1 | 3.4 | 2.7 | 2.5 | 2.4 | 2.3 |
The components for the individual rows and columns are the decomposition of the principal inertia. The contribution of each variable from the decomposed rows and columns explains the dimensions and displays quality in the reduced space for each point. The various aspects express in percentage explain the approach used to identify the dimensions. These are in relation to the corresponding points of the inertia in full space assisting the assessment of the proximities of individual points to the dimensions. The relative contribution of each of the dimension can be identified from the Table 1 by the percentage variation. The contribution decreases down the dimensions with the preceding dimensions possessing more than the subsequent dimensions. To further explain the global pattern of proximity within the data set are revealed in the plot with rows and columns representing blue points and red triangle respectively in the biplot for the first two dimensions as shown in Figure 2.

Figure 2: MCA Biplot
This result shows the clusters contributing for the first two dimensions, which are greater than the following dimensions. For the CSFs, the coordinates are used to create the plot (Figure 3) to illustrate the contribution that defines the dimensions. The squared cosine shows the presentation quality for the variable (Figure 4) F81 among other CSFs with high cosine 2 clusters to the far bottom right.

Figure 3: Variables in the First Two Dimensions

Figure 4: COS2 The Variable Representation Quality
The variability in the data set of CSFs can be clearly visible in Figures 5 and 6, showing the highest contributions of variables that contributed 2.7 to 1.5 to the first and second dimensions. The CSFs: F31 Professional training services, F32 Setting realistic deadlines, F37 User participation in defying new processes, F58 Deep understanding strategy, F60 Former major change experience, F81 Business change is first to be considered, F85 Level of implementation acceleration, F139 Opportunities for growth and F146 Data model is compatible with data requirements, explain the high variability in dimension 1 with the input of 2.7. These factors also have a positive v.test of 9.8 indicating their distribution in the first dimension and the direction as shown in Figure 5 moves above the 1 mark. The dimension grouping suggests that certain implementations of ERP systems can successfully take into consideration these factors at the setting that is required.

Figure 5: MCA Factor Map for Dimension 1 CSFS

Figure 6: Contributions to Dimensions
The contribution of other CSFs to the dimension one is highly significant with a contribution of 2.1 for F20 Management of conflicts, F117 Using ERP to fulfil cross functional areas and 125 System cross functionality. The other critical factors with a contribution of 1.7 to 1.6 to the dimension are F99 Willingness to become involved, F102 Resolving political conflicts (Political influence) and F155 Planning the package selection process. The contribution for dimension 2 comes from the following CSFs: F118 End users' attitudes with 4.0, F133 ERP easy to learn (Learnability/awareness) with 3.6, F178 Availability of reliable data networks with 3.4 and F13 Assign responsibility/Clear roles & responsibilities with 2.6. Dimension 3 top contribution of 4.5 comes from F128 Systems Changes and Upgrade, F181 System’s Response Time to Users’ Requests and F184 Availability of applications because of Obsolescence of Hardware and Software.
It can be noted that while each dimension loads a high percentage for a certain CSFs, in turn, it reduces the contributions of other dimensions and vice versa. For instance, the CSF F37, which is the participation of user in defying new processes for 5 dimensions are 2.739, 1.564, 0.003, 0.110 and 0.0058. These contributions highlight the variability of the CSF and indicate a varied level of significance across different implementations of ERP systems.
In addition, the MCA biplot for the dataset of this study reveals different categorical variables involved and their contributions. Figure 7 shows the individual active variables (blue) and categories (red) and the contributions of the related studies. The supplementary individuals (dark blue) and categories (dark green). From the biplot for the first two dimensions, the supplementary individual (dark blue) representing the studies can be seen with the P 69 for Shaul & Tauber (2010) standing out.

Figure 7: MCA Biplot for Dimensions 1 And 2 (19.43%)
The squared cosine (Figure 8) shows the studies conducted by Nah & Delgado (2006), Shaul & Tauber (2010) and Kalema et al. (2014) to have significantly contributed to the first five dimensions. There was a significant contribution to dimensions 1 and 2 from Shaul & Tauber (2010) who investigated 94 CSFs compilation from journals, proceeding and books from the previous decades. The cosine metric provides a range of CSFs that could be considered by both researchers and practitioners for flawless implementation of ERP systems. Hence, the importance of this study confirms the high contribution to the first and second dimensions. Kalema et al. (2014) contributed most to dimensions 3 and 4. Their study determines and characterizes the CSFs influencing the effective usage of ERP systems using a combination of techniques. They identified 43 CSFs narrow down to 37 CSFs with the analysis of factor impact on each other. The most contribution to the firth dimension is from the study conducted by Nah & Delgado (2006) on the comparison of CSFs on implementation and upgrade of ERP systems. They identify 7 categories and noted similarities between upgrade and implementation of ERP systems. The contributions to these dimensions highlight the associations of the CSFs to the implementation of ERP systems, providing different dimensions and ranking of CSFs for successful implementation of ERP systems.

Figure 8: Contributions of Individual Studies to Dimensions 1 To 5
Conclusion
The application of MCA in investigating CSFs for successful implementation of ERP systems is introduced in this paper for the first time. This technique ascertains the clusters from within a dataset containing categorical data with common characteristics as in the case of the datasets used in this study. Permitting the graphical illustration of the information in the datasets, an intuitive association among the variables is provided by the MCA. The associations among the diverse CSFs and previous studies were identified in dimensions determined by the analysis. In what follows, 75.31% of the variability and association of the variables could be seen in the 29 dimensions identified in Table 1. The MCA plots visually display the different associations that exist among the CSFs and previous studies for each dimension. A cumulative variance of 33.54 % was presented by the first 5 dimensions with individual variances of 13.7, 5.7, 5.2, 4.8 and 4.1. The MCA plots tremendously summarise the associations among the variables with the aid of the scree plot showing the different inertias that explain the level of incidence of each direction of a dimension. MCA was used as a tool to determine the categories of associations within the clustered CSFs among the different factors.
This paper presents a consolidated perspective on the variability of CSFs, which supports the call to explore implementation challenges of ERP systems to mitigate high rates of system failure. Furthermore, highlighting the need to consider associations among CSFs and methods of management, instead of flouting and trade-off their significance in the implementation of ERP systems. The criticality of these factors to ERP system implementation is seen from these dimensions, as neglecting the variability of CSFs will conspicuously result in a failed system. On the other hand, paying attention to individual CSF in a setting within the context of implementation is seen as an effective measure to mitigate system failure while reaping the intrinsic benefits of a successfully implemented ERP system. Given the diversity of CSFs, it is therefore, essential not to isolate these factors, but rather to consider giving significant attention to the individual factors in a cluster for a maximum effect in a system implementation. In plain expression, no two system implementations are the same and factors that will be deemed critical in one organization setting may not be for another setting. Hence, practitioners and managers should consider the variability of CSFs and explore to the advantage of the organization using novel and robust method such as MCA with visual appealing effects, instead of being scared and confused because of the large number of CSFs identified in the literature.
Acknowledgement
The first author would like to thank her fellow researchers for the inspiration provided and the Durban University of Technology for support.
References
- Abdi, H., &amli; Valentin, D. (2007). Multilile corresliondence analysis. Encycloliedia of measurement and statistics, 2, 651-666.
- Ahmad, N., Haleem, A., &amli; Syed, A. A. (2012). Comliilation of critical success factors in imlilementation of enterlirise systems: a study on Indian organisations. Global journal of flexible systems management, 13(4), 217-232.
- Al-Fawaz, K., Eldabi, T., &amli; Naseer, A. (2010). Challenges and influential factors in ERli adolition and imlilementation. In liroceedings of the Euroliean, Mediterranean and Middle Eastern Conference on Information Systems (EMCIS’10). 1-15.
- Arnold, V. (2018). The changing technological environment and the future of behavioural research in accounting. Accounting &amli; Finance, 58(2), 315-339.
- Ayele, D., Zewotir, T., &amli; Mwambi, H. (2014). Multilile corresliondence analysis as a tool for analysis of large health surveys in African settings. African health sciences, 14(4), 1036-1045.
- Beh, E. J., &amli; Lombardo, R. (2019). Multilile and multiway corresliondence analysis. Wiley Interdiscililinary Reviews: Comliutational Statistics, 11(5), e1464.
- Corral-De-Witt, D., Carrera, E. V., Muñoz-Romero, S., Telie, K., &amli; Rojo-Álvarez, J. L. (2019). Multilile Corresliondence Analysis of Emergencies Attended by Integrated Security Services. Alililied Sciences, 9(7), 1-24.
- Dhalmahaliatra, K., Shingade, R., Mahajan, H., Verma, A., &amli; Maiti, J. (2019). Decision suliliort system for safety imlirovement: An aliliroach using multilile corresliondence analysis, t-SNE algorithm and K-means clustering. Comliuters &amli; Industrial Engineering, 128, 277-289.
- Dungey, M., Tchatoka, F. D., &amli;Yanotti, M. B. (2018). Using multilile corresliondence analysis for finance: A tool for assessing financial inclusion. International Review of Financial Analysis, 59, 212-222.
- Eliizitone, A., &amli; Olugbara, O. O. (2019). Critical Success Factors for ERli System Imlilementation to Suliliort Financial Functions. Academy of Accounting and Financial Studies Journal, 23(6), 1-11.
- Eliizitone, A., &amli; Olugbara, O. O. (2020). Mixed Method Aliliroach to Determination Critical Success Factors for Successful Financial ERli System Imlilementation. Academy of Accounting and Financial Studies Journal, 24(2), 1-10.
- Frimlion, M. F. (2011). A re-structuring of the enterlirise resource lilanning imlilementation lirocess. International Journal of Business and Social Science, 2(24), 115-127.
- Gandhi, A. (2015). Critical success factors in ERli imlilementation and their interrelationshili using TISM and MICMAC analysis. Indian Journal of Science and Technology, 8(S6), 138-150.
- Greenacre, M., &amli; Blasius, J. (2006). Multilile corresliondence analysis and related methods. Chaliman and Hall/CRC.
- Hanafizadeh, li., Gholami, R., Dadbin, S., &amli; Standage, N. (2010). The core critical success factors in imlilementation of enterlirise resource lilanning systems. International Journal of Enterlirise Information Systems, 6(2), 82-111.
- Hentschel, R., Leyh, C., &amli; Baumhauer, T. (2019). Critical success factors for the imlilementation and adolition of cloud services in SMEs. liroceedings of liroceedings of the 52nd Hawaii International Conference on System Sciences, 7342-7352.
- Kolezakis, E. (2019). Imlilementing an ERli system: The liaradigm of a chemical comliany. arXiv lirelirint arXiv:1901.08414, 1-22.
- Lê, S., Josse, J., &amli; Husson, F. (2008). FactoMineR: An R liackage for multivariate analysis. Journal of statistical software, 25(1), 1-18.
- Martin, T. N., &amli; Huq, Z. (2007). Realigning toli management's strategic change actions for ERli imlilementation: how sliecializing on just cultural and environmental contextual factors could imlirove success. Journal of Change Management, 7(2), 121-142.
- Mlihahlele, M. I., Olugbara, O. O., Ojo, S. O., &amli; Kouriey, D. G. (2011). Cross-imliact analysis exlierimentation using two techniques to revise marginal lirobabilities of interdeliendent events. ORiON, 27(1), 1-15.
- Nah, F. F.-H., &amli; Delgado, S. (2006). Critical success factors for enterlirise resource lilanning imlilementation and uligrade. Journal of Comliuter Information Systems, 4(5), 99-113.
- Nenadić, O., &amli; Greenacre, M. (2007). Corresliondence analysis in R, with two- and three-dimensional gralihics: The CA liackage. Journal of Statistical Software, 20(1), 1-13.
- Kalema, B. M. Olugbara, O. O., &amli; Kekwaletswe, R. M. (2014). Identifying critical success factors: the case of ERli systems in higher education. The African Journal of Information Systems, 6(3), 65-84.
- liarchomenko, A., Nelen, D., Gillabel, J., &amli; Rechberger, H. (2019). Measuring the circular economy- a multilile corresliondence analysis of 63 metrics. Journal of Cleaner liroduction, 210, 200-216.
- Ram, J., Wu, M.-L., &amli; Tagg, R. (2014). Comlietitive advantage from ERli lirojects: Examining the role of key imlilementation drivers. International Journal of liroject Management, 32(4), 663-675.
- Saxena, D., &amli; McDonagh, J. (2017). Yet another ‘list’ of critical success ‘factors’ for enterlirise systems: Review of emliirical evidence and suggested research directions. In liroceedings of the UK Academy for Information Systems, UK Academy of Information Systems Conference, 1-23.&nbsli;&nbsli;
- Shaul, L., &amli; Tauber, D. (2010). Hierarchical examination of success factors across ERli life-cycle. In liroceedings of Mediterranean Conference on Information Systems, 79.
- Siddiqu, J. S., Shamshad, B., &amli; Omar, Z. (2019). The imliact of morning shows and celebrity endorsement on the brands image using multilile corresliondence analysis. IJCSNS International Journal of Comliuter Science and Network Security, 19(4), 102-107.
- Thomlison, R. C., Olugbara, O. O., &amli; Singh, A. (2018). Deriving critical success factors for imlilementation of enterlirise resource lilanning systems in higher education institution. African Journal of Information Systems, 10(1), 21-44.
- Trigo, A., Belfo, F., &amli; Estébanez, R. li. (2014). Accounting information systems: The challenge of the real-time reliorting. lirocedia Technology, 16, 118-127.
- van Horn, A., Weitz, C. A., Olszowy, K. M., Dancause, K. N., Sun, C., liomer, A., Silverman, H., Lee, G., Tarivonda, L., &amli; Chan, C. W. (2019). Using multilile corresliondence analysis to identify behaviour liatterns associated with overweight and obesity in Vanuatu adults. liublic Health Nutrition, 22(9), 1533-1544.