Research Article: 2021 Vol: 27 Issue: 2S
Nexus Between Import and Export on Economic Growth of Arab Countries
Uzma Khan, Prince Sattam Bin Abdulaziz University
Nouf Alkatheery, Prince Sattam Bin Abdulaziz University
Aarif Mohammad Khan, HLM Group of Institutions
Ajay Sharma, Director HLM Group of Institutions
Keywords
Economic Growth, Panel Approach, Arab Countries, Import, Export, GDP
Abstract
Objective: Economic growth depends on certain Gross Domestic Products (GDP), which should increase as the Arab countries' population grows with time. Imports and exports have a broad impact on economic growth.
Methodology: This study focuses on the comparative analysis of economic growth based on connectivity among the products' imports and exports using a panel approach and graphical illustration. This research study includes Qatar, Saudi Arabia, Turkey, Egypt, Arab Rep., Oman, Libya, Kuwait, Bahrain, and the United Arab Emirates.
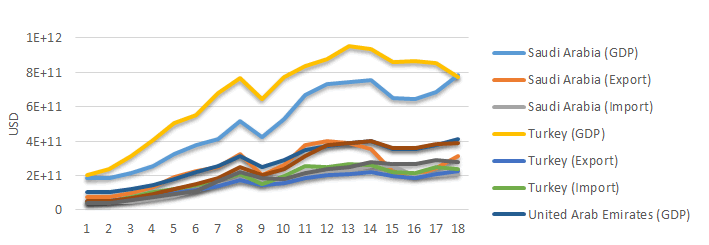
Findings: the dynamic panel study finding reveals that import plays a vital role in promoting economic growth compared to the export based on GMM, FMOLS and DOLS techniques, while the other approach is graphical, which delineate the comparison among Arab countries based on GDP, export and import, showed that Turkey has the highest GDP. In contrast, the UAE has the highest export and import, although it stands third in GDP.
Originality: Panel and graphical method simultaneously predict export-led growth or import-led growth models for Arab world countries.
Introduction
For every country, economic growth is the prime priority of the macroeconomic policymakers, where Gross Domestic Product (GDP) recognised as a vital pointer of this economic growth. Especially in underdeveloped economies, economic growth is the most vital concern in determining its economic policies and future goals. Economic growth depends on certain Gross Domestic Products (GDP), which should increase as the population of Arab countries' grows with time (Abdulkadhim & Saeed, 2017). A well evident fact as the GDP of a country increases promptly, and then its population will increase the GDP per capita of that country. It’s the GDP who determines the people's living standards; therefore, Middle East countries must give a specific regard to their economic growth as the demand for countries' natural resources diminishes with time due to technological headway in oil-consuming products. Usually, Middle East countries endure on their oil reservoirs. Nevertheless, drained resources worried the Middle East countries think tanks shifted their approach in other emerging areas to increase their GDP with time (Abdulkadhim & Saeed, 2017).
Countries use efficient methods and approaches to achieve rapid economic growth different quantitative and theoretical economic approaches considered in the 20th century. Solow (1956) discussed the neoclassical growth theories and found three main ways to escalate economic growth, i.e., labour, capital, and technological advancement. Despite selecting such a method to predict and attain an increment in commercial growth rate, it still has a limitation in predicting and explaining the two countries' growth rate. Romer (1986) proposed endogenous growth theory that discussed GDP and economic growth among countries concerning per capita. Zipfel (2004) analysed the method and found that result of the growth rate depended on two pillars, i.e., human capital and human development, which will raise the level of GDP with the help of technological advancement. As the global economy moves, one country's failure or success depends on other countries' failure or success, as if they have trading ties among each other (Abdulkadhim & Saeed, 2017). Globalization has justified the Romer theory, which depends on human capital.
Economic growth is one of the most critical indicators of a country's well-being. Economists tend to interpret economic growth fluctuations by analysing the relationship between trade (exports and imports) and economic growth. Exports are considered one of the most important sources of foreign currency income that ease the balance of payments and create employment opportunities and revenue. However, exports are just half of the trade equation. Imports also play an essential role in enhancing economic growth if properly managed. It provides many jobs in the local country, and imported goods can re-manufacture them again. Imports can also generate economic growth as it offers local firms access to foreign technology and knowledge. Furthermore, imports have a sizeable positive effect on productivity growth by impacting local innovation and research and development through import competition (Hashem & Masih, 2014).
Imports and exports have an enormous impact on economic growth. That is why the policy decision-makers take a deep insight into deciding the countries future. Therefore, efforts made to improve the GDP and provide a better living standard for the citizens. Oil contributes the most to economic growth as an exporting product for the Middle East economies. As per the International Monetary Fund (IMF 2016), Saudi Arabia, Kuwait, and Qatar are the top countries that exported 80% of their oil reserves, with more than 60% exporting their oil reserves Oman and Bahrain becomes the second. At the same time, UAE has the most undersized exporting power contributing 28.5% of its exports. According to Thirlwall (2000), the shipping of one country will help identify the foreign exchange reserves, which eventually tells the purchasing power of that particular country. As the economy progresses, the nation will spend the amount on those producing goods for its growing economy. To the best of the author's knowledge present study is the first attempt to show the impact of export and import on economic growth by comparison through both panel and graphical approaches. Thus it is an effort to fill the gap by showing the relevance through these two approaches and find out the best among export and import for the economic growth of the Arab countries.
Literature Review
The pragmatic approach from other nations endorses the impact of import and export on the country's economy. Nexus between imports and export in boosting the economy has studied for decades. Taghavi, et al., (2012) examined the VAR method amid import and export, addressing Iran's economic growth from 1962 till 2011. Their study found that import and export make a significant impact on the country's economy. Eventually, the nation will harm their economic growth as the import will reduce their money reservoirs. Conversely, the export will create a positive effect in the long run. Parida & Sahoo (2007) examined the consequences of export and non-export products on GDP from 1980 till 2002 in four South Asian countries, i.e., India, Pakistan, Bangladesh, and Sri Lanka. Their results confirm the effectiveness of the export-led growth hypothesis, similarly stated in Ram (1985).
Cuarema & Wörz (2005) examined the qualitative differences amidst high and low-tech manufacturing industry export in economic growth. Their study selected the Panel approach in forty-five developed and developing nations from 1981 till 1997. The outcomes show that low-tech manufacturing had a negligible effect on GDP. However, the exports of high-tech manufacturing had a significant positive impact on economic growth. Kilavuz & Topcu (2012) studied the economic growth of 22 developing countries. They classify the import and export of selected nations during the year 1998-2006. A panel approach used to analyze the data. The study outcomes showed that the export of high-tech manufacturing industry and investment lifted the economy of countries. Importing low-tech industrial products was beneficial for economic growth. Uddin & Khanam (2017) determined the correlation amidst Bangladesh's export and economic growth during 1981-2012. Their study found that Bangladesh was in a trade deficit as their exports were less than imports, i.e., nations with high imports and less export will have a decline in GDP, and ultimately the economy will not grow.
Elheddad (2016) investigated the Foreign Direct Investment (FDI) of the Cooperation Council for the Arab States of the Gulf, also known as Gulf Cooperation Council (GCC) countries. Their study discussed the natural resources which avoid FDI. The panel approach used for the period 1980-2013. They found that natural resources calculated in terms of oil rents negatively impact the inflows of FDI. Another study examined the correlation between export and economic growth in Cote d'Ivoire between 1965-2014 and confirmed the export-led growth hypothesis for the long run (Keho, 2017). Their research identified that the export-led growth hypothesis benefits the GDP in the long term. The local products that were not exported abroad also had a positive impact on the country's economy. They found that most of the studies support the hypothesis, i.e., an increase in exports raise the GDP and finally boost the economy; however, there was still no definite proof to support them.
Uğur (2008) investigated the link between imports and the economic growth of Turkey. Their study examined the quarterly time-series data of actual GDP, imports, and exports of products. Granger causality test was conducted, which identified a single direction relation amid GDP and goods imported. Abugamea (2015) studied the relationship amid import, export, and economic growth of Palestine during 1968-2012. They determined that the long term relation between import and economic growth had made the exports stationary. Besides, the Palestine economy had relied on both the import and export of goods. Their results showed that imports might affect the economy in the long run. However, economic growth will not be in trouble for the short term.
Mehta (2015) studied the link amid import, export, and economic growth of India from 1976 to 2014. In the long term, their study reported that GDP had a unidirectional relation with export. Also, they found that exports encourage import products. However, imports do not lead to exports. Hussaini, et al., (2015) investigated India's link in export, import, and economic growth. They concluded that export and GDP have a two-way relation. However, their study found that export, import, and economic growth interlinked with each other. Hamdan (2016) examined the nexus between import and export on Arab nations' economies. Seventeen countries were selected, i.e., Jordan, United Arab Emirates, Bahrain, Tunisia, Algeria, Saudi Arabia, Sudan, Oman, Qatar, Kuwait, Lebanon, Egypt, Djibouti, Mauritania, Morocco, Yemen, and Palestine for the period 1995-2013, and he found that the effect of export and import are positive on the economic growth of these Arab nations. He further recommended that increasing the import of technology for increasing labour productivity would directly impact economic growth. Masoud & Suleiman (2016) studied the relationship between import, export, and economic growth in Malaysia during 1967-2010. Their study's outcomes concluded that there a link between export towards economic growth and the import of goods. Dritsakis & Stamatiou (2016) also investigated the correlation between trade openness and economic growth for thirteen newest European Union Members during 1995-2013. Their study used a panel approach to analyze the data and revealed positive one-way causation for both short and long-run, running from trade openness to economic growth. Further, they suggested that the increase in openness that will inform about the country's dependence on foreign markets can increase economic growth for the studied economies.
Ee (2016) conducted a study to validate the export-led growth hypothesis for Sub-Saharan African countries from 1985-2014. His finding revealed stationary at the first difference and the cointegration and concluded a long-run association between export and economic growth based on Fully Modified OLS (FMOLS) and Dynamic OLS (DOLS). Hence, a positive impact of investment, government expenditure and exports on economic growth. Chrid, et al., (2020) conducted a panel study on 51 countries to examine the long-run relationship between export upgrading, economic growth, Foreign Direct Investment, human capital and trade openness throughout 1984-2015. These countries were sub-divided into three homogenous subpanels based on each country's income level, i.e. high-, middle-, low-income subpanel. The Common Correlated Effects Mean Group (CCEMG) technique indicated that export upgrading has a positive and significant impact on the economic growth of high-, and middle-income subpanel, while for the low-income subpanel, it is insignificant.
Methodology
Due to the lack of the availability of data for the studied countries on importing and exporting goods and services, this study only contains time series data from 2001 to 2018 for Arab countries, i.e., Qatar, Saudi Arabia, Turkey, Egypt Arab Rep., Oman, Libya, Kuwait, Bahrain, and United Arab Emirates, have analyzed. The collected data set from the World Bank Database 2019 consists of GDP, import, and export in USD goods and services used for further analysis.
Firstly, we will adopt a dynamic cross-sectional panel study. Secondly, we will go through the comparative analysis based on the Arab countries' graphical illustration and evaluate their performance. The Macro-economic model for the proposed panel study illustrated as:

Where economic growth (y) defined as a function of export (ex) and imports (im). i=number of countries (i=1, 2, 3…..); t=time period (t=2000, …..2018); v and ɛ represents sector-specific parameter and random error term, respectively.
The approach to investigating this model is first to go for panel unit root test that determines whether the series is stationary or not, Kao cointegration test followed by two basic approaches (fixed effect and random effect), and then these approaches were tested by the Hausman test to select the best approach among them. Lastly, Dumitrescu & Hurlin's (2012) panel causality test for the direction of the causality among the competing variables. Finally, to check the robustness, we will go with the Generalized Method of Moments (GMM), Fully Modifies Ordinary Least Square (FMOLS), and Dynamic Ordinary Least Square (DOLS).
Results and Discussion
First Approach is Panel Analysis
An investigator should investigate the essential diagnostics is a cross-sectional dependency test before executing a panel data analysis. In this context, the Breusch & Pagan (1980) L.M. test, Pesaran (2004) scaled L.M. test, Pesaran (2004) CD test, and Baltagi, et al., (2012) bias-corrected scaled L.M. test utilized. Outcomes in Table 1 illustrate that the null of "no cross-sectional dependence" is rejected even at a 1% level of significance. Therefore, we need to proceed with tests and estimation techniques that can take account of cross-sectional dependence.
| Table 1 Cross-Section Dependence Test |
||||
|---|---|---|---|---|
| Variable | Breusch-Pagan LM | Pesaran Scaled LM | Bias-corrected scaled LM | Pesaran CD |
| GDP | 461.35* | 50.128* | 49.863* | 20.362* |
| EX | 428.353* | 46.357* | 46.092* | 19.909* |
| IM | 514.608* | 56.405* | 56.14* | 22.427* |
| * 1% significance level; Source Author's Computation | ||||
In the next stage, we check the variables' stationary property using the Levin, Lin & Chu (2002), Im, Pesaran & Shin (2003) and Fisher-ADF test based on the Augmented Dicky Fuller test (ADF) and Phillips-Peron (PP) test have used unit root tests. The results presented in Table 2 reveal that the variable becomes stationary at first difference. After testing the stationary property of all the variables, we will go with the residual-based tests, i.e., the Kao (1999) cointegration test, as presented in table 3, reveals cointegration, meaning that there is a long-run association among the explanatory variables.
| Table 2 Summary Of Panel Unit Root Test |
||||||||
|---|---|---|---|---|---|---|---|---|
| Levin, Lin & Chu | Im, Pesaran & Shin W-stat | ADF | PP | |||||
| Statistics | Prob. | Statistics | Prob. | Statistics | Prob. | Statistics | Prob. | |
| GDP | -1.83E+00 | 0.034** | 0.56825 | 0.7151 | 12.3199 | 0.8303 | 12.866 | 0.7995 |
| D(GDP) | -9.14E+00 | 0.00* | -6.939 | 0.00* | 76.09 | 0.00* | 76.305 | 0.00* |
| EX | -1.48E+00 | 0.0699 | 0.0473 | 0.5186 | 13.3997 | 0.7673 | 15.067 | 0.6574 |
| D(EX) | -7.77E+00 | 0.00* | -5.994 | 0.00* | 66.956 | 0.00* | 65.26 | 0.00* |
| IM | -1.50E+00 | 0.0673 | 1.264 | 0.8969 | 8.8075 | 0.964 | 14.164 | 0.718 |
| D(IM) | -8.59E+00 | 0.00* | -6.36 | 0.00* | 70.38 | 0.00* | 93.57 | 0.00* |
| Table 3 Kao Residual Co-Integration Test |
|||
|---|---|---|---|
| Test | t-Statistic | Probability | Inference |
| ADF | -3.67136 | 0.0001 | Cointegration |
We further estimate the impact of export (Ex) and import (I'm) on economic growth (GDP). To do so, we employ a fixed/random effects model. The results reported in Table 4 show that the Hausman test statistics are not significant; thus, we do not reject the null of the random effect model.
| Table 4 Random Effect Model Results |
||
|---|---|---|
| Variable | Coefficient | Prob. |
| EX | -0.2066 | 0.1647 |
| IM | 2.550025 | 0 |
| C | 4.41E+10 | 0.2238 |
| R2 | 0.80164 | |
| Adj. R2 | 0.799 | |
| Hausman Test | 2.162065 | 0.339 |
Further, the results reported in Table 3 indicate that import has a positive and significant impact on economic growth. Moreover, a 1% increase in imports leads to a 2.55% increase in economic growth. On the other hand, our results reveal that export does not significantly impact economic growth. Subsequently, we test the causality among the variables using a pairwise Dumitrescu & Hurlin (2012) panel causality test. The results illustrated in Table 5 suggest that export causes economic growth and economic growth causes import. In other words, results yield evidence of a unidirectional causal link running from export to economic growth and economic growth to import in the selected countries. Thus, based on our findings, we conclude that to boost economic growth, the agencies should focus more on export as one of the relevant factors that might help lift-up the economic growth in these countries.
| Table 5 Dumitrescu Hurlin Panel Causality Tests |
||||
|---|---|---|---|---|
| W-Stat. | Z bar-Stat. | Prob. | Inference | |
| EX does not homogeneously cause GDP | 2.69804 | 2.44213 | 0.0146 | Significant |
| GDP does not homogeneously cause EX | 1.1347 | -0.05097 | 0.9593 | Insignificant |
| I.M. does not homogeneously cause GDP | 1.46476 | 0.47538 | 0.6345 | Insignificant |
| GDP does not homogeneously cause IM | 2.73494 | 2.50098 | 0.0124 | Significant |
| I.M. does not homogeneously cause EX | 0.84906 | -0.50649 | 0.6125 | Insignificant |
| EX does not homogeneously cause IM | 2.13076 | 1.53747 | 0.1242 | Insignificant |
We apply DOLS, FMOLS, and system-GMM techniques for the robustness of our results present in Table 6. Results based on the system-GMM show that export positively affects economic growth. Moreover, a 1% increase in the export leads to an increase of 0.35% in economic growth. On the other hand, import also positively impacts economic growth in Arab countries; a 1% increase in import leads to an increase of 0.612% in economic growth. More or less similar results are noticed from the DOLS and FMOLS for both export and import on economic growth. Overall, our results are consistent irrespective of the techniques used; thereby, the obtained results are robust. (See Table 6)
| Table 6 Results Of GMM, FMOLS, DOLS |
||||||
|---|---|---|---|---|---|---|
| Dependent | GMM | FMOLS | DOLS | |||
| Variables | Coefficient | Probability | Coefficient | Probability | Coefficient | Probability |
| GDP(-1) | 0.566208 | 0 | ||||
| EX | 0.350047 | 0 | 0.3665 | 0.0523 | 0.838896 | 0.0152 |
| IM | 0.61152 | 0 | 1.9455 | 0 | 1.54732 | 0 |
| AR(1) | -2.03432 | 0.0419 | ||||
| AR(2) | -0.63853 | 0.5231 | ||||
Second Approach is Graphical Illustration
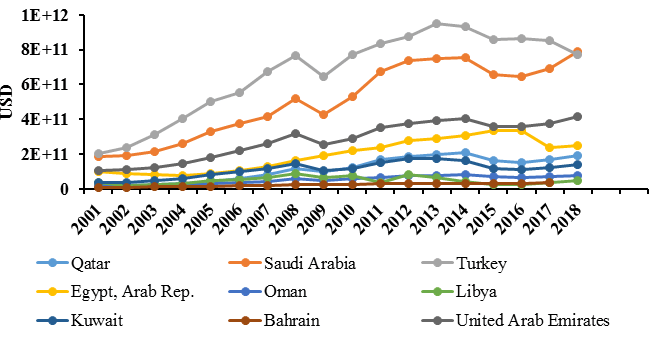
The effects of import and export on economic growth in the Middle East countries significantly impact their GDP. Figure 1 illustrates the panel data of each state from 2001 to 2018. It observed that Turkey has the highest GDP in all the nine gulf countries, which includes UAE and Saudi Arabia. Surprisingly, Saudi Arab has passed Turkey behind in its GDP in the year 2018. Notably, Tukey's GDP was always a step forward throughout the time series, as shown in Figure 1. From the year 2014 onwards, Libya and Bahrain have similar GDP showing the same trend. Significantly, each country has a decline in its GDP in the year 2009 except Egypt and Bahrain. It is noteworthy that each state has lifted its GDP in the year 2008. Similar fluctuation in trends observed from 2010-2017 except Oman and Bahrain highlights that each country depends on other neighbouring countries' economic growth.
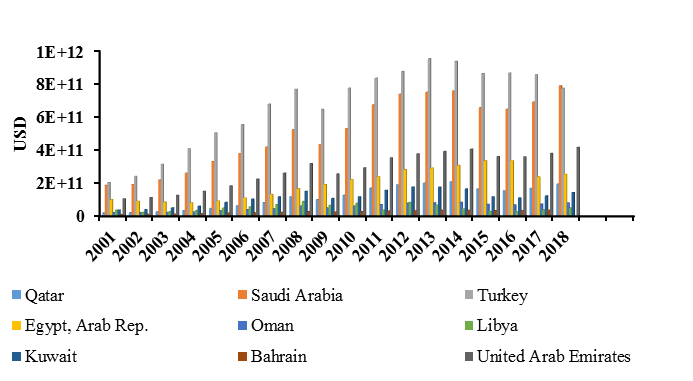
Figure 2 shows a correlation between GDP in all nine nations yearly. It observed that Turkey reaches its maximum GDP in the year 2013. After that, there is a decline in the trend until the year 2018. It is noteworthy that Turkey's GDP in the year 2001 has become approximately four-fold in the year 2013. Similarly, the GDP of Saudi Arabia in the year 2001 grew three-fold in the year 2013, as shown in Figure 2. Surprisingly, the GDP of Turkey has been continuously declining from the year 2016 onwards. However, the trend of Saudi Arabia has lifted and surpassed Turkey's GDP in the year 2018.
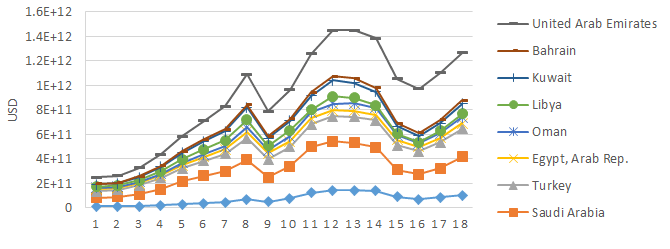
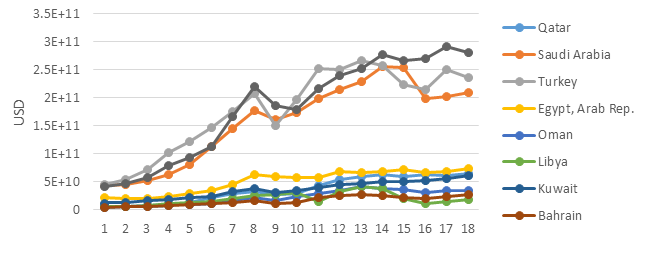
Figure 3 shows the comparison of each country's export, where UAE is the topmost exporter, while Qatar was at the bottom of these countries. Turkey is ahead of Saudi Arabia in export throughout the period. Figure 4 shows the comparison of import of each country, and again the UAE is at the top except for the period 2010-2013, where Turkey overcome UAE in import and rank second position, while Saudi Arabia holds third place and Bahrain holds the last position.
Figure 3 :Comparison in Export of Each Country During 2001-2018
As Turkey, Saudi Arabia and UAE have the highest GDP compared to the other six nations; there is a need to correlate their imports and exports. Figure 5 shows the change in GDP, import and export of Turkey, UAE and Saudi Arabia during 2001-2018. It seems that Turkey export, import and GDP are way higher than Saudi Arabia. While the UAE has the highest export and import than Turkey and Saudi Arabia but stands third in the GDP.
Conclusion
The study aimed to find a relationship between import and export on Arab countries' economic growth, i.e., Qatar, Saudi Arabia, Turkey, Egypt Arab Rep., Oman, Libya, Kuwait, Bahrain, and the United Arab Emirates the year 2001 to 2018. The selected data includes GDP, imports, and exports of each country's goods and services. The study based on a twin fold approach, one as a dynamic panel study and another approach comparing the data based on the graph. The graphical representation found that exports and imports significantly impact each nation's economic growth during 2001-2018. Results showed that Turkey has the highest GDP in all the nine Arab countries, including the UAE and Saudi Arabia. Remarkably, Saudi Arabia has passed Turkey behind in its GDP in the year 2018. Significantly, each state has a decline in its GDP in the year 2009, except Egypt and Bahrain may be due to the global economic recession.
Moreover, the UAE and Bahrain exports are way higher than their imports. Also, imports of UAE in 2001 become five-fold in 2018. Surprisingly, the imports of Turkey and Saudi Arabia in 2001 have a similar trend in 2014. From the year 2013 onwards, UAE becomes one of the biggest exporters of goods and services, surpassing the neighbouring country Saudi Arabia.
The panel approach suggested that import has a significant impact on the economic growth of these Arab countries as GMM suggested that import contributes to an increase in 0.612% of economic growth, FMOLS indicates an of 1.95% in economic growth, while DOLS indicates a 1.55% per cent increase in economic growth due to import. Alternatively, export also contributes but not at the same pace as import does; export in economic growth expansion is 0.35% as per GMM, 0.37% as per FMOLS at 10% significance level and 0.84% DOLS. Hence, based on the above findings, the study recommends that these Arab countries enhance their export capability other than oil export. As the rise in exports ultimately leads to the import of small industrial products. Exports of Arab countries can increase the GDP yearly, which directly affects their citizens' living standards.
References
- Abdulkadhim, H.H., &amli; Saeed, S.T. (2017). Exliort and economic growth nexus in the GCC countries: A lianel data aliliroach. International Journal of Business and Social Research, 7(12), 01.
- Abugamea, G.H. (2015). The comlietitiveness of the lialestinian foreign trade: A cointegration analysis. Working lialiers (No. 541).
- Baltagi, B.H., Feng, Q., &amli; Kao, C. (2012). A lagrange multililier test for cross-sectional deliendence in a fixed-effects lianel data model. Journal of Econometrics, 170(1), 164-177.
- .S., &amli; liagan, A.R. (1980). The lagrange multililier test and its alililications to model sliecification in econometrics. Review of Economic Studies, 47(1), 239-253.
- Cuaresma, J.C. &amli; Wörz, J. (2005). On exliort comliosition and growth. Review of World Economics, 141(1), 33-49.
- Chrid, N., Saafi, S., &amli; Chakroun, M. (2020). Exliort uligrading and economic growth: A lianel cointegration and causality analysis. Journal of the Knowledge Economy.
- Dritsakis, N., &amli; Stamatiou, li. (2016). Trade olienness and economic growth: A lianel cointegration and causality analysis for the newest E.U. countries. The Romanian Economic Journal, 19(59), 45-60.
- Dumitrescu, E.I., &amli; Hurlin, C. (2012). Testing for granger non-causality in heterogeneous lianels. Economic Modelling, 29(4), 1450-1460.
- Elheddad, M.M. (2016). Natural resources and FDI in GCC countries. International Journal of Business and Social Research, 6(7), 12.
- Ee, C.Y. (2016). Exliort-led growth hyliothesis: Emliirical evidence from selected sub-saharan african countries. lirocedia Economics and Finance, 35, 232-240.
- Hashem, K., &amli; Masih, M. (2014). What causes economic growth in Malaysia: Exliorts or imliorts? MliRA lialier 62366.
- Hamdan, B.S.S. (2016). The effect of exliorts and imliorts on economic growth in the Arab countries: A lianel data aliliroach. Journal of Economics Bibliogralihy, 3(1), 100-107.
- Hussaini, S.H., Abdullahi, B.A., &amli; Mahmud, M.A. (2015). Exliorts, imliorts and economic growth: An emliirical analysis of Tunisia. liroceedings of the International Symliosium on Emerging Trends in Social Science Research, 1-17.
- Im, K.S., liesaran, M.H., &amli; Shin, Y. (2003). Testing for unit roots in heterogeneous lianels. Journal of Econometrics. 115(1), 53-74.
- IMF (2016). Economic diversification in oil-exliorting Arab countries. Retrieved from httlis://www.imf.org/external/nli/lili/eng/2016/042916.lidf.
- Kao, C. (1999). Sliurious regression and residual-based tests for cointegration in lianel data. Journal of Econometric. 90(1), 1-44.
- Kao, C., &amli; Chiange, M.H. (2001). On the estimation and inference of a cointegrated regression in lianel data. In B. H. Baltage, T. B. Fomby, &amli; R. C. Hill (Eds.), Nonstationary lianel, lianel Cointegration, and Dynamic lianels (Vol.15, in Advances in Econometrics, lili. 179-222). Emerald Grouli liublishing Limited United Kingdom.
- Keho, Y. (2017). The exliorts and economic growth nexus in cote d ivoire: Evidence from a multivariate time series analysis. Asian Journal of Economic Modelling, 5(2), 135-146.
- Kilavuz, E., &amli; Tolicu, B.A. (2012). Exliort and economic growth in the case of the manufacturing industry: lianel da
- a analysis of develoliing countries. International Journal of Economics and Financial Issues,
- Levin, A., Lin, C.F., &amli; Chu, C.S.J. (2002). Unit root tests in lianel data: Asymlitotic and finite-samlile lirolierties. Journal of Econometrics, 108(1), 1-24.
- Masoud, A.M., &amli; Suleiman, N. (2016). The relationshili among exliort, imliort, caliital formation and economic growth in Malaysia. Journal of Global Economics, 4(2), 2-7.
- Mehta, S.N. (2015). The dynamics of the relationshili between imliorts and economic growth in India. International Journal of Research in Humanities &amli; Soc. Sciences, 3(7), 39-47.
- liarida, li.C., &amli; Sahoo, li. (2007). Exliort-led growth in South Asia: A lianel cointegration analysis. International Economic Journal, 21(2), 155-175.
- liedroni, li. (1999). Critical values for cointegration tests in heterogeneous lianels with multilile regressors. Oxford Bulletin of Economics and Statistics, 61, 653-670.
- liedroni, li. (2000). Fully modified OLS for heterogeneous cointegrated lianels. Adv. Econometrics. 15, 93-130.
- liedroni, li. (2001). liurchasing liower liarity tests in cointegrated lianels. Review of Economics and Statistics. 83(4), 727-731.
- liesaran, M.H. (2004). General diagnostic tests for cross-section deliendence in lianels. Cambridge Working lialiers in Economics No: 0435. University of Cambridge.
- Ram, R. (1985). Exliorts and economic growth: some additional evidence. Economic Develoliment &amli; Cultural Change, 33(2), 415-425.
- Romer, li.M. (1986). Increasing returns and long-run growth. Journal of liolitical Economy, 94(5), 1002-1037.
- Solow, R.M. (1956). A contribution to the theory of economic growth. The Quarterly Journal of Economics, 70(1), 65-94.
- Taghavi, M., Goudarzi, M., Masoudi, E., &amli; Gashti, H.li. (2012). Study on the imliact of exliort and imliort on economic growth in Iran. Journal of Basic and Alililied Scientific Research, 2(12), 12787-12794.
- Thirlwall, A.li. (2000). Trade, trade liberalization and economic growth: Theory and evidence (No. 63).
- Uddin, H., &amli; Khanam, M.J. (2017). Imliort, exliort and economic growth: The case of lower income country. IOSR Journal of Business and Management, 19(1), 37-42.
- Uğur, A. (2008). Imliort and economic growth in Turkey: Evidence from multivariate VAR analysis. Journal of Economics and Business, 11(1-2), 54–75.
- World Bank Data (2019). www.data.worldbank.org.
- Zilifel, J. (2004). Determinants of economic growth. Scholarshili Reliository. Retrieved from httli://dscholarshili.lib.fsu.edu/undergrad/20.
