Research Article: 2022 Vol: 26 Issue: 2S
Operational velocity, utilization of resources and profitability: A mutual study of leading Indian automobile corporations
Anis Ali, Prince Sattam bin Abdulaziz University
Citation Information: Ali, A. (2022). Operational velocity, utilization of resources and profitability: A mutual study of leading Indian automobile corporations. Accounting and Financial Studies Journal, 26(S2), 1-15.
Abstract
Profitability of the business organization refers to the financial performance and indicates the profit earning capacity of the business organization. The profitability of the business organization is either enhanced by the lowering of the direct costs of the products or the accelerating the frequency of the production to minimize the indirect costs or time costs. The direct cost of the products can be minimized up to a certain limit after that operational velocity governs the time cost of the product. The velocity of the utilization of the resources enhances the level of production and absolute profit of the business entity, ultimately. The Indian automobile sector is the most prominent and contributing sector in the Indian economy. There are significant differences in the operational velocity, utilization of resources velocity, and profitability of the leading Indian automobile corporations. The Indian automobile corporations of smaller size have better earning capacity than the bigger Indian automobile corporations. Operational velocity governs profitability strongly than the velocity of the resources’ utilization. The Indian automobile corporations need to focus on operational velocity and utilization of resources to improve profitability and enhance absolute profit.
Keywords
Operational Velocity, Utilization of Resources, Indian Automobile Corporations, Ratio Analysis, ANOVA, Variability
Introduction
Profitability refers to the profit-earning ability of the business and governed by various internal and external factors. The external factors are unpredictable, uncontrollable, and affect the profit and profitability from outside. Nowadays, every business organization is expected to enhance its profit and profitability. The internal factors that affect the profitability can be considered to enhance the profit earning ability of the business organization. Operational velocity indicates the frequency of the manufacturing efficiency while the utilization of the resources refers to the utilization frequency of the total investment of the business organization. A combined analysis or study of the rapidity of the business activities and utilization of the resources of the organization reveals the impact on profitability or profit. The comparative analysis of the velocity of operational activities and utilization of resources of the business organization of a specific sector reveals the negativity of the weakest aspects of the business organization. The identification of the weakest aspects of a business organization lowers the profitability and profit, ultimately. In the Indian economy, the automobile sector is one of the prominent sectors that contribute positively and progressively. In the Indian automobile sector, it is evident that the profit and profitability of the corporations are different historically. This attracts me to know the internal factors of difference in profit and profitability as the external factors are unpredictable and uncontrollable. Velocity in the operational activities minimizes the indirect cost per unit and enhances the profitability and increases the amount of absolute profit. Velocity in utilization in resources enhances the overall level of the operational activities and provides the leverage for the velocity of the operational activities. So, the operational velocity enhances the profitability and absolute profit while the utilization of resources defines the overall level of business activities and enhances the absolute profit.
Review of Literature
Jamali & Asadi (2012) investigated a progressive co-movement between managerial competence and profitability. Indirectly, they indicated operational velocity to govern the profitability of the business organization. Ashraf (2012); Gopalakrishnan (2014) investigated the negativity between working capital and profitability. Suresh & Sengottaiyan (2015) found the hybrid association between the capital structure and profit earning capacity in Indian automobile corporations. Kumar & Kaur (2016) witnessed the positive and negative relationship between the size of total resources and profitability. Kaur & Kaur (2016) found that the manufacturing velocity and liquidity and growth of the firm govern the profitability in the Indian automobile sector. Jaisinghani & Tandon (2016) studies 105 Indian automobile corporations and found a U-shaped relationship between investment in research and development and suggested an optimal investment in the research and development activities. Paliwal & Chouhan (2017); Shajar (2017) observed a positive movement of liquidity and profitability, and the effect of cash conversion period and working capital on the profitability of Indian automobile corporations. Ranjithkumar & Eahambaram (2018) observed that the profit capability of the Indian automobile corporations is directed by the operational activities, firm’s growth, and liquidity. Hassan & Shrivastava (2019) found the positivity between the working capital and profitability of Indian automobile corporations. Tripathi & Talukder (2020) found a strong relationship between the supply chain performance and profitability and observed that the negativity of the supply chain performance is more negative than the utilization of resources and operational efficiency. Attari & Raza (2012) advocated that the cash conversion cycle negatively governs the profitability of Indian automobile corporations. Paliwal & Chouhan (2017) investigated a progressive association between liquidity and profitability and advocated the trade-off between profitability and liquidity. The absolute financial performance of the Indian automobile corporations is different. The relative analysis measures the ability of the financial performance. The turnover ratio refers to the operational velocity or utilization of the resources and governs the absolute and relative profitability of the corporations. So, there is a need to know the similarity or dissimilarity among the various measurements of the profitability and business activities velocity, and utilization of resources. Also, the governance relationship of profitability by the operational velocity and the utilization of the resources. So, the following proposed research framework is applied to investigate and establish the relationship or governance of the financial performance by the inventory (operational velocity) and assets (utilization of resources velocity) turnover ratio.

Figure 1: Proposed Research Model to Assess the Impact of Operational Velocity and Utilization of Resources on Financial Performance
Hypothesis:
H01: There are no significant differences among the relative inventory turnover of the Indian Automobile corporations.
H02: There are no significant differences among the relative assets turnover of the Indian Automobile corporations.
H03: There are no significant differences among the relative manufacturing cost efficiencies of the Indian Automobile corporations.
H04: There are no significant differences among the relative net profit earning capacity of the Indian Automobile corporations.
H05: There are no significant differences among the relative return on capital employed (ROCE) of the Indian Automobile corporations.
H06: There are no significant differences among the relative return on assets (ROA) of the Indian Automobile corporations.
H07: The profitability of the leading Indian corporations is strongly and positively governed by the operational velocity.
H08: The profitability of the leading Indian corporations is strongly and positively governed by the velocity of utilization of resources.
Research Methodology
The study is originally based on the secondary data extracted from the websites of the leading Indian automobiles corporations. In Indian automobile sector, Tata (Tata Motors Ltd.), M &ML (Mahindra & Mahindra Ltd.), TVS (TVS Motor Company Ltd.), Hero (Hero Motocorp Ltd.), MSIL (Maruti Suzuki India Ltd.), Bajaj (Bajaj Auto Ltd.), Ashok (Ashok Leyland Ltd.), and Eicher (Ecicher Motors Ltd.) corporations are the leading automobile corporations and selected for the study. Financial ratios are the base of the study calculated from the Income statements and Balance -sheets of leading Indian automobile corporations available on the websites:
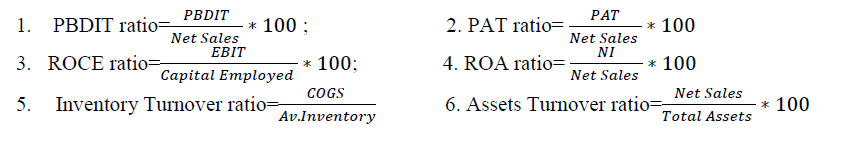
Where, PBDIT=Profit Before Depreciation, Interest and Tax; PAT=Profit After Tax; ROCE=Return On Capital Employed; EBIT=Earnings Before Interest and Tax; ROA=Return On Assets; NI=Net Income;
PBDIT ratio, PAT ratio measures the manufacturing cost efficiencies, net profit earning capacity while ROCE ratio and ROA ratio measures return on capital employed in the operation activities and return total resources invested in the business organization. Turnover ratio measures the velocity i.e., Inventory turnover ratio measures the operational velocity and assets turnover ratio measures the velocity of the utilization of the resources. Coefficient of Variation (CV) calculated to get the normality of the variability of the profitability and turnover ratios.
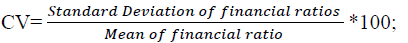
Where, CV<0.10 is very good, 0.10-0.20 is good, 0.20-0.30 is acceptable, and CV>0.30 is not acceptable.
To know the significant difference among profitability and turnover ratios of leading Indian automobile corporations, Fisher’s ratio (F) is calculated and compared with the critical value (F∝) (Ali, 2020a).
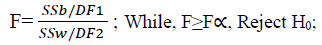
Where, F is Fisher’s ratio, and SSb, SSw, are sum of squares between samples, sum of squares within samples, while DF1, DF2 is degree of freedom 1 and degree of freedom 2, respectively. The df1, df2 calculated:
DF1=K-1, and DF2=N-K; Where, K=Number of Samples (corporations), and N=Number of all variables (particular ratio of all corporations for the years under consideration).
To know the governance direction and degree of profitability by the operational activities and resource utilization velocity, Karl Pearson’s correlation coefficient (r) between the Inventory turnover ratio, Assets Turnover ratio and profitability ratio calculated:
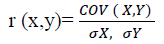
Where, X and Y are the variables (financial ratio), COV(x,y) is the covariance between x and y, σx and σy is the standard deviation of x and y variables (Ali, 2021).
Data Analysis and Interpretaion
Normality of Variability and Average of Variables of Profitability and Velocity of Operational Activities, Utilization of Resources
The normality of variability of data reveals that the values or variables are not affected by the abnormal factors. The insignificant fluctuations of variables or normality of variables are the proof of the non-occurrence of abnormal factors that may affect the symmetry of data of a particular period. The normality of variability makes data comparable within the groups. The average of variables for a particular period reveals the tendency and helps in assigning the ranks to measure the performance, mutually.
Normality of Variability and Average of the Turnover and Profitability Ratios
The normality of variability and average of variables of turnover and profitability ratio measures normality and central tendency in operational activities, utilization of resources, and profitability variables and makes the data comparable.
Normality of Variability and Average of Inventory Turnover Ratios
The normality of the variability and average Inventory turnover ratios explain the fluctuations of operational velocity and an average of operational velocity. Following are the normality and average inventory turnover ratios of leading Indian automobile corporations.
| Table 1 Inventory Turnover Ratios of Leading Automobile Corporations of India |
|||||||||
|---|---|---|---|---|---|---|---|---|---|
| Years | Tata | MSIL | M&M L | Hero | Bajaj | Ashok | TVS | Eicher | Av. |
| 2012 | 11.84 | 19.81 | 13.51 | 34.90 | 28.78 | 5.76 | 12.19 | 13.91 | 17.59 |
| 2013 | 10.05 | 23.68 | 16.71 | 37.33 | 31.43 | 6.58 | 13.86 | 11.84 | 18.94 |
| 2014 | 8.88 | 25.62 | 14.45 | 37.75 | 31.50 | 8.36 | 14.52 | 14.78 | 19.48 |
| 2015 | 7.56 | 19.11 | 15.98 | 33.83 | 26.55 | 9.70 | 12.32 | 0.00 | 15.63 |
| 2016 | 8.37 | 18.37 | 15.21 | 42.50 | 31.41 | 11.65 | 15.95 | 20.60 | 20.51 |
| 2017 | 7.98 | 20.86 | 15.97 | 43.43 | 29.88 | 7.65 | 12.55 | 21.83 | 20.02 |
| 2018 | 10.38 | 25.23 | 18.02 | 39.13 | 33.89 | 14.99 | 15.69 | 23.62 | 22.62 |
| 2019 | 14.84 | 25.87 | 13.96 | 31.38 | 31.46 | 10.82 | 15.49 | 16.18 | 20.00 |
| 2020 | 11.46 | 23.52 | 13.38 | 26.41 | 28.13 | 14.11 | 15.81 | 17.52 | 18.79 |
| 2021 | 10.33 | 23.06 | 11.39 | 20.96 | 18.57 | 7.14 | 14.54 | 11.21 | 14.65 |
| Mean | 10.17 | 22.51 | 14.86 | 34.76 | 29.16 | 9.68 | 14.29 | 15.15 | 18.82 |
| SD | 2.18 | 2.78 | 1.92 | 7.01 | 4.27 | 3.17 | 1.49 | 4.41 | 2.35 |
| CV | 0.21 | 0.12 | 0.13 | 0.20 | 0.15 | 0.33 | 0.10 | 0.27 | 0.12 |
Table 1 explains that the changeability of operational activities of leading Indian automobile corporations is acceptable except Ashok Automobile corporations (0.33). The Indian automobile corporations whose operational activities rate is comparatively high have the lowest variability in the operational variability rate for the period 2012 to 2021. The variability of the velocity of average operational activities (CV=0.49) among Indian leading automobile corporations is abnormal or not acceptable. The velocity of operational activities of leading Indian automobile corporations’ are significantly different and there are no abnormal fluctuations seen since 2012.
Normality of Variability and Average of Assets Turnover Ratios
The normality of the variability and average of Assets turnover ratios explain the fluctuations of the utilization of resources and average of the utilization of resources rate. Following are the normality and average assets turnover ratios of the leading Indian automobile corporations.
| Table 2 Assets Turnover Ratios of Leading Automobile Corporations of India |
|||||||||
|---|---|---|---|---|---|---|---|---|---|
| Years | Tata | MSIL | M&M L | Hero | Bajaj | Ashok | TVS | Eicher | Av. |
| 2012 | 99.6 | 159.56 | 133.21 | 238.43 | 176.23 | 107.77 | 226.91 | 102.44 | 155.52 |
| 2013 | 85.78 | 163.04 | 147.3 | 246.51 | 160.25 | 95.3 | 226.49 | 114.78 | 154.93 |
| 2014 | 68.94 | 143.11 | 129.46 | 250.31 | 136.62 | 77.63 | 223.35 | 135.99 | 145.68 |
| 2015 | 72.67 | 148.93 | 118.21 | 262.17 | 138.87 | 101.88 | 219.32 | 0 | 132.76 |
| 2016 | 75.59 | 137.19 | 115.14 | 231.74 | 137 | 148.25 | 224.23 | 170.7 | 154.98 |
| 2017 | 75.26 | 132.74 | 110.22 | 193.95 | 104.57 | 143.44 | 205.52 | 127.03 | 136.59 |
| 2018 | 99.35 | 134.34 | 102.67 | 192.54 | 105.64 | 152.02 | 210.73 | 114.91 | 139.03 |
| 2019 | 113.61 | 136.68 | 101.74 | 190.74 | 110.48 | 159.42 | 217.57 | 103.34 | 141.70 |
| 2020 | 70.18 | 120.87 | 90.07 | 153.79 | 120.76 | 106.57 | 175.58 | 85.8 | 115.45 |
| 2021 | 72.28 | 100.37 | 75.58 | 138.98 | 87.98 | 82.93 | 164.26 | 68.27 | 98.83 |
| Mean | 83.33 | 137.68 | 112.36 | 209.92 | 127.84 | 117.52 | 209.40 | 102.33 | 137.55 |
| SD | 15.58 | 18.22 | 21.22 | 42.29 | 27.18 | 30.37 | 22.05 | 45.51 | 18.33 |
| CV | 0.19 | 0.13 | 0.19 | 0.2 | 0.21 | 0.26 | 0.11 | 0.44 | 1.13 |
Table 2 explains that the changeability of the utilization of resources of leading Indian automobile corporations is acceptable except Eicher Automobile corporations (0.44). Smaller and two-wheeler focusing Indian automobile corporations’ (Hero-209.92; TVS-209.40) utilization of resources is higher than the bigger and hybrid automobile products manufacturing Indian automobile corporations for the period 2012 to 2021. The variability of the velocity of utilization of resources (CV=0.32) among Indian leading automobile corporations is not normal or unacceptable. The leading Indian automobile corporations’ utilization of resources rates are significantly different and there are no abnormal fluctuations seen since 2012.
Normality of Variability and Average of Profitability Ratios
The normality of variability and average of profitability ratios reflects no effects of the abnormal or extraordinary factor on profit-earning capacity of the corporations and average earning capacity. The analysis of profitability ratios can be divided into two i.e., Profitability ratios based on sales, and Profitability ratios based on Investment.
Normality of Variability and Average of Profitability Ratios Based on Sales
Normality of variability and average of Profitability ratios based on sales reveals that there are no abnormal factors that affect the manufacturing cost composition of the product and average earning capacity of the business organization. Further, profitability ratios based on sales can be bifurcated into two i.e., Profitability Before Depreciation, Interest, and Tax (PBDIT), and Profitability After Tax (PAT).
Normality of Variability and Average of PBDIT Ratios
Normality of Profitability Before Depreciation, Interest, and Tax (PBDIT) ratio reveal the manufacturing efficiency of the business organization, and normality of variability reveals the symmetry that profitability is not affected by any abnormal factors while average indicates average profit-earning capacity. Following is the normality and average of PBDIT ratios of the leading Indian automobile corporations.
| Table 3 Pbdit Ratios of Leading Automobile Corporations of India |
|||||||||
|---|---|---|---|---|---|---|---|---|---|
| Years | Tata | MSIL | M&M L | Hero | Bajaj | Ashok | TVS | Eicher | Av. |
| 2012 | 8.74 | 9.38 | 13.29 | 16.89 | 22.16 | 10.09 | 6.89 | 18.22 | 13.21 |
| 2013 | 8.48 | 11.56 | 13.00 | 15.49 | 22.15 | 7.52 | 6.12 | 23.13 | 13.43 |
| 2014 | 8.52 | 13.54 | 13.42 | 15.77 | 23.88 | 2.34 | 6.38 | 28.03 | 13.99 |
| 2015 | 1.77 | 15.09 | 12.89 | 14.62 | 21.74 | 8.48 | 6.30 | 30.69 | 13.95 |
| 2016 | 10.15 | 17.98 | 13.38 | 16.91 | 25.92 | 12.52 | 8.22 | 32.19 | 17.16 |
| 2017 | 5.84 | 18.59 | 13.30 | 18.09 | 25.93 | 11.61 | 8.49 | 34.57 | 17.05 |
| 2018 | 8.27 | 17.68 | 14.91 | 18.01 | 24.36 | 11.98 | 8.42 | 35.56 | 17.40 |
| 2019 | 10.82 | 15.76 | 15.53 | 16.70 | 21.92 | 11.17 | 7.91 | 35.24 | 16.88 |
| 2020 | 1.66 | 14.18 | 16.41 | 16.42 | 22.82 | 7.42 | 8.39 | 31.05 | 14.79 |
| 2021 | 4.96 | 11.78 | 17.15 | 14.93 | 22.36 | 4.27 | 8.72 | 25.97 | 13.77 |
| Mean | 6.92 | 14.55 | 14.33 | 16.38 | 23.32 | 8.74 | 7.58 | 29.47 | 15.16 |
| SD | 3.25 | 3.06 | 1.56 | 1.18 | 1.61 | 3.42 | 1.04 | 5.67 | 1.65 |
| CV | 0.47 | 0.21 | 0.10 | 0.07 | 0.07 | 0.39 | 0.14 | 0.19 | 0.11 |
Table 3 explains that the changeability of PBDIT of all Indian automobile corporations is acceptable except Tata (0.47) and Ashok (0.39) Automobile corporations. The profitability of the smaller two-wheeler Indian automobile corporations is better than bigger Indian automobile hybrid automobile manufacturing corporations. The variability of the average of PBDIT (CV=0.52) among Indian leading automobile corporations is not normal or unacceptable. The leading Indian automobile corporations’ PBDIT ratios are significantly different and there are no abnormal fluctuations seen since 2012.
Normality of Variability and Average of PAT Ratios
The normality of Profitability After Tax (PAT) ratio reveals the symmetry of manufacturing and administrative efficiency that profitability is not affected by the abnormal factors while average indicates normal net profit-earning capacity. Following is the normality and average of PAT ratios of the leading Indian automobile corporations.
| Table 4 Pat Ratios of Leading Automobile Corporations of India |
|||||||||
|---|---|---|---|---|---|---|---|---|---|
| Years | Tata | MSIL | M&M L | Hero | Bajaj | Ashok | TVS | Eicher | Av. |
| 2012 | 2.28 | 4.59 | 9.03 | 10.08 | 15.38 | 4.40 | 3.49 | 13.79 | 7.88 |
| 2013 | 0.67 | 5.48 | 8.29 | 8.91 | 15.21 | 3.47 | 1.64 | 16.36 | 7.50 |
| 2014 | 0.97 | 6.36 | 9.27 | 8.34 | 16.09 | 0.29 | 3.28 | 18.43 | 7.88 |
| 2015 | -13.05 | 7.42 | 8.52 | 8.64 | 13.01 | 2.46 | 3.44 | 20.00 | 6.31 |
| 2016 | 0.14 | 9.32 | 7.83 | 10.95 | 17.39 | 2.05 | 4.40 | 21.16 | 9.16 |
| 2017 | -5.48 | 10.80 | 8.27 | 11.84 | 17.58 | 6.07 | 4.59 | 22.16 | 9.48 |
| 2018 | -1.75 | 9.68 | 8.94 | 11.47 | 16.16 | 6.51 | 4.37 | 19.12 | 9.31 |
| 2019 | 2.91 | 8.71 | 8.94 | 10.05 | 15.45 | 6.82 | 3.68 | 20.97 | 9.69 |
| 2020 | -16.59 | 7.47 | 2.92 | 12.59 | 17.04 | 1.37 | 3.60 | 20.97 | 6.17 |
| 2021 | -5.09 | 6.01 | 0.59 | 9.62 | 16.41 | -2.05 | 3.65 | 15.42 | 5.57 |
| Mean | -3.50 | 7.58 | 7.26 | 10.25 | 15.97 | 3.14 | 3.61 | 18.84 | 7.89 |
| SD | 6.64 | 2.01 | 2.98 | 1.43 | 1.33 | 2.89 | 0.83 | 2.80 | 1.51 |
| CV | -1.90 | 0.27 | 41.00 | 0.14 | 0.08 | 0.91 | 0.22 | 0.14 | 0.19 |
Table 4 explains that the changeability of PAT of leading Indian automobile corporations is normal and acceptable except Tata (CV=-1.90) and Ashok (CV=0.91) automobile corporations. The profitability of the smaller two-wheeler Indian automobile corporations (Eicher=18.84; Hero=10.25) is better than bigger Indian automobile hybrid automobile manufacturing corporations. The variability of the average of PAT (CV=0.91) among Indian leading automobile corporations is not normal or unacceptable. The leading Indian automobile corporations’ PAT ratio are significantly different and there are no abnormal fluctuations seen except Tata and Ashok since 2012.
Normality of Variability and Average of Profitability Ratios Based on Investment
Normality of variability and average of profitability ratios based on Investment measures and explains the profit-earning capacity of the business organization is not affected by the abnormal factors and average earning capacity of the business organization in the context of funds invested in the business organization. Profitability based on Investment can be divided into two i.e., profitability on capital employed in business activities/return on capital employed, and profitability on funds invested in total resources/return on assets of the business organization.
Normality of Variability and Average of Return On Capital Employed (ROCE)
The normality of variability and average of Return on Capital Employed reveals that the profitability is not affected by the abnormal factors and average profit-earning capacity in the context of capital employed in business activities. Following is the normality and average of ROCE ratios of the leading Indian automobile corporations.
| Table 5 Roce Ratios of Leading Automobile Corporations of India |
|||||||||
|---|---|---|---|---|---|---|---|---|---|
| Years | Tata | MSIL | M&M L | Hero | Bajaj | Ashok | TVS | Eicher | Av. |
| 2012 | 3.84 | 10.37 | 17.39 | 42.86 | 46.53 | 8.00 | 13.87 | 22.34 | 20.65 |
| 2013 | 0.97 | 11.95 | 17.36 | 38.71 | 36.47 | 5.55 | 6.22 | 32.84 | 18.76 |
| 2014 | 2.75 | 12.39 | 16.68 | 37.16 | 32.37 | 0.35 | 12.85 | 43.93 | 19.81 |
| 2015 | -16.02 | 15.00 | 13.85 | 35.93 | 25.38 | 4.04 | 14.73 | 0.00 | 11.61 |
| 2016 | 5.31 | 17.35 | 12.49 | 37.77 | 28.67 | 4.94 | 18.55 | 54.04 | 22.39 |
| 2017 | -1.19 | 26.42 | 14.28 | 44.00 | 30.32 | 16.05 | 18.27 | 56.17 | 25.54 |
| 2018 | 5.04 | 25.83 | 16.95 | 42.35 | 29.50 | 30.07 | 19.48 | 52.91 | 27.77 |
| 2019 | 11.57 | 21.60 | 16.86 | 37.15 | 28.28 | 27.81 | 24.06 | 42.05 | 26.17 |
| 2020 | -7.18 | 14.04 | 13.26 | 26.52 | 32.08 | 6.67 | 18.29 | 28.00 | 16.46 |
| 2021 | -3.46 | 9.74 | 12.35 | 24.43 | 22.96 | -0.91 | 17.24 | 17.58 | 12.49 |
| Mean | 0.16 | 16.47 | 15.15 | 36.69 | 31.26 | 10.26 | 16.36 | 34.99 | 20.17 |
| SD | 7.69 | 6.16 | 2.09 | 6.53 | 6.54 | 10.87 | 4.78 | 18.27 | 5.54 |
| CV | 47.18 | 0.37 | 0.14 | 0.17 | 0.21 | 1.05 | 0.29 | 0.52 | 0.27 |
Table 5 explains that the variability of ROCE of all Indian automobile corporations is normal and acceptable except Tata (CV=47.18), Ashok (CV=1.05), and Eicher (0.52) automobile corporations. The profitability of the smaller & two-wheeler Indian automobile corporations (Eicher=34.99; Hero=36.69) is better than bigger Indian automobile hybrid automobile manufacturing corporations. The variability of the average of ROCE (CV=0.64) among Indian leading automobile corporations is not normal or unacceptable. The leading Indian automobile corporations’ ROCE ratios are significantly different and there are no abnormal fluctuations seen except Tata and Eicher since 2012.
Normality of Variability and Average of Return On Assets (ROA)
Normality of variability and average of return assets reveals that the normality of the profitability on assets invested in business activities is not affected by the abnormal factors and average profit-earning capacity in the context of total resources of the business. Following are the ROA ratios and average of the leading Indian automobile corporations.
| Table 6 Roa Ratios of Leading Automobile Corporations of India |
|||||||||
|---|---|---|---|---|---|---|---|---|---|
| Years | Tata | MSIL | M&M L | Hero | Bajaj | Ashok | TVS | Eicher | Av. |
| 2012 | 2.27 | 7.33 | 12.03 | 24.04 | 27.10 | 4.74 | 7.93 | 14.13 | 12.45 |
| 2013 | 0.57 | 8.94 | 12.21 | 21.96 | 24.39 | 3.31 | 3.71 | 18.78 | 11.73 |
| 2014 | 0.67 | 9.11 | 12.01 | 20.88 | 21.99 | 0.22 | 7.33 | 25.07 | 12.16 |
| 2015 | -9.48 | 11.06 | 10.08 | 22.67 | 18.08 | 2.51 | 7.55 | 0.00 | 7.81 |
| 2016 | -0.10 | 12.79 | 9.02 | 25.38 | 23.83 | 3.04 | 9.88 | 36.12 | 15.00 |
| 2017 | -4.12 | 14.34 | 9.11 | 22.98 | 18.38 | 8.71 | 9.45 | 28.15 | 13.38 |
| 2018 | -1.74 | 13.00 | 9.18 | 22.08 | 17.07 | 9.90 | 9.22 | 21.97 | 12.59 |
| 2019 | 3.31 | 11.91 | 9.10 | 19.18 | 17.07 | 10.88 | 8.00 | 21.67 | 12.64 |
| 2020 | -11.64 | 9.03 | 2.63 | 19.37 | 20.58 | 1.46 | 6.33 | 17.99 | 8.22 |
| 2021 | -3.68 | 6.03 | 0.45 | 13.37 | 14.44 | -1.70 | 6.00 | 10.53 | 5.68 |
| Mean | -2.39 | 10.35 | 8.58 | 21.19 | 20.29 | 4.31 | 7.54 | 19.44 | 11.16 |
| SD | 4.93 | 2.69 | 3.97 | 3.35 | 3.97 | 4.23 | 1.85 | 9.92 | 2.92 |
| CV | -2.39 | 0.26 | 0.46 | 0.15 | 0.19 | 0.98 | 0.24 | 0.51 | 0.26 |
Table 6 explains that the variability of ROA of all Indian automobile corporations is normal and acceptable except Tata (CV=-2.39), Ashok (CV=0.98), and Eicher (CV=0.51) automobile corporations. The profitability of the smaller & two-wheeler Indian automobile corporations (Eicher=19.44; Hero=13.37; and Bajaj=20.29) is better than bigger Indian automobile hybrid automobile manufacturing corporations. The variability of the average ROCE (CV=0.53) among Indian leading automobile corporations is not normal or unacceptable. The leading Indian automobile corporations’ ROA ratio is significantly different and there are no abnormal fluctuations seen except Tata, Ashok, and Eicher since 2012.
Similarity of Velocity of Operational Activities, Utilization of Resources, and Profitability Ratios among the Leading Indian Automobile Corporations
The velocity of operational activities refers to the frequency of the convertibility of average inventory into finished products while utilization of resources refers proportional relationship of net sales and the total assets or total resources. Profitability ratios measure the profit earning capacity of the business organization establishing logical relationships between various financial variables. Normally, similarity in operational activities and utilization of resources, and profitability is expected from the corporations manufacturing similar products.
Similarity of Velocity of Operational Activities
The Similarity of the velocity of the operational activities reveals the equality in manufacturing efficiency or manufacturing frequency among the corporations of a sector. Normally, the similarity is expected in the frequency of the velocity of operational activities among the corporations manufacturing similar products.
| Table 7 Similarity of Velocity of Operational Activities |
||||
|---|---|---|---|---|
| H. No. | Hypothesis | F* | Fα** | Decision: H0 (If F≥Fα, Reject H0 ) |
| H01 | There is insignificant difference among the operational velocity of the leading Indian automobile corporations | 47.1 | 2.1397 | Reject H01 |
Table 7 reveals that the operational velocity of the leading Indian automobile is different. These significant differences refer to the manufacturing efficiency of the products that govern the velocity or frequency of the manufacturing activities.
Similarity of Velocity of the Utilization of Resources
The similarity of the velocity of the utilization of resources reveals the equality in turnover of the resources in the normal course of business activities among the corporations of a sector. Normally, the similarity is expected in the frequency of velocity of utilization of resources among the corporations manufacturing similar products.
| Table 8 Similarity of Velocity of Utilization of Resources |
||||
|---|---|---|---|---|
| H. No. | Hypothesis | F* | Fα** | Decision: H0 (If F≥Fα, Reject H0 ) |
| H02 | There is insignificant difference among the velocity of utilization of the resources of the leading Indian automobile corporations | 25.53 | 2.14 | Reject H02 |
Table 8 reveals that the utilization of the resources of the leading Indian automobile is different. This significant difference refers to the variation in the utilization of total resources in the context of net sales. The manufacturing efficiency and salability of the products govern the velocity of utilization of resources.
Similarity of Profitability Ratios Based on Sales
Normally, similarity in profitability ratios is based on sales expected among the corporations manufacturing and selling similar products.
Similarity of Profitability Before Depreciation, Interest, And Tax (PBDIT)
The similarity in Profitability Before Depreciation, Interest, And Tax (PBDIT) profitability is expected among the corporations manufacturing similar products and reveals similar manufacturing efficiency.
| Table 9 Similarity of Profit Before Depreciation and Tax |
||||
|---|---|---|---|---|
| H. No. | Hypothesis | F* | Fα** | Decision: H0 (If F≥Fα, Reject H0 ) |
| H03 | There is insignificant difference among the PBDIT of the leading Indian automobile corporations | 70.73 | 2.1397 | Reject H03 |
Table 9 Discloses that the profitability before depreciation, interest, and tax of the leading Indian automobile is different. This significant difference refers to the variation in the profitability before depreciation, interest, and tax in the context of net sales. The manufacturing efficiency governs the velocity of profitability before depreciation, interest, and tax.
Similarity of Profitability Tax (PAT)
The similarity in Profitability After Tax (PAT) is expected among the corporations manufacturing similar products and reveals similar manufacturing and administrative efficiency.
| Table 10 Similarity of Profit After Tax |
||||
|---|---|---|---|---|
| H. No. | Hypothesis | F* | Fα** | Decision: H0 (If F≥Fα, Reject H0 ) |
| H04 | There is insignificant difference among the PAT of the leading Indian automobile corporations | 53.2 | 2.14 | Reject H04 |
Table 10 explains that the profitability after tax of the leading Indian automobile is different. This significant difference refers to the variation in the profitability after-tax in the context of net sales. The manufacturing and administrative efficiency govern the velocity of profitability after tax.
Similarity of Profitability Ratios Based on Investment
Normally, similarity in profitability ratios is based on investment expected among the corporations manufacturing and selling similar products.
Similarity of Return On Capital (ROCE)
The similarity in Return On Capital (ROCE) is expected among the corporations manufacturing similar products and reveals the efficiency in the utilization of the funds invested in the business activities. Normally, there is a similar Return On Capital (ROCE) among the corporations producing similar products unless not affected by any abnormal factors.
| Table 11 Similarity of Return on Capital Employed |
||||
|---|---|---|---|---|
| H. No. | Hypothesis | F* | Fα** | Decision: H0 (If F≥Fα, Reject H0 ) |
| H05 | There is insignificant difference among the ROCE of the leading Indian automobile corporations | 20.2 | 2.14 | Reject H05 |
Table 11 explains that the return on capital employed of the leading Indian automobile is different. This significant difference refers to the variation in the return on capital in the context of funds invested in business activities. The manufacturing and administrative efficiency enhances the Earning Before Interest and Tax (EBIT) and governs return on capital employed.
Similarity of ROA
The similarity in Return On Assets (ROA) expected among the corporations manufacturing similar products and reveals the efficiency in the utilization of the funds invested in the business organization. Normally, there is a similar Return On Assets (ROA) among the corporations producing similar products unless not affected by any abnormal factors.
| Table 12 Similarity of Return on Assets |
||||
|---|---|---|---|---|
| H. No. | Hypothesis | F* | Fα** | Decision: H0 (If F≥Fα, Reject H0 ) |
| H06 | There is insignificant difference among the ROA of the leading Indian automobile corporations | 29.7 | 2.14 | Reject H06 |
Table 12 explains that the return on assets of the leading Indian automobile is different. This significant difference refers to the variation in net income in the context of funds invested in a business organization. The manufacturing, administrative efficiency, and income from other sources enhance the Net Income (NI) and govern return on assets.
Co- Movement of the Operational Activities, Utilization of Resources, and Profitability Ratios of Leading Indian Automobile Corporations
Co-movement of the variables refers to the cause and effect and reveals the cohesiveness and sympathetic movement relationship. Operational velocity and utilization of the business organization can be the factor to govern the various measures the profitability.
Co-movement of the Operational Activities, and Profitability Ratios of Leading Indian Automobile Corporations
Operational velocity directly affects profitability by reducing the indirect cost per product or manufacturing the enhanced quantity of products to enhance the absolute profit. So, operational velocity enhances the profitability based on sales and profitability based on the investment.
| Table 13 Correlation Between Inventory Turnover Ratios and Profitability Ratios |
|||||
|---|---|---|---|---|---|
| "r" | Inventory Turnover | PBDIT | PAT | ROCE | ROA |
| Inv. Turn | 1 | ||||
| PBDIT | 0.74 | 1 | |||
| PAT | 0.83 | 0.78 | 1 | ||
| ROCE | 0.89 | 0.76 | 0.95 | 1 | |
| ROA | 0.79 | 0.56 | 0.91 | 0.83 | 1 |
From Table 13, it is obvious that the velocity of the operational activities of the leading Indian automobile corporations governs the profitability based on sales and investment positively and highly. Hence, H07 is accepted.
Co-movement of the Utilization of Resources, and Profitability Ratios among the Leading Indian Automobile Corporations
The velocity of utilization of total resources directly affects the profitability by the enhanced quantity of products to enhance the absolute profit. So, the velocity of utilization resources enhances the profitability based on investment and indirectly profitability based on sales.
| Table 14 Correlation Between Assets Turnover Ratios And Profitability Ratios |
|||||
|---|---|---|---|---|---|
| "r" | Assets Turnover | PBDIT | PAT | ROCE | ROA |
| Ass. Turn. | 1 | ||||
| PBDIT | 0.13 | 1 | |||
| PAT | 0.64 | 0.78 | 1 | ||
| ROCE | 0.52 | 0.76 | 0.95 | 1 | |
| ROA | 0.85 | 0.56 | 0.91 | 0.83 | 1 |
From Table 14, It is obvious that the velocity of the utilization of the total assets of the leading Indian automobile corporations governs profitability based on investment positively and highly while lower degree correlation between velocity of utilization of resources and profitability based sales. Hence, H08 is rejected.
Outcomes of the Study
Normality and Average of Variables Outcomes
Normality and average outcomes reveal that the Indian automobile corporations whose
operational activities rates are comparatively high have the lowest variability in the operational variability rate and Smaller and two-wheeler focusing Indian automobile corporations’ utilization of resources is higher than the bigger and hybrid automobile products manufacturing Indian automobile corporations for the period 2012 to 2021. Manufacturing cost efficiency and profitability of the smaller two-wheeler Indian automobile corporations are better than bigger Indian automobile hybrid automobile manufacturing corporations. Profitability on funds invested in business activities and funds invested in total resources is better in smaller and two-wheeler focusing Indian automobile corporations than the bigger Indian automobile corporations. The variability of profitability of the leading Indian automobile is normal and acceptable for the period 2012 to 2021.
The Similarity of Variables Outcomes
The similarity of variables outcomes reveals that there is no similarity amongst the operational velocity, utilization of resources velocity, manufacturing cost efficiencies, profit-earning capacity, in the context of sales of the leading Indian automobile corporations. Profit earning capacity in the context of funds invested in operational activities and total resources is significantly different in leading Indian automobile corporations.
Co-movement of Variables Outcomes
Co-movement of variables analysis reveals that the operational velocity governs the profit earning capacity and the absolute profit of leading Indian automobile corporations. But, utilization of resources governs only the absolute profit, not the profit earning capacity of the leading Indian automobile corporations for the period 2012 to 2021.
Conclusion
Based on the above normality and average it can be said that the variability of operational velocity, utilization of resources velocity, manufacturing cost efficiency, net profit-earning capacity, profitability in the context of funds invested in the business actitiities and total resources is normal for the period 2012 to 2021. But, the average performance of the leading Indian automobile corporations is significantly different. There is no similarity amongst the operational velocity, utilization of resources velocity, manufacturing cost efficiency, net profit-earning capacity, and profit in the context of capital invested in business activities and funds invested in the total resources of the leading Indian automobile corporations for the period 2012 to 2021. The operational velocity governs manufacturing cost efficiency, net profit-earning capacity, and profit in the context of capital invested in business activities and funds invested in the total resources more than utilization of the resources velocity. The variability in the profitability of the smaller automobile corporations is progressive and more than the bigger Indian automobile corporations. The study recommends focusing on operational velocity to enhance the manufacturing cost efficiency, net profitability, and profitability of funds invested. The average financial performance of the smaller corporations is better than bigger Indian automobile corporations for 2012 to 2021. The study considers only the financial data available on the websites of the leading Indian automobile corporations. Further, there is scope available to consider the automobile product-wise operational velocity, utilization of the resources velocity, and its impact on the various measures of profitability.
Acknowledgment
Anis Ali, department of management, Prince Sattam Bin Abdulaziz University, Saudi Arabia.
References
Ali, A. (2020a). Financial performance and size determinants: Growth trend and similarity analysis of Indian pharmaceutical industry. Humanities and Social Sciences Reviews, 8(4), 547-560.
Crossref , Google scholar , Indexed
Ali, A. (2021). Supply chain performance, profitability and Liquidity: An analytical study of Indian pharmaceutical sector. Accounting, 7(6), 1479-1490.
Ashraf, C.K. (2012). The relationship between working capital efficiency and profitability. Journal of accounting and management, 2(3), 21-45.
Attari, M.A., & Raza, K. (2012). The optimal relationship of cash conversion cycle with firm size and profitability. International Journal of Academic Research in Business and Social Sciences, 2(4), 189-203.
Crossref , Google scholar , Indexed
Gopalakrishnan, C. (2014). Profitability trend in BSE listed automobile sector in India. RVS Journal of Management, 6(2), 85-95.
Hassan, M., & Shrivastava, S.K. (2019). Working capital management and its impact on the profitability of tata motors. In Proceedings of 10th International Conference on Digital Strategies for Organizational Success.
Crossref , Google scholar , Indexed
Jaisinghani, D., & Tandon, D. (2016). R&D, Profit persistence impact on profitability of the Indian automobile sector. APEA 2016, 1-43.
Crossref , Google scholar , Indexed
Jamali, A.H., & Asadi, A. (2012). Management efficiency and profitability in Indian automobile industry: From theory to practice. Indian Journal of Science and Technology, 5(5), 2779-2781.
Kaur, N., & Kaur, J. (2016). Determinants of profitability of automobile industry in India. Journal of Commerce & Accounting Research, 5(3), 32-39.
Kumar, N., & Kaur, K. (2016). Firm size and profitability in Indian automobile industry: An analysis. Pacific Business Review International, 8(7), 69-78.
Paliwal, R., & Chouhan, V. (2017). Relationship between liquidity and profitability in Indian automobile industry. International Journal of Science and Research (IJSR ISSN (Online): 2319-7064.
Paliwal, R., & Chouhan, V. (2017). Relationship between liquidity and profitability in Indian automobile industry. International Journal of Science and Research (IJSR ISSN (Online): 2319-7064.
Crossref , Google scholar , Indexed
Ranjithkumar, M.S., & Eahambaram, C. (2018). A study on profitability analysis of Indian selected automobile industry in India. International Journal for Research in Engineering Application & Management, 2(7), 412-416.
Shajar, S.N. (2017). Relationship between working capital management and profitability of automobile corporations in India: A paradigm shift towards economic strengthening. International Journal of Trade, Economics and Finance, 8(4), 210-216.
Crossref , Google scholar , Indexed
Suresh, S., & Sengottaiyan, A. (2015). Does capital structure decision affects profitability? A study of selected automobile corporations in India. International Journal of Research in Social Sciences, 5(4), 113-123.
Tripathi, S., & Talukder, B. (2020). Supply chain performance and profitability in Indian automobile industry: Evidence of segmental difference. Global Business Review, 1-22.
Crossref , Google scholar , Indexed
Received: 16-Dec-2021, Manuscript No. AAFSJ-21-9626; Editor assigned: 18-Dec-2021, PreQC No. AAFSJ-21-9626(PQ); Reviewed: 28-Dec-2021, QC No. AAFSJ-21-9626; Revised: 09-Jan-2022, Manuscript No. AAFSJ-21-9626(R); Published: 16-Jan-2022