Research Article: 2022 Vol: 26 Issue: 3S
Performance Evaluation of a Forex System: Marketing Prospects Analysis
Md. Chhali Uddin, Jashore University of Science and Technology
Md. Mahedi Hasan, Jashore University of Science and Technology
S.M. Shariful Haque, Jashore University of Science and Technology
Citation Information: Uddin, C., Hasan, M., & Haque, S.M.S. (2022). Performance evaluation of a forex system: marketing prospects analysis. Academy of Accounting and Financial Studies Journal, 26(S3), 1-18.
Abstract
Forex market is a zero-sum game, and according to statistics, around 95% of traders lose money in the Forex market and quit. Developing a dependable trading system for forex market still remains a substantial challenge for both scholars plus traders. The purpose of this study is to develop a consistent, effective trading strategy utilizing candlesticks, charts patterns, trend lines, support, and resistance to predict future price movements of the Forex Market and analyze its marketing prospects. This study employs a diverse set of tools to evolve a dependable set of trading systems based on the confluence of technical analysis methods. The system was designed and tested over five months (Jan 04, 2021- Jun 01, 2021) on the DE30 pair, and the performance was compared with the existing trading strategies. It yielded 76.66% profit and resulted in significantly higher returns than those of the current trading systems. The researchers assume that this strategy will work in any changeable market conditions and suit any market situation.
Keywords
Forex system, Strategy forex trading, Technical Analysis, Swing Trading in Forex, Day Trading on Forex.
Introduction
Forex is short for foreign exchange or currency trading. It is very complicated and risky. It takes a few days to learn to analyze the market but takes a lifetime to master. The standard way of analyzing the forex market is the technical analysis which focuses on the price movement on the charts, past price data, market sentiments, and economic data to determine future price movements in the market (Yuan, 2012; Aliu et al., 2021; Chang et al., 2017). Not every trader can analyze and earn decent payouts regularly from the market. Most of the traders lose their first deposit within one month (Tan et al., 2015). According to the Bank of International Settlements (BIS), (Crescenzio, 2014). approximately 33% of Forex traders are able to make a profit over three months. However, the percentage of those market participants who can do this consistently on a yearly basis stands at 6.7%. This suggests that more than 93% of traders cannot achieve this goal. Most people fail in this market is having no trading strategy. Having no trading strategy is like shooting in the dark since a trader never knows where the account will end. So for novice traders, a simple, straightforward, easy to follow, effective, tested, and dependable trading strategy is the prerequisite of success in Forex trading. Although there are a number of trading strategies in the market, but to master those strategies takes a lot of time and is not suitable for all traders.
The previous study confirms that trading in the forex market is extremely risky and inappropriate for the majority of the traders. Developing a strategy that works best is indeed a time-consuming process and may take months or even years to perfect any strategy using trial and error. One of the hardest and time-consuming aspects of creating a strategy is finding the proper toolbox and combining them the right way. Combining technical tools in the wrong way would result in wrong price interpretation and, subsequently, wrong trading decisions (Yoon, 2021). The strategy explained in this paper is a series of instructions on whether to buy or sell a currency pair and the trade's entry, exit, and risk management strategy. It aims to avoid losses and become a better and more consistently successful trader. No complicated entry/exit rules are used in this study, so a trader does not have to spend hours after hours finding favorable trades. Any forex trader, irrespective of the experience level, can use it easily, and it only takes only a few minutes to get it entirely set up and running (Papadamou & Tsopoglou, 2001).
The marketability of a trading system is a measure of whether the strategy will appeal to traders and sell at a specific price. This forex strategy was tested for months with some great results. According to the report by forex magnates in 2019, the biggest and most liquid money market in the world is Forex market, and it is worth $1,934,500,000,000. The daily trade volume is 53 times more than the NYSE, 13 times bigger than the futures market, and 28 times bigger than the equities market. The Forex market has emerged as a lucrative, flexible, and highly engaging opportunity for young people. According to forex magnates, in 2019, 43.5% of traders aged between 25-34 years are looking for a successful trading strategy, and their investment for a new, smooth, and hassle-free strategy is worth 3000 USD per year. So, it can be said that there are strong marketing prospects of a dependable trading strategy. Based on some metrics like market size, the growth rate of the market, market trends, liquidity of the market, economic solvency and purchasing capability of the trader, and market profitability, the marketing prospects of this strategy are analyzed (Jan & Gopalaswamy, 2019; Yong et al., 2015).
This study contributes to the literature in three ways: First, the paper develops a new composite trading strategy for novice and experienced traders. The strategy explained the entry-exit/rules and the expected likelihood of success in forex trading. Second, the developed model is tested in the real market over a long period to assess its dependability. Third, the marketing prospects of this strategy are analyzed in comparison with the most popular and widely used existing trade strategies. The remainder of the study is organized as follows: Section 2 develops a new trading strategy based on the confluence of technical analysis; the market-tested results of the model are presented in Section 3, marketing prospects are drawn in Section 4.
Background of Forex Technical Analysis
Technical Analysis is the act of analyzing past price data on charts to determine a bias. Charts provide a visual receipt of buyer and seller transactions in the market as well as economic and sentiment data. When trading with technical analysis, we rely on past data represented on charts to forecast the future direction of the market/currency pair. The most used technical analysis tools are as follows:
Technical indicators
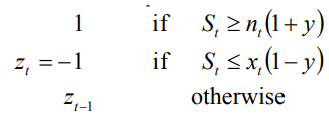
Rule filter: Trade for Buy: Price rises y percent from the local minimum and Sell: price falls y percent from the local maximum. Mathematical expression:
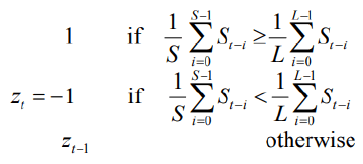
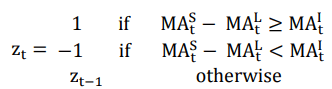
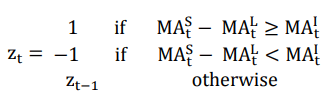
Double moving average (M.A.): Trade for Buy: Short MA exceeds the long MA + the band of inaction and Sell: Short MA drops below the long MA - the band of inaction. Mathematical expression:
Channel: Trade for Buy: The price surpasses the maximum over the prior (n) days + the band of inaction and Sell: The price is less than the minimum over the previous (n) days - the band of inaction. Mathematical expression:
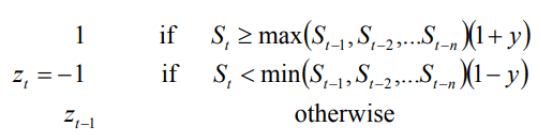
NB: St equals to the exchange rate at time t, nt equals to the local minimum, xt equals to the local maximum, and y equals to the size of the band of inaction, if any, in %. Long Trade equals to zt is an indicator variable that equals 1 and Short Trade equals to zt is an indicator variable that equals–1.
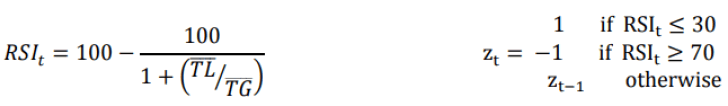
Relative strength indicator (RSI)
Trade for Buy = RSI value is less than 30; Sell= RSI value exceeds 70. T.L. = the average loss over the last n days. T.G. = the average gain over the last n days.
Exponentially weighted moving average (EWMA)
Trade Buy = the short exponentially weighted moving average of past prices exceeds the long exponentially weighted moving average. Trade Sell= exponentially weighted moving average of past prices falls short of the long exponentially weighted moving average.
Moving average convergence divergence (MACD)
Trade for Buy= the variance between the long and short M.A crosses a M.A of intermediate length from below. Trade for Sell= the variance between the long and short M.A crosses a M.A of intermediate length from above.
Rate of change (ROC)
Trade Buy = the ROC crosses the preset oversold level from below. Trade Sell= the ROC crosses the preset overbought level from above.
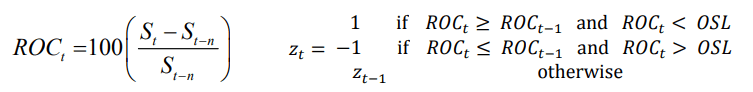
Notes: St equals to the exchange rate at time t. zt equals to an indicator variable that equals 1 for a Buy position and –1 for a Sell position.
Martingale Matrix: It involves doubling the trade volume against the first trade whenever there is a loss with a zero expectation of profit. The strategy focuses on regaining whatever’s been lost from the equity.
Retracement Trading: It is often termed as Fibonacci retracements or trend-retracements strategy. In this theory, traders search for a retracement taking place within a trend (long established uptrend or downtrend) and make trade entries in the direction of the initial trend using different Fibonacci levels.
Grid Trading: Grid trading refers to placing trader orders at fixed or changeable intervals around a specific price range to profit from trends (long orders at intervals above the specific price and vice versa) or ranges(place buy orders at intervals below the specific price and vice versa).
Momentum trading: Momentum trading refers to entering and exiting trades according to momentum indicators signals. MACD (Moving Average Convergence Divergence), histogram, and RSI (Relative strength index) are used to find overbought or oversold currency pairs, commodity, and index, and find good sell or buy entry points.
Problem Statement
Existing forex trading systems use mathematical and statistical methods to analyze data from the past and project future price movements. Only the past events can never indicate future probability with 100% accuracy because they always lag behind the current moment. The market is alive and moving, so these analysis tools accurately plot the past market opportunity, but these tools are not helpful to take a concurrent decision. In addition to that, using several technical tools simultaneously is confusing. Some might signal a BUY, while others might indicate that the market is in an overbought situation. So, they contradict each other, making it difficult to reach a trading decision. While making trading decisions, a trader has to consider all other factors like fundamental factors, hot news and events, different meetings, and overall market sentiment. So, in such a situation, few T.A. tools provide wrong signals.
Thousands of systems and strategies are there in the forex market to predict future price movements. Most of them are complex and manifold, and thus traders are searching for a trading system that is easy to follow and in combination with simple trading techniques.
Literature Review
Forex trading is like playing a game of fear and greed, and it is termed the biggest emotional roller coaster that not everyone can deal with. It is the largest battleground on this planet where traders play with their money (Yamada & Ito, 2017). It is an online, over-the-counter market in which anyone can trade 24 hours a day (Geromichalos & Jung, 2018; Ranaldo & Somogyi, 2018). The Bank of International Settlements (BIS) found that in Forex market, 5.6 trillion U.S. dollars are transacted every day, which is multiple times higher than any other capital market in the world. Through the internet and interbank networks, trading is conducted around the globe (Baruník et al., 2017). According to evidence from market data and scholar's research, almost 95% of Forex traders lose in trading and leave the market within three months to a year (Hayley & Marsh, 2016). According to the report of four-year observation by the French financial markets regulator (AMF), among the surveyed 14977 active traders, the rate of clients losing their first deposit exceeded 90%, with an average loss of 12356 USD per trader. DraKoln (2008) reported that 95% of retail traders and investors loss in forex trading. So, only 5% of traders are winning from the Forex market and DraKoln (2008) presented a trading guideline of technical analysis, emotion management, risk management, trading discipline, and practicing skills to help traders to ensure their presence among the top 5%. However, due to the changing nature of the Forex market, those strategies became obsolete within a few years (Fanning, 1979).
According to the reports of some economists, academicians, and financial analysts, the root cause of this loss includes little knowledge about the market by the traders, low startup capital, money and risk management failure, lack of discipline, patience, information and expertise, and higher expectation and greed (Kaniel & Sraer, 2016; Renneboog & Tobler, 2017; Barber & Odean, 2000). But the majority of the scholars claim that the root cause of failure in trading is not having proper knowledge about technical analysis and having no trading strategy (Feng & Seasholes, 2005; Barber et al., 2008). But the sobering truth is even the very experienced traders and investors who are trading at this market over a long period of time consistently lose money and eventually quit trading (Hayley & Marsh, 2016). Sadly, most financial analysts, large banks, and financial institutions are only concerned with their own profit. If we look beyond this obsession, we notice that much of this profit has been made at the loss of the investment of 95% of the traders (Kalsoom et al., 2021; Ramlall, 2016).
To this day, there are a number of forex trading strategies available in the market, but yet the percentage of losing traders is still the same (Smith & Wang, 2014). Because it takes months and years to develop a trading strategy and to realize and understand the money and risk management concept (Baker & Puttonen, 2019; Uddin, 2021). It sounds like the easiest thing to design a trading system, but building a simple, straightforward, and effective trading strategy is the hardest thing Rudik (2013). And after trading for the first months, traders start to understand they have sabotaged themselves and wasted their hard-earned money. Considering all the factors that cause traders to fail and lose money in the forex market, what might be the solution to protect the new traders? Is it possible to cut off the percentage of losing traders?
To the best of our knowledge, there is little endeavor put on to save the majority of Forex traders as most of the scholars are interested in predicting the price patterns in the Forex market (Litimi, 2013; Ghosh et al., 2016; Zhu et al., 2018); Aymen Ben Rejeb (2015) but little attention was paid to the issue of developing a profitable trading strategy. To induce a higher level of profitability and to survive in the forex market requires an overhaul of the traditional trading system and the inception of a new trading strategy (Hesketh, 1978; Ling et al., 2020).
The objective of the study
The key objective of this study is to develop a new competent trade strategy and analyze its marketing prospects in the Forex Market. This objective focuses on a quantitative approach to measure the accuracy of a newly developed trading strategy by describing several Long/Short strategies and then measuring the accuracy of the strategy by testing it on an index named DE30.
Methodology
The study's objective is to develop a trading strategy and analyze its marketability or marketing prospects. To reach this objective, the researchers followed the following two-step process:
1. Trade strategy development and
2. Marketability analysis
Trade Strategy Development
A hybrid trading system based on three candlesticks patterns (Pin bar, inside bar, and engulfing bar), support and resistance zones, and trend lines has been developed. A trade is placed once all of the pattern's confluence together and signals the same trade. That means, if a reversal candlestick formed at the top of the chart, which simultaneously becomes the resistance both for candlesticks and trend lines, then a highly probable entry for a sell trade becomes imminent and vice versa. In this paper, some specific patterns that are considered effective and workable are described, with the entry and exit rules for each of them. Finally, money management and risk management strategy are set up for them. Eventually, 96 trades were executed in the MT4 platform to evaluate the confluence strategy after developing the trading plan.
The system is named "Confluence of Technical Analysis". At first, a simple trading system based on technical analysis is developed. Then it is tested on the MT4 platform for five months. Finally, after collecting the trade-related data and comparing it with other trading systems, the marketability of this system is analyzed.
Marketability Analysis
After developing a trading system, a two-fold strategy was taken to analyze the marketing prospects- i) standard test market and ii) comparative analysis of the newly developed trade strategy with the most used existing trade strategies.
Standard test market: Intending to measure the real-world performance, the researcher tested the newly developed trade strategy in the Forex market for five months from Jan 04, 2021, to Jun 01, 2021.
Comparative analysis: After the test period, a comparative study was made between the performance of the newly developed trade strategy and those of the most used existing trade strategies (Martingale Matrix, Retracement Trading, Technical Indicator, Grid Trading, Momentum trading).
Proposed Forex System-The Confluence of Technical Analysis
Confluence simply means the together of two or more things. For Forex traders, confluence implies a combination of two or more price action patterns, support and resistance levels or indicators. Support and resistance levels, specific candlestick patterns, and chart patterns are extremely important parts of any pre-trade analysis. In confluence trading, multiple confirmations are allowed to line up together to find a high probability entry and exit point in the market. In addition to that, market structure, supply and demand zones, reversal and continuation chart and candlestick patterns, Fibonacci levels are also considered. Lastly, trades are placed by following a proper risk and money management strategy while keeping the emotion level under control. In designing the confluence strategy, the following patterns are considered.
Candlestick patterns: Candlestick patterns are one of the most popular elements of technical analysis. They are simply a visual representation of the battle between buyers and sellers in the market, i.e., Bulls Vs. Bears. They are widely used to predict the future direction of price movement. It provides a range of information about currency price movements and enables Forex traders to interpret the charts from just a few price candles quickly. After all, for there to be a winner, there has to be a loser. The goal is to analyze candlesticks based on their open and closing price to have an idea of who is in control of the market at any given time. Once the candles are closed, this price will tell who won, bulls or bears. In this strategy, three candlesticks patterns are considered and analyzed.
Pin Bar: Pin bar provides an excellent position to place the trade and hide the stop loss. In addition to that, it is effective both on the daily and 4-hour time frames. The pin bar can be highly profitable if correctly utilized. They can form in either a bullish or bearish pattern. The bullish or bearish pin bar might form at any level of the market. But before entering a trade, some factors need to be considered.
1. Support and resistance level of the chart
2. Any chart pattern formation in the chart and
3. Any channel or flag pattern formation in the chart
If the pin bar is well-formed and occurred at a key level, then it is essential to check if the market has tested the entire area. There are possibilities that the market has reacted sharply from the support and resistance level, which shows that demand is strong above or below the level, but the demand beyond the levels is unknown. The entry trigger should be pulled if the pin bar tests the entire level and demand is strong. The record shows that the more the pin bar's tail produces through a level, the better the reversal because it tells that the level has been thoroughly tested.
Pin Bars and Confluence
A pin bar pattern formed at the support and resistance level is most likely to work the best and confirms a strong reversal. On the other hand, if a pin bar is formed in a strong trending market, it might not be a sign of good trade entry; instead, it is a continuation pattern of the current pattern.
Entry Strategies of Pin Bar
There are two strategies to enter a trade based on a pin bar. Which way to trade really depends on the market conditions.
Break of Nose Entry: It is the most favorable way to enter a trade. The strategy is straightforward: to enter on a break of the pin bar nose by placing a pending stop order just beyond the nose of the pin bar.
50% Retrace Entry: This is the most common way to enter a pin bar trade among forex traders because it allows a much better entry. It increases the potential risk-reward ratio considerably. In this strategy, the traders simply draw the Fibonacci Retracement levels from the high of the pin bar tail to the low of the pin bar nose. After that, the traders put a pending sell order at the 50% Retracement level of the Fibonacci. Although it's not without flaw because the market won't retrace most of the time, which results in our buy or sell limit order being unfilled.
Stop Loss Strategies of Pin bar: The exit plan must be identified first before identifying the target profit. The best place to set the stop loss is above or below the pin bar tail. For both the bullish and bearish setup, the stop loss would be placed 8-12 pips from the end of the pin bar tail.
Take Profit Strategies a Pin bar: Before identifying a potential pin bar setup, the first thing to do is to identify the key support and resistance levels in the chart because for a valid pin bar setup; it is necessary to know if it has confluence factors counted on. Then additional levels need to be checked on a chart to make sure any key levels that may affect the validity of the pin bar setup might not be missed.
Inside Bar
The inside bar is a good continuation pattern and a highly effective Forex candlestick pattern. It provides a favorable place to hide a stop loss if it occurs during a strong trend. An inside bar is any candle or bar on the chart that forms inside of the previous candle or bar where the previous candle wholly engulfs the following candle or bar. The entire range of the candle (high to low) is considered apart from the open or close of either bar. The range (high to low) of the inside bar (mother bar) needs to be entirely engulfed by the high to low of the following bar’s range. Typically an Inside bar indicates a continuation of the current trend. That means if the trend is bullish and an inside bar is found, it suggests that the trend is likely to continue, and in the case of a bearish market, it also indicates a continuation pattern. So, an established trend is required for trading inside bar candlestick patterns.
The inside bar strategy works well on the higher time frames like 4 hour and daily timeframe because these timeframes produce cleaner price action patterns that help to take the worthwhile trade setups.
Entry strategy of an Inside Bar: The best place to enter a trade is on the break of the mother bar’s high or low in the direction of the trend. The best place is 8-12 pips higher than the moth bar high price.
Stop Loss strategy of an Inside Bar: There are two strategies for placing a stop-loss order. The first strategy is to put it 5-10 pips below the mother bar’s low. This is considered the safer approach, but it does not give an excellent risk-reward ratio. The second strategy is to place it 5-10 pips below the inside bar’s low. This placement provides the best risk to reward ratio (1:2 or higher), and it is a relatively safe place to hide stop-loss order.
Engulfing Bar: Engulfing patterns is used to find potential reversals in the market and they are (bullish and bearish) most effective on the higher time frames. An engulfing candle (low to high) completely engulfs the previous candle (low to high) which means the earlier candle is completely contained within the following (engulfing) candle's range. Engulfing pattern must have to be formed at a swing high or low if it is found below the daily time frame, it should be ignored. There are two types of engulfing bars.
Bullish engulfing bar: When the market is exhausted, and the sellers begin to book profits then bullish engulfing bar forms (after an extended move down). At that point, buyers start to take control of the market and begin to push the market higher. There are different ways to trade Engulfing Pattern. A trader can place a buy trade once the candle closes or can wait for the price come back to support level.
The following conditions need to be checked to trigger the entry.
1. Bullish engulfing bar
2. Swing low
3. Broken resistance level or strong bounce back from the support level
4. The chart is on the daily time
5. A good risk-reward ratio is found
The first two conditions are obvious when trading this candlestick reversal pattern, but the third requirement may not be found all the time. The effectiveness of this pattern relies on the bullish sentiment in the market. So, the conviction becomes much stronger by combining the pattern with a broken resistance level or a bounce back from the support level. A pending order can be placed 5-10 pips above the support level, or the 50% Entry Strategy already described in the Pin bar trading strategy can be used. Finally, a trader needs some room to set the target.
Bearish Engulfing Pattern
Bearish engulfing pattern is just the opposite of bullish engulfing pattern which forms after an extended move up and signals exhaustion in the market. If only the body of the engulfing bar engulfs the previous candle, then that would be an extremely effective and viable trade entry.
The following requirements must be considered for a valid setup to make a probable high trade with a success rate above 50% and a good risk-reward ratio.
1. Bearish engulfing candle on the daily time frame
2. A swing high
3. A retest from the key level
The best way to trade these patterns is to combine them with a break or retest of a key level at a swing high. That means we need a key level to confirm the confluence factors. A pending order can be set 5-10 pips below the resistance level, or the 50% Entry Strategy that has already been described earlier can be used. In bearish pattern the stop loss must be placed above the engulfing bar’s high and for bullish pattern the stop loss must be placed below the engulfing bar’s low to avoid any uncertain spike and noise of the market.
Support and Resistance Level: The support and resistance are the levels at which traders find a price to be overvalued or undervalued. These levels represent areas in the market where traders are more willing to buy or sell, and they look for price action buy or sell signals such as the pin bar. The support is termed as the floor of the price level at which it difficult for a price to fall below. It is the level where buyers are likely to enter the trade. Resistance is termed as the ceiling of a price and it is difficult to break through it and eventually it may decrease soon after. The more times the price fails to break through the price levels, the more formidable that area becomes. The major resistance is the highest, whereas the major support is the lowest. Support and resistance are lines or levels on a technical chart that indicate the highest and lowest points within a specific time/time frame. Every point at which a market turns is known as support and resistance levels. These levels produce clear indications of where the market will change direction and create clear opportunities to buy or sell. To draw support and resistance lines/levels on a chart, one must identify past levels as the market tends to move towards past support and resistance levels. These levels can be found in any time frame.
Support and resistance levels are significant because these levels will be used in combination with other technical analysis tools. If these levels are figured out in the chart, a trader needs to wait and watch for a confluence buy or sell signal to develop. Although support and resistance levels aren't always exact levels, they are often considered areas or zones, or levels on the chart. Because neither these levels do not always align with the highs and lows, nor does the market always respect them. So instead of waiting for the key levels to line up perfectly with highs and lows, a trader needs to focus on if the levels are at a place in the market that achieves the most touches on either the bullish side or bearish side of the level. Other technical analysis tools like the confluence must be used as a confirmation that if the level is likely to hold or break.
Trend Lines: Trend line indicates who are (buyers and sellers) in control of the market. Whenever a market moves in the similar direction (uptrend or downtrend) simultaneously within a specified period of time, it builds a trend. It is the best way to determine a trend's strength because it tests various swing high and low levels in the market and indicates whether momentum is strengthening or weakening. The trend lines must be drawn perfectly to find setups with momentum. Although it takes a ton of practice, a trader can master it over time. To illustrate it correctly, traders need to keep charts free of clutter. It's not easy to draw a trend line. But after a few years of practice, one can begin to see patterns without much effort, and it becomes automatic. As soon as traders look at the chart, their minds subconsciously plot levels. Trend line and price action help understand the market's movement and validate the key areas. The time span of a trend line can last from one month to several years. A long-term trend lasts for five or more years, also called a secular trend. Whereas an intermediate trend lasts for one year or longer, also called the primary trend. A short-term trend continues for a few days to a few months, also called a secondary trend. Trend lines are only helpful if placed correctly; otherwise, we might miss opportunities even traders get caught on the wrong side of a market.
Trading Strategies of a Trending Market: A market that makes higher highs succeeded by higher lows (bullish) or lower lows succeeded by lower highs (bearish) is referred as a trending market. Trend line might be different in different timeframes; there may be a downtrend in the weekly time frame but an uptrend in the 1-hour chart. So the higher timeframes provide a better outlook. Trading with a trend line is comparatively easy. Within a given trend, the extended swing highs and lows needs to be observed closely. Although multiple retests of the identical level make it detectible but it also make it weaker with each additional retest. Because when a market continually revisits the same area within a short time, it eventually breaks the level. Once the market begins to cluster at a key level for an extended period, then the chance becomes imminent that the trend is about to break up or down as soon as possible. The most common mistake while plotting a trend line is cutting off the extreme highs or lows of the wicks of candles. By doing this, a trader increases the chance of being caught by a false break. Because the highs and lows formed there has a good reason, and they should always be respected. Becoming proficient at drawing trend lines takes practice and an obscene amount of screen time.
Forex News and Events: The news comes every day. Without news, the Forex market would not make such moves as we experience today. News influences traders' bullish or bearish sentiment on the market, which creates volatility, and people get the opportunity to buy and sell. The high-impact events are scheduled, which helps organize a trading activity in a way that doesn't put a trader at risk for adverse reactions. But traders would never use the result of an event to form a trading decision rather they will rely on market movement.
When it comes to trading the news, a trader has one of the three choices;
1. The first is to watch the result of news like non-farm payroll reports, interest rates, or unemployment rates. And with this information in hand, a trader pulls the trigger without any delay.
2. The second is to front-run the news. Traders would attempt to outsmart the market by buying or selling ahead of high-impact news or event.
3. The third is to use the resulting price action to formulate a trading decision.
The best way to trade news is to sit on the sideline and wait for the noise to settle. Then once all of the noise is gone, a trader moves on the higher time frames and makes trading decisions. It is not essential to take a trade, even to leave with a whole lot of nothing, which means not to trade. Because sometimes the best trade is not to trade. It is essential to know when events are happening, and their potential impact on the currencies a trader is trading.
Risk Management of Confluence Strategy
We must be able to manage our risks to maintain our wealth. Risk management focuses on consistent growth and understands that trading the forex market is a marathon and not a sprint. We must be disciplined with our risk management and follow our rules every single day of our life. It is one of the key elements in the forex industry.
Rules for successfully managing risk.
1. Risk must be appropriately calculated before entering a trade
2. Asia session would be avoided for trading as it creates a trap.
3. Maximum 2 or 3 positions per day would be taken.
4. The Risk-Reward Ratio would be 1:2 minimum.
5. Stop-loss areas would be placed logically.
6. A losing trade would be re-analyzed in the chart to determine the actual reason.
A lot of traders fail because they can’t respect their own risk management. Sometimes traders avoid the trading rules and trade bigger, which ultimately put them in trouble. In trading, a trader is the only one who’s deciding how much to risk- 1, 2, or 3% per trade. Many traders who're failing think that the only reason they are losing is because of their trades. In fact, most of those trades are pretty good at analyzing charts, but they're not good at following the fundamental rules like risk management and using the ideal lot size.
Calculating Risk
1. Step A: Identify a percentage of the trader's account that a trader is willing to risk. The ideal risk percentage is usually 2% of the account balance.
2. Risk Amount: % Risk * Account Balance
3. Step B: Identifying the entry and stop-loss placement areas.
4. Step C: After a trader knows the stop loss level, the next task is to calculate the lot size/position size per trade to a specific pip amount based on the stop loss.
Lot Size Determination
Lot size: risk amount per trade/ (Stop Loss * 10)
For example, a trader has a 10 000$ account and decides to risk 3%. So, the risk amount is 300$. Let’s assume the stop loss is 50 pips., This formula is used to find the correct lot size:
1. Risk amount / by the stop loss size
2. 300$ (RISK) / 50 (pips SL) = 6$ per pip
In the case of a standard account, a trader needs to place a trade with 0.6 lot, which will result in a 6 USD profit or loss in each pips movement.
If a trader has a 6 000$ account and decides to risk 2% per trade. So, the risk amount is 120$. If the SL is 30 pips, then the formula would be-
120$ / 30 (PIPS) = 4$ per PIP
In the case of a standard account, a trade will be placed with 0.4 lot, resulting in 4 USD profit or loss in each pips movement.
Risk to Reward Ratio
If the risk to reward ratio is 1:5.45, this means there is a chance to gain 5.45 times more than the risk, so if the risk is 13.7 pips, then the possible gain would be 74.7 pips. If the risk-reward ratio is 1:3, the potential gain is three times more than the risk. If the account balance is 1000 US dollars and maintains a 1:5.45 risk-reward ratio, the account balance at the end of the trade might increase by 74.7 USD, making the new account balance USD 1074.7.
Calculating Percentage Change
Percentage increase/decrease formula:
((New Balance – Old Balance)/ Old Balance))* 100
So, our percentage increase would have been (Based on 1000 USD Account Balance)
((1074.7-1000)/1000)* 100 = 7%
Step By Step Trade Set Up of Confluence Strategy
Step 1: Open the MT4 platform and move to a higher time frame like daily, weekly and monthly.
Step 2: Draw all possible support and resistance levels
a. Candle’s support and resistance
b. Trend line’s support and resistance
c. Chart Pattern’s support and resistance
Step 3: Evaluate market direction or trend direction.
Step 4: Look for price action patterns and candlesticks formation in H1, H4, and Daily timeframe.
Step 5: Check ongoing and upcoming high impact news and events and analyze their impact on the market
Step 6: Determine entry, take profit and stop loss (exit) point, and plan active or pending trades.
Step 7: Determine trade lot/volume and calculate and manage risk.
Step 8: Stay stick to the plan and maintain a trade journal
Trade Result Analysis of Confluence Strategy
The result shows that the 'Confluence of Technical Analysis' strategy performs better than any of the established trading strategies and resulted in around 76% profit in 5 months with the least drawdown rate. The other performance metrics are as follows:
a) Test Started: Jan 04, 2021
b) Test Ended: Jun 01, 2021
c) Gain: +76.66% (Daily: 0.39%, Monthly: 12.23%)
The daily profit was 0.39%, and the monthly gain was 12.23%. It is expected that the yearly profit might be 183.16%.
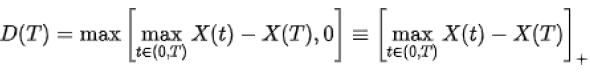
d) Drawdown: Drawdown is the measure of the decline from a historical peak during a specific period for an investment. Somewhat more formally, if  is a stochastic process with X (0) = 0, the drawdown at time T denoted D (T) is defined as:
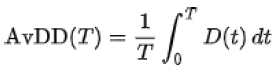
The average drawdown (AvDD) up to time {T} is the time average of drawdowns that have occurred up to time {T}
The maximum drawdown (MDD) up to time {T} is the maximum of the drawdown over the history of the variable. More formally, the MDD is defined as:
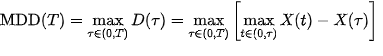
In the test, the drawdown is: 15.11%
Balance: $1,766.59
Profit: $766.59
Deposits: $1,000.00: The initial deposit was 1000 USD, and a maximum of 2% risk per trade was taken. At the end of the test, the profit was 766.59 USD, and the ending equity was 1766.59 USD.
Timeframe: In confirming a trade, almost all the timeframes (M5, H1, H4, D, and W) were analyzed, but the major trading decision came from H1 confluence factors.
Total Number of Trades:
The total number of trades executed in the specified period was 96.
Profitability (How many trades were won?): Won 83 out of 96 trades, which represents 86%. Lost 13 out of 96 trades, which represents 14%.
Pips: The net pips gain during the test period was 76659.0
Average Win: 1871.42 pips / $18.71
Average Loss: -6051.46 pips / -$60.51
Out of 96 trades, 83 trades were closed with profit with an average win of 1872 pips or 18.71 US Dollars per trade, whereas 13 trades were closed with the loss with the average loss of 6051 pips or 60.51 US Dollars per trade.
Longs Won: (40/46) 86%
Shorts Won: (43/50) 86%
Out of 96 trades, 46 trades were long or buy trades, out of which 40 were closed with profit, and 6 were closed with loss. And out of 96 trades, 50 trades were short or sell trades, out of which 43 were closed with profit and seven were closed with loss.
Best Trade ($): (May 04) 72.90
Worst Trade ($): (Jan 28) -100.00
During the five-month test period, the best trade-in terms of monetary gain were 72.90 USD, and the worst trade in terms of economic loss was 100 USD
Best Trade (Pips): (May 04) 7290.0
Worst Trade (Pips): (Jan 28) -10000.0
During the five-month test period, the best trade-in terms of pips gain were 7290 pips, and the worst trade-in terms of pips loss were 10000 pips.
Avg. Trade Length: Some trades reached the expected profit level in 5 minutes, and some trades even took 2-3 days. But the average trading length per trade is 1 hour 32 minutes.
Profit Factor: Profit Factor shows how many times the gross profit (Sum of all the winning trades) exceeds the gross loss (Sum of all the losing trades). The higher the value, the better). The formula is:

In this strategy, the profit factor is: 1.97
Standard Deviation: Standard deviation is a statistical measure of volatility that shows how much variation or dispersion there is from the mean (expectancy. In this strategy, the standard deviation was $31.44.
Sharpe Ratio: Sharpe Ratio is used to characterize how well the return of an asset compensates the investor for the risk taken. The higher the value, the better). It is initially called the "reward-to-variability" ratio. The definition is:
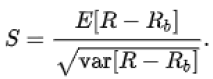
Rf is a constant risk-free return throughout the period,
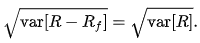
In this test, the Sharpe Ratio is: 0.2600
Z-Score
Z-Score is used to calculate a trading system's ability to generate wins and losses in streaks. It enables us to see if the streaks generated are of a random pattern or not). The formula is:
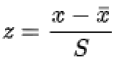
a) μ is the mean of the population.
b) σ is the standard deviation of the population.
In this test, the Z-Score is 0.90 (63.18%)
Expectancy
Expectancy tells what we can expect to make (win or lose) on every trade. In this strategy, the expectancy was 798.5 Pips / $7.99
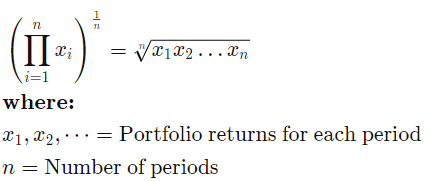
AHPR
Arithmetic Average Holding Period is the average holding period return. The Formula for Arithmetic Average:
Where:  =Portfolio returns for period n
n=Number of periods
In this strategy, the AHPR is: 0.63%
GHPR
Geometric Average Holding Period is the geometric holding period return. A system having the largest GHPR will make the highest profits if compounded. A GHPR<O% means that the system will lose money if compounded. The Formula for Geometric Average is:
In this strategy, the GHPR is: 0.59%
Marketability Analysis
In the long run, a good trading system is a prerequisite to attaining success from Forex Market, and it needs to be simple and easy to follow and execute. To assure profitability and earn a stable income as a Forex trader, one will definitely want to choose a successful trading system. The confluence of technical analysis strategy will suit traders' lifestyles, risk tolerance, and personality type irrespective of gender and geographic location. The main focus of this strategy is to eliminate the losing trades and achieve more successful trades Table 1.
| Table 1 Comparison of Performance Among the Various Types of Forex Trading Systems | ||||||
| Performance Metrics | Confluence of Technical Analysis | Martingale Matrix | Retracement Trading | Technical Indicator | Grid Trading | Momentum trading |
| Gain | +76.66% | +28.44% | +36.12% | +9.23% | +11.54% | 17.27% |
| Drawdown | 15.11% | 32.02% | 23.64% | 21.75% | 31.31% | 24.11% |
| Profit Factor | 1.97 | 1.65 | 1.21 | 1.17 | 0.97 | 1.45 |
| Standard Deviation | $31.44. | $72.69 | $32.44 | $19.16 | $9.02 | $12.17 |
| Sharpe Ratio | 0.2600 | 0.0000 | 0.0000 | 0.0000 | 0.0000 | 0.0000 |
| Z-Score | 0.90 (63.18%) | -55.01 (99.99%) | -23.18 (99.99%) | 0.14 (11.13%) | -14.59 (99.99%) | -15.90 (99.99%) |
| Expectancy | 798.5 Pips / $7.99 | 4.3 Pips / $1.80 | 9.6 Pips / $10.68 | 3.3 Pips / $18.93 | 1.4 Pips / $2.26 | 10.4 Pips / $20.26 |
| AHPR | 0.63% | 0.01% | 0.06% | 0.10% | 0.03% | 0.25% |
| GHPR | 0.59% | 0.01% | 0.06% | 0.10% | 0.03% | 0.25% |
In analyzing the marketability of this strategy, some key metrics (trade gain %, drawdown rate, profit factor, standard deviation, Sharpe Ratio, Z-Score, expectancy, AHPR, GHPR) of Confluence of Technical Analysis is compared with some other popular trading strategies in a given period of time. Traders, investors, economists, and academicians are all searching for a trading system that ensures sustainable profit over a long time. But history was never so kind to them. A holy grill in forex trading is still unattainable. However, Confluence of Technical Analysis is somewhat a little addition to that search process. It might open a new era to the technical forex traders. The system is manual and shows more than 76% profit in 5 months, which is more than 180% in a year. The drawdown rate is very low, ensuring capital protection in a highly volatile market situation. An easy-to-follow risk management strategy for this system is also described earlier. So, considering all the factors and analyzing the trade- related data, it depicts a clear picture that this system is marketable, and traders from around the world will find it valuable and worthy to purchase.
Conclusion
In conclusion, the marketability of a trading system designed for the Forex market is analyzed during the most critical period of the pandemic, the first half of 2021. Although no trading system or strategy works all the time and results in profit for everyone, the trading system tested in this paper on the financial market, particularly the Forex market over five months, showed outstanding performance, making around 180% profit in a year. The experiments prove that the confluence of technical analysis contributes to increasing the accuracy of price forecasting and should be incorporated more in the research in the forex market. Due to the changeable characteristics of the market and as a part of future research, this strategy will be expanded into other currencies and asset classes, including commodities. In addition to that, we would like to incorporate some well-known chart patterns like Head and Shoulders (H&S), Triangles, Double top-bottom, Wedges, and Pennant or flags with our system.
Conflict of Interest
We know of no conflicts of interest associated with this publication.
References
Aliu, F., Bajra, U., & Preniqi, N. (2021). Analysis of diversification benefits for cryptocurrency portfolios before and during the COVID-19 pandemic. Studies in Economics and Finance, ahead-of-print.
Indexed at, Google scholar, Cross Ref
Aymen Ben Rejeb, M. (2015). Return dynamics and volatility spillovers between forex and mena stock markets: What to remember for portfolio choice. Journal of Stock & Forex Trading, 04(02).
Indexed at, Google scholar, Cross Ref
Baker, H.K., & Puttonen, V. (2019). Trap 7: Engaging in gambling disguised as investing. navigating the investment minefield, emerald publishing limited, Bingley, 159-175.
Indexed at, Google scholar, Cross Ref
Chang, Y.H., Jong, C.C., & Wang, S.C. (2017). Size, trading volume, and the profitability of technical trading. International Journal of Managerial Finance, 13(4), 475-494.
Indexed at, Google scholar, Cross Ref
Crescenzio, G. (2014). The forex market in practice: a computing approach for automated trading strategies. International Journal of Economics and Management Sciences, 3, 169.
Indexed at, Google scholar, Cross Ref
Fanning, D. (1979). Technical analysis: forecasting or fortune telling. Managerial Finance, 5(1), 29-41.
Indexed at, Google scholar, Cross Ref
Hesketh, B.C.J. (1978). To what extent can forecasters out-predict the forward markets: The Track Record of Forex Research. Managerial Finance, 4(2), 143-154.
Indexed at, Google scholar, Cross Ref
Jan, J.H., & Gopalaswamy, A.K. (2019). Identifying factors in currency exchange rate estimation: a study on AUD against USD. Journal of Advances in Management Research, 16(4), 436-452.
Indexed at, Google scholar, Cross Ref
Kalsoom, U., Javed, S., Khan, R.U., & Maqsood, A. (2021). Stock market flexibility during COVID-19 pandemic: Evidence from Pakistan. Journal of Economic and Administrative Sciences.
Indexed at, Google scholar, Cross Ref
Ling, P.S., Abdul-Rahim, R., & Said, F.F. (2020). The effectiveness of technical strategies in Malaysian Shariah vs. conventional stocks. ISRA International Journal of Islamic Finance, 12(2), 195-215.
Indexed at, Google scholar, Cross Ref
Papadamou, S., & Tsopoglou, S. (2001). Investigating the profitability of technical analysis systems on foreign exchange markets. Managerial Finance, 27(8), 63-78.
Indexed at, Google scholar, Cross Ref
Ramlall, I. (2016). Main features of technical analysis. Applied technical analysis for advanced learners and practitioners, emerald group publishing limited, Bingley, 1-29.
Indexed at, Google scholar, Cross Ref
Rudik, N.I. (2013). The encyclopedia of the indicator RSI (Relative Strength Index). Corporate Governance, 13(2), 218-219.
Indexed at, Google scholar, Cross Ref
Smith, D.M., Faugère, C., & Wang, Y. (2014). Head and shoulders above the Rest? The performance of institutional portfolio managers who use technical analysis. Research in Finance, 29, 167-189.
Indexed at, Google scholar, Cross Ref
Uddin, C. (2021). Analyzing the effectiveness of confluence of price action disciplines in forex market. Journal of Stock & Forex Trading, 9, 570.
Yong, Y.L., Ngo, D.C., & Lee, Y. (2015). Technical Indicators for Forex Forecasting: A Preliminary Study. ICSI.
Indexed at, Google scholar, Cross Ref
Yoon, D. (2021). Technical feasibility analysis model. Preliminary feasibility for public research and development projects. emerald publishing limited, Bingley, 59-69.
Indexed at, Google scholar, Cross Ref
Yuan, C. (2012). How to make informed decisions in forex trading? Journal of Stock & Forex Trading, 01(01).
Indexed at, Google scholar, Cross Ref
Received: 30-Dec-2021, Manuscript No. AAFSJ-22-10702; Editor assigned: 01-Jan-2022, PreQC No. AAFSJ-22-10702(PQ); Reviewed: 15-Jan-2022, QC No. AAFSJ-22-10702; Revised: 21-Jan-2022, Manuscript No. AAFSJ-22-10702(R); Published: 28-Jan-2022