Research Article: 2018 Vol: 22 Issue: 2
Persistence in Liquidity Measures: Evidence from India
Sharad Nath Bhattacharya, IIM Shillong, India
Mousumi Bhattacharya, IIM Shillong, India
Keywords
Long Memory, Liquidity, Hurst Estimate, Rescaled Range, Semi-Parametric GPH Statistic, Fractional Integration, Spectral Regression.
Introduction
Liquidity is an important consideration in any investment decision as investors normally claim liquidity premium when they expect the liquidity options for their investment may affect their investment return. The seminal work of Amihud and Mendelson (1986) attributed towards building a consensus on the relationship between illiquid assets and return premium. Liquidity is exigent in financial market-related research and an important consideration in asset pricing. In general parlance, the liquidity of a financial asset is its ability to be traded quickly without distorting the market price. A liquid market is the one which has a large number of buyers and sellers with their buy and sells orders and price, the cost of the transaction is minimal, and price volatility is low. Liquidity is a multidimensional concept, and it changes with asset class and type of markets. The tightness (low bid-ask spread or transaction cost), immediacy (speed of execution of order indirectly measuring the efficiency of the system), breadth (presence of ample voluminous orders), depth (ability to withstand large orders without price impact with volumes of pending buy and sell orders) and resiliency (ability to bounce back from temporary distortion in price and orders) of a financial market are often studied and analysed for explaining liquidity. These dimensions are overlapping to some extent and proxies used in empirical studies to measure them often measure them jointly. The liquidity of financial markets around the globe substantially varied over time, and the uncertainty and volatility of market liquidity is an important source of risk for investors. The issue of liquidity predictability in Indian stock market is explored through the existence of long memory or long-range dependence in multiple dimensions of liquidity. Long range dependence suggests nonlinear structure in the underlying data series. Such long-range dependence structure indicates that the parameter represented by the data series can be predicted. In the presence of long memory, application of standard linear econometric techniques for modelling and forecasting is challenged as it may lead to biased inferences. The impression of unpredictable stock returns is deep-rooted and long-standing in the world of finance. It means that stock returns do not exhibit long memory and no pattern can be extracted from the behaviour of stock prices that can be used for forecasting and to formulate trading strategies for abnormal gain. The burgeoning work on the existence of long memory in returns and volatility of financial markets is well documented in Bhattacharya and Bhattacharya (2012, 2013) and Hull and McGroarty (2014). However, similar studies on the liquidity of stock markets are limited, especially in the context of emerging countries.
Persistence or long-range dependence has been elucidated by researchers in time domain – how has been its development over time and in the field of spectral analysis – how has been its response to sinusoidal waves of different frequencies. In spectral analysis, the long memory is described in terms of rates of explosions of low-frequency spectra. When the pole of the spectrum is at very low frequencies and has an exponential decline with an increase in frequency, it is indicative of the existence of long memory. In the time domain, it is described as an exhibition of persistent autocorrelations with very slow decay at a hyperbolic rate. Parzen (1981) argued that a stationary process {xt , t = …, -1, 0, +1 …} with auto covariance function 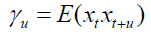 may be termed as long memory process if
 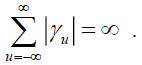 In the presence of long memory in liquidity measures, asset pricing may be done more efficiently as the price for liquidity or liquidity premium can be determined more effectively. This paper examines for the presence of long memory in various liquidity parameters – market depth, breadth, tightness, immediacy and resiliency as it has important consequences not only for investors who would like to know the liquidity premium but also for corporate finance managers interested in estimating estimate the cost of capital.
The remainder of the paper is organised as follows. Section 2 provides the relevant literature. The data and methodology are explained in section 3. Section 4 presents the empirical results and the discussion. Section 5 concludes the paper.
Literature Review
In their seminal work, Amihud and Mendelson (1986) established the relation between bid-ask spread and expected return. The nexus between the stock market and its liquidity is well researched in the empirical finance literature. The notion that liquidity negatively affects the stock market returns were supported by Chordia et al. (2001), Pastor and Stambaugh (2003) and Moore and Sadka (2006) for different markets. Acharya and Pedersen (2005) noted that persistent negative shocks to a financial asset’s liquidity results in low current returns but high future returns, and vice versa. Faff et al. (2010) supported the negative relationship but evidenced that liquidity is significantly priced only during the expansionary phase of business cycle. However, Martinez et al. (2005) observe a positive relationship between the Amihud (2002) illiquidity measure and returns in both the unconditional and conditional asset pricing models but the negative relationship in only the conditional asset pricing model using liquidity measures proposed by Pastor and Stambaugh (2003). Contrary to Amihud and Mendelson (1986), they did not find any relationship between bids-ask spread and return in the Spanish market. Bali (2014) noted that the negative association between liquidity and expected return might not hold in inefficient markets where stock prices do not reflect available information due to the presence of market imperfections. The positive relation between liquidity and stock returns was evidenced by Batten and Vo (2014) for emerging equity markets. While importance of liquidity in hedging and financial risk management practises are well documented in Das and Hanouna (2009), Acharya and Schaefer (2006), it's even bigger and significant role in initiating and transmitting financial crises is observed by Borio (2004), particularly in the most recent episode (Brunnermeier 2009, Gorton 2009).
In the Indian context, liquidity patterns were studied by Krishnan and Mishra (2013) for the entire equity market and by Kumar and Mishra (2015) for individual stocks. Using machine learning tools, Bhattacharya et al. (2016) documented various degrees of positive association between liquidity and return and noted the order of importance of selected liquidity dimensions in explaining stock market returns.
Empirical research on long memory in asset returns and volatility is quite voluminous. Hurst (1951) documented the statistical long-memory processes, and Greene and Fielitz (1977) used the Hurst exponent to claim that the return from stocks or indices displays long memory. Geweke and Porter-Hudak (1983) (GPH) proposed a semiparametric long memory parameter that is not preconditioned on short memory specifications. Lo (1991) improved on the Hurst statistic to distinguish between long and short memory. Although Lo’s statistic continues to spark debate for its low success when the data series have low memory, it is in the analytical toolkit of researchers and practitioners since last two decades. Robinson (1992) improved over the methodology of GPH and used averaged periodogram for more stable long memory parameter. Cajueiro and Tabak (2004) evidenced greater long memory in Asian markets than in Latin America. Presently there is considerable evidence in support of the long memory stochastic volatility in stock returns. Bhattacharya and Bhattacharya (2012, 2013); Hull and McGroarty (2014) provides a decent summary of long memory in asset returns and volatility.
The existing literature on the presence of long memory or predictability of market depth, breadth and other forms of liquidity parameters is insufficient. Campbell et al. (1993) evidenced a significant relationship between aggregate stock market trading volume and the serial correlation of daily stock returns. Bollerslev and Jubinski (1999), have shown that both volume and volatility have long-run dependence while Tsuji (2002) reveal the evidence of long-term memory in liquidity, volume, and volatility using rescaled range analysis. Avramov et al. (2006) noted the multi-facet relationship between liquidity of individual stocks and its autocorrelation function. Using Hurst exponent, evidence of long memory in the frequency and the size of consecutive transactions were reported by Eisler and Kertész (2007). Mike and Farmer (2008) provided evidence from London stock exchange that fluctuations in absolute returns follow power laws. Bariviera (2011) observed that long memory parameter is positively correlated with market capitalization but negatively with an average daily turnover. To the best of our knowledge, this is the first attempt to explore the long memory dynamics in stock market liquidity in the Indian context and augment the literature concerning the emerging markets. Given its economic liberalisation coupled with strong economic growth, capital market reforms, the growth of the stock market and increased financial Institutional investors interest, Indian stock market appears to be an interesting choice for examining predictability in stock market liquidity.
Data and Methods
Five aspects of a liquid stock market as discussed before are considered in the study and selection of the variables are based on empirical evidence. Following Amihud and Mendelson (1986) and Korajczyk and Sadka (2008), the trading frequency is captured using trading volume and the turnover rate as measures of liquidity. Datar et al. (1998) noted that liquidity and trading frequency are highly correlated in equilibrium. The trading volume is considered to measure the existence of numerous market participants and transactions. The turnover rate is measured as monthly trading volume divided by market capitalization. Narayan and Zheng (2011) argued that trading probability is an important measure of market liquidity and it captures the effect of non-trading aspect of illiquidity by examining the number of zero trading volumes. The measure (trading probability) takes the form of the probability, on any particular trading day, of the market is open and stocks are traded on that day. The measure aims to capture the trading continuity (or speed dimension of liquidity). Similar to Narayan and Zheng (2011), this paper considers trading probability as 1/ (1 + the number of nontrading days in a month) and the spread (high minus low) as a proxy for transaction costs. Although the literature is full of studies with bid ask spread, we observe that Corwin and Schultz (2012) showed under realistic conditions, the correlation between high-low spread estimates and bid ask spreads is about 0.9. Hence in this study we define spread as high minus low which possibly makes more sense in the context of stock markets rather than individual assets. Additionally, market efficiency coefficient (MEC) as proposed by Hasbrouck and Schwartz (1988) is used for resiliency. MEC measures the impact of execution costs on price volatility over short horizons and compares the long-term variance with the short-term variance.Thus, MEC distinguish short-term from long-term price changes. Price movements are expected to be more continuous in liquid markets, even if new in-formation influences equilibrium prices and consequently, for a given permanent price change, the transitory changes to that price should be minimal in resilient markets. The variance of transaction prices is expected to be smaller in a liquid market. MEC captures this and is calculated as
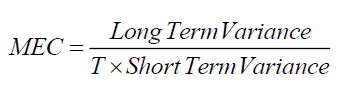
where T be the number of sub-periods into which longer periods of time can be divided. Five days are considered as short period and 30 days as long period, i.e., T=6. When MEC is less than one but close to it, it suggests that the market is resilient and minimum price volatility is expected.
The study focuses on Bombay Stock Exchange (BSE) and considers the composite index BSE 500. All liquidity measures are calculated from the BSE 500 statistics. The idea is to consider a well-diversified index so that it consists of companies of different market capitalization and categories (types). Turnover volume and spread have been considered in their natural logarithmic form.
The presence of unit root is explored using standard Augmented Dickey-Fuller (ADF) test and Phillips-Perron (PP) test. Then both the classical version and modified version of rescaled range (R/S) analysis is performed to obtain HM classical statistic and Lo’s estimate. Finally, the paper looks for fractionally integrated parameters (as proposed by Geweke and Porter-Hudak (1983) as well as its modified version) to assess the presence of long memory. The above tests were applied on each of the liquidity measures and are detailed below.
Rescaled-range (R/S) Analysis
The HM R/S statistic is the range of partial sums of deviations of times series from its mean, rescaled by its standard deviation. Hence, if r(t) denotes any particular liquidity measure at time t and  represents its mean and is given by
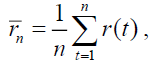 where ‘n’ is the time span considered, the rescaled range statistic is given by
 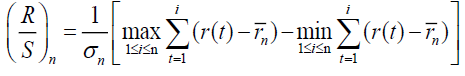 Here, the minimum of the partial sums of the initial i deviations from the sample mean is deducted from the maximum of the partial sums, resulting in a range (essentially nonnegative,
 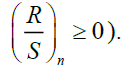 There is no a priori distributional assumption in the rescaled analysis. The critical values of the statistic are as given in Lo, 1991, Table II.
A drawback of the R/S analysis is that its measure of long-range dependence is affected by short-range dependence that may be presented in the financial data. Hence the paper considers estimating modified R/S statistic proposed by Lo (1991).
Modified Rescaled Range (R/S) Analysis
Although widely used in empirical research, the above statistics have been challenged for its possible inability to distinguish between short and long memory. Therefore Lo (1991) version of rescaled range analysis is used here. Using Barlett window, Lo (1991) was able to nullify or lessen the effects of short memory and provided a more stable estimate Qn, defined as

 represents the sample autocovariance of order j and weight
 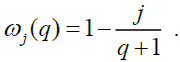 As the findings may be sensitive to the choice of the lag length q, Andrews (1991) method was followed for the selection of the lag length.
The Spectral Regression Method
In the functional domain, a spectral density function of the form 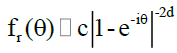 is often used to detect long memory where the long memory parameter d is obtained transforming the above function into a simple regression based on the periodogram. Here, GPH approach is employed using the following equation:
  where I(θ) is the jth periodogram point;
 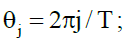 T is the number of observations;
 is a constant; and
  is an error term, asymptotically i.i.d. However, when the error term follows an AR(1) or MA(1) process, the GPH estimates may be biased (Agiakloglou et al. 1992). Therefore Robinson (1992) estimate using discretely averaged periodogram were considered to improve precision. In both the cases, the number of Fourier frequencies
  with 0 < μ < 1 is included in the spectral regression and is an increasing function of T. As the findings are sensitive to the choice of periodogram ordinates M, the paper uses several values of the bandwidth parameter
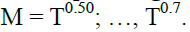
Results And Discussion
Table 1 provides the descriptive analysis of the liquidity parameters chosen for Indian stock market.
| Table 1: Descriptive Statistics Of The Liquidity Measures | |||||
| Trading Probability | Spread | MEC | Trading Volume | Turnover Rate | |
|---|---|---|---|---|---|
| Mean | 0.094664 | 6.068118 | 0.604999 | 22.66242 | 0.030835 |
| Median | 0.090909 | 6.210477 | 0.452632 | 22.97138 | 0.021331 |
| Maximum | 0.125000 | 7.960882 | 2.743613 | 23.87515 | 0.110331 |
| Minimum | 0.071400 | 3.812203 | 0.085072 | 20.59009 | 0.003605 |
| Std. Dev. | 0.010997 | 0.736920 | 0.460963 | 0.785886 | 0.028400 |
| Skewness | 0.104115 | -0.617589 | 1.523501 | -0.945719 | 0.884857 |
| Kurtosis | 2.356526 | 3.350915 | 5.630529 | 2.897384 | 2.556692 |
| Jarque-Bera | 3.125694 | 11.26684 | 110.7267 | 24.51846 | 22.74412 |
| Probability | 0.209539 | 0.003576 | 0.000000 | 0.000005 | 0.000012 |
The descriptive statistics gives the central tendency, range, deviation, skewness, kurtosis and Jarque Bera statistics that test for the normality of each of the measures of liquidity. The standard deviation of turnover rate appears to be very high when compared to its mean value highlighting volatile price and order flow. While trading probability, MEC and turnover rate are positively skewed, spread and trading volume are negatively skewed. The kurtosis of spread and MEC is greater than three suggesting the presence of more outliers than that of a normal distribution. The assumption of normality could not be rejected for trading probability but rejected for all other liquidity measures as per Jarque Bera statistics.
| Table 2: Findings Of Unit Root Tests: Adf And Pp | ||
| Liquidity Measures | ADF | PP |
|---|---|---|
| Trading Probability | -11.78*** | -15.26*** |
| Spread | -3.27** | -5.15*** |
| MEC | -13.61*** | -15.26*** |
| Trading Volume | -2.07 | -1.77 |
| Turnover Rate | -1.56 | -1.86 |
Table 2 presents the findings on the stationarity of the liquidity measures using Augmented Dickey-Fuller test and Philip Perron test. While Trading probability, spread and MEC were found to be stationary, Trading volume and Turnover rate appear to be non-stationary in nature. Intuitively, stationary stochastic processes should not have a long memory. However, it is not necessarily the case in many areas of application. Empirical evidence and explanations on using long memory-based models on non-stationarity data by Mandelbrot (1983), Heyde and Yang (1997), Berg-Sørensen and Flyvberg (2005) are significant. Samorodnitsky (2006) provides an impressively organised discussion on long-range dependence in presence and absence of unit root. Consistent with above referred empirical discussions, the tests for the long memory parameters in all the measures of liquidity are done.
| Table 3: Rescaled Analysis: Hm Classical R/S Statistic And Lo Statistic | ||
| Liquidity Measures | HM Classical R/S Statistic | Lo Statistic |
|---|---|---|
| Trading Probability | 0.843** | 0.849** |
| Spread | 4.09 | 1.86** |
| MEC | 0.763* | 0.764 * |
| Trading Volume | 5.26 | 2.07* |
| Turnover Rate | 5.35 | 1.08*** |
Table 3 displays the estimated long memory statistics obtained through rescaled analysis. Long memory is present in all the liquidity parameters as per Lo Statistic while the classical HM R/S Statistic did not reject the null hypothesis of no long memory in spread, trading volume and turnover rate suggesting market depth, breadth and resiliency to some extent may not have predictable component. However, the classical R/S statistic has often been challenged on the ground of its apparent inability to distinguish between long and short memory and its possible biased results in the presence of short-range dependence and nonstationarity. Using Lo statistic as suggested by Nath (2001), we argue that market traders and other market participants may predict market resiliency, spread and trading continuity in the stock market and pricing of the liquidity premium in stock returns is expected to follow some predictable path. Moreover, the trading volume and turnover rates appeared non-stationary as per unit root tests and insignificant Lo statistics shows that market depth and breadth may not have memory and thus prediction about the execution of bulk orders especially during contract expirations may not possible. For more consistent findings, estimates of the fractionally differencing parameter are obtained as proposed by Geweke and Porter-Hudak (1983) and as suggested by Robinson (1995). The findings are available in Table 4.
| Table 4: Gph Estimate Of Fractional Differencing Parameter (D) | ||||||
| Liquidity Measures | M=T0..50 | M=T0. 55 | M=T0. 60 | M=T0.65 | M=T0.70 | M=T0.75 |
|---|---|---|---|---|---|---|
| Trading Probability | -0.91*** | -1.07*** | -0.95*** | -1.01*** | -1.01*** | -1.08*** |
| Spread | 0.81*** | 0.76*** | 0.69*** | 0.70*** | 0.72*** | 0.75*** |
| MEC | -0.33 | -0.33 | -0.28 | -0.24 | -0.26** | -0.17 |
| Trading Volume | 0.98*** | 1.20*** | 1.02*** | 0.98*** | 1.01*** | 1.01*** |
| Turnover Rate | 0.82*** | 0.88*** | 0.92*** | 0.83*** | 0.90*** | 0.90*** |
The null hypothesis of no long memory (d=0) against the alternative hypothesis of the presence of long memory was tested using the semi-parametric method as proposed by GPH (1983). The presence of long memory is suggested in all measures of liquidity. While the hypothesis of no long memory was rejected for all the ordinates for trading volume, turnover rate, spread and trading volume, it was rejected for only one ordinate for MEC. The results from GPH statistic supports predictability in the liquidity measures.
The robustness and precision of the GPH results were supplemented with estimates of Robinson’s (1995) fractionally differencing parameter and are reported in Table 5.
| Table 5: Robinson’s Estimates Of Fractional Differencing Parameter (D) | ||||||
| Liquidity Measures | M=T0.50 | M=T0. 55 | M=T0. 60 | M=T0.65 | M=T0.70 | M=T0.75 |
|---|---|---|---|---|---|---|
| Trading Probability | -0.91*** | -1.07*** | -0.95*** | -0.91*** | -0.97*** | -1.08*** |
| Spread | 0.82*** | 0.71*** | 0.69*** | 0.69*** | 0.71*** | 0.73*** |
| MEC | - 0.29 | - 0.20 | - 0.28 | - 0.24 | - 0.26** | - 0.16 |
| Trading Volume | 1.04*** | 1.14*** | 1.01*** | 0.96*** | 0.98*** | 0.97*** |
| Turnover Rate | 0.89*** | 0.95*** | 0.91*** | 0.82*** | 0.88*** | 0.87*** |
The fractional parameter d estimated by both GPH (1983) and Robinson (1995) methods are quite similar and consistent across both the methods suggesting long-range dependence in all the chosen liquidity measures. It is statistically significant for all the ordinates in cases of trading probability, spread, trading volume and turnover rate. The support for significant MEC is low as for only one ordinate (T0.70), it is significant for MEC under both the methods.The findings shows that multiple dimensions of liquidity have long memory and thus while using them for modelling, ordinary least square methods and standard econometric techniques may result in biased and inconsistent estimates of the parameters. In presence of long memory, past trends in any measure of liquidity is helpful in predicting the future trend. The findings reveal that trading continuity, market depth, breadth and transaction costs are somewhat predictable. Also MEC showing long memory suggests that transitory price changes as a percentage of long term price variance has memory. Thus shocks to prices due to sudden inflow and outflow of funds from the market or order imbalances dissipate at a slow hyperbolic rate of decay. The liquidity modelling would be improved on considering fractional order of integration of these dimensions.
Conclusion
Long Memory is present is liquidity measures. Evidence of long memory in spread, turnover volume and turnover rate indicate towards some element of predictability in depth, breadth, tightness dimensions of liquidity and also resiliency to some extent. It indicates persistence in the ability of the market to withstand large market orders in the presence of numerous orders without any significant impact on pricing. Additionally, long memory in spread or tightness dimension points towards persistence of low transaction cost regime. Investors may expect some predictability on the volume of market participants and transactions. MEC tries to capture the dimension of the resilient market along with market depth and breadth. Long memory in MEC indicates some level of predictability in price continuity and order flows which are desired features in a liquid market.In general parlance, evidence of long memory in liquidity means changes in liquidity level will have a slow hyperbolic decay.
Our findings are in agreement with studies by Bollerslev and Jubinski (1999), and Eisler and Kertész (2007) for US; Tsuji (2002) for Japan and Bariviera (2011) for Thailand that various dimensions of liquidity have long memory and in line with Bollerslev and Jubinski (1999) we argue that stock returns and liquidity measures are best described by long memory type processes. The study improves over the methodology of Nath (2001) and Kumar (2003b) while lends some support to the findings of Kumar (2003b) in Indian context. Securities are instruments that link both the demand and supply sectors of the market. Institutions who are in need of funds issue securities to raise capital, while at the other end invests its surplus fund in the securities. The fluctuation in prices of the securities provides profit to the investors. For both segments, liquidity is of prime consideration. If certain aspects of liquidity are predictable we need to carefully watch the behaviour of market participants as they will be expected to withdraw from the market if liquidity is predicted low and more will follow them. Therefore there exists a possibility of induced liquidity crises within the system due to the presence of long memory. BSE has started responding to the scenario by initiating its liquidity enhancing program. Cash incentives are offered based on trading volume while its trading members enjoyed lower transaction fees with quote based incentives. However, the success of an exogenous measure for improving an endogenous parameter like trading volume is questionable is there is a predictable pattern in trading volume due to the presence of memory. The BSE revised the program and is currently offered to its active traders for securities exclusively listed on it. The findings have implications for asset pricing as well as pricing for liquidity or liquidity premium can be done more effectively and efficiently.The findings will be helpful to market participants, risk managers and asset allocation decisions makers who would like to have active portfolio management strategies and will be interested in market liquidity for order execution with minimal price impact.
References
- Acharya, V.V. & Pederson, L.H. (2005). Asset pricing with liquidity risk. Journal of Financial Economics, 77(2), 375-410.
- Acharya, V. & Schaefer, S. (2006). Liquidity risk and correlation risk: Implications for risk management. Working Paper, London Business School.
- Amihud, Y. & Mendelson, H. (1986). Asset pricing and the bid-ask spread. Journal of Financial Economics, 17(2), 223-249.
- Amihud, Y. (2002). Illiquidity and stock returns: Cross-section and time-series effects. Journal of Financial Markets, 5(1), 31-56.
- Agiakloglou, C., Newbold, P. & Wohar, M. (1992). Bias in an estimator of the fractional difference parameter, Journal of Time Series Analysis, 14(3), 235-246.
- Avramov, D., Chordia, T. & Goyal, A. (2006). Liquidity and autocorrelations in individual stock returns. Journal of Finance, 61(5), 2365-2394.
- Bali, T.G., Peng, L., Shen, Y & Tang, Y. (2014). Liquidity shocks and stock market reactions. Review of Financial Studies, 27(5), 1434-1485.
- Batten, J. & Xuan, V. (2014), Liquidity and return relationships in an emerging market. Emerging Markets Finance and Trade, 50(1), 5-21.
- Bhattacharya, S.N., Sengupta, P., Bhattacharya, M. & Roychoudhury, B. (2016). Multidimensional liquidity: Evidence from the Indian stock market. Applied Finance Letters, 5(2), 29-45.
- Bhattacharya, S.N. & Bhattacharya, M. (2012). Long memory in stock returns: A study of emerging markets, Iranian Journal of Management Studies, 5(2), 67-88.
- Bhattacharya, S.N. & Bhattacharya, M. (2013). Long memory in return structures from developed markets, Cuadernos de Gestión, 13(1), 127-143.
- Bariviera, A.F. (2011). The influence of liquidity on informational efficiency: The case of the Thai stock market. Physica A: Statistical Mechanics and its Applications, 390(23-24), 4426-4432.
- Berg-Sørensen. & Flyvberg, H. (2005). The colour of thermal noise in classical Brownian motion: A feasibility study of direct experimental observation. New Journal of Physics, 7, 38-47.
- Bollerslev, T. & Jubinski, D. (1999). Equity trading volume and volatility: Latent information arrivals and common long-run dependencies. Journal of Business & Economic Statistics, 17(1), 9-21.
- Borio, C. (2004). Market distress and vanishing liquidity: Anatomy and policy options. BIS Working Papers No 158.
- Brunnermeier, M. & Pedersen, L. (2009). Market liquidity and funding liquidity. Review of Financial Studies, 22(6), 2201-2238.
- Campbell, J.Y. & Kyle, A.S. (1993). Smart money, noise trading and stock price behaviour. Review of Economic Studies, 60(1), 1-34.
- Cajueiro, D.O. & Tabak, B.M. (2004). Ranking efficiency for emerging markets. Chaos, Solitons and Fractals, 22(2), 349-352.
- Datar, V.T., Naik, N.Y. & Radcliffe, R. (1998). Liquidity and stock returns: An alternative test. Journal of Financial Markets, 1(2), 203-219.
- Das, S.R. & Hanouna, P. (2009). Hedging credit: Equity liquidity matters. Journal of Financial Intermediation, 18(1), 112-123.
- Chordia, T., Roll, R. & Subrahmanyam, A. (2001). Market liquidity and trading activity. Journal of Finance, 56(2), 501-530.
- Eisler, Z. & Kertesz, J. (2007). Liquidity and the multiskilling properties of the volume traded on the stock market. Europhysics Letters, 77(2), 1-5.
- Faff, R., Chang, Y.Y. & Hwang, C.Y. (2010). Liquidity and stock returns in Japan: New evidence. Pacific-Basin Finance Journal, 18(1), 90-115.
- Geweke, J. & Porter-Hudak, S. (1983). The estimation and application of long-memory time series models. Journal of Time Series Analysis, 4(4), 221-238.
- Gorton, G. (2009), Information, liquidity and the (on-going) panic of 2007, NBER. Working Paper.
- Greene, M.T. & Fielitz, B.D. (1977). Long-term dependence in common stock returns. Journal of Financial Economics, 4(3), 339-349.
- Heyde. & Yang, Y. (1997). On defining long-range dependence. Journal of Applied Probability, 34(4), 939-944.
- Hull, M. & McGroarty, F. (2014). Do emerging markets become more efficient as they develop? Long memory persistence in equity indices. Emerging Markets Review, 18, 45-61.
- Hurst, H.E. (1951). Long-term storage of reservoirs: An experimental study. Transactions of the American Society of Civil Engineers, 116, 770-799.
- Korajczyk, R.A. & Sadka, R. (2008). Pricing the commonality across alternative measures of liquidity. Journal of Financial Economics, 87(1), 45-72.
- Krishnan, R & Mishra, V. (2013). Intraday liquidity patterns in Indian stock market. Journal of Asian Economics, 28, 99-114.
- Kumar, G & Misra, A.K. (2015). Closer view at stock market liquidity: A literature review. Asian Journal of Finance and Accounting, 7(2), 35-57.
- Lo, A.W. (1991). Long-term memory in stock market prices. Econometrica, 59(5), 1279-1313.
- Mandelbrot, B. (1983). The fractal geometry of nature. Freeman W.H. and Co., San Francisco.
- Martinez, M.A., Nieto, B., Rubio, G. & Tapia, M. (2005). Asset pricing and systematic liquidity risk: An empirical investigation of the Spanish stock market. International Review of Economics and Finance, 14(1), 81-103.
- Mike, S. & Farmer, J.D. (2008). An empirical behavioural model of liquidity and volatility. Journal of Economic Dynamics and Control, 32(1), 200-234.
- Moore, L. & Sadka, R. (2006). How fundamental is the pricing of liquidity. Working Paper, Northwestern University.
- Narayan, P.K. & Zheng, X. (2011). The relationship between liquidity and returns on the Chinese stock market, Journal of Asian Economics, 22(3), 259-266.
- Pastor, L. & Stambaugh, R.F. (2003). Liquidity risk and expected stock returns. Journal of Political Economy, 111, 642-685.
- Robinson, P.M. (1992). Semiparametric analysis of long-memory time series. Annals of Statistics, 22(1), 515-539.
- Robinson, P.M. (1995). Log-periodogram regression of time series with long-range dependence. Annals of Statistics, 23(3), 1048-1072.
- Samorodnitsky, G. (2006). Long range dependence. Foundations and Trends in Stochastic Systems, 1(3), 163-257.
- Tsuji, C. (2002). Long-term memory and applying the multi-factor Arfima models in financial markets. Asia Pacific Financial Markets, 9(3), 283-304.