Research Article: 2021 Vol: 25 Issue: 2S
Portfolio Optimization: An Application of Moora Model through Stochastic Process
Kanwal Iqbal Khan, University of Engineering and Technology
Muhammad Abubakar Kabir, University of Engineering and Technology
Mário Nuno Mata, ISCAL-IPL: Instituto Superior de Contabilidade e Administração de Lisboa, Instituto Politécnico de Lisboa
Anabela Batista Correia, ISCAL-IPL: Instituto Superior de Contabilidade e Administração de Lisboa, Instituto Politécnico de Lisboa
João Xavier Rita, ISCAL-IPL: Instituto Superior de Contabilidade e Administração de Lisboa, Instituto Politécnico de Lisboa
Jéssica Nunes Martins, NOVA -Information Management School (NOVA IMS), Universidade Nova de Lisboa
Keywords
Portfolio Optimization, Multi-Criteria Decision Making, Ratio Analysis, Multi-Objective Optimization, Stochastic Process
Abstract
Stock markets play a vital role in stimulating economic processes and development through diversification opportunities. Nowadays, purchasing financial instruments, especially stocks during this fluctuating market, is a back-breaker task for investors because of many sector specifications like Food, Auto Assembling, Fertilizer and Textile, etc. This study learns obstruction within the selection of sector and firms for investment to create an efficient portfolio in Pakistan because of the softness of data and miscommunication of economic performance, and plenty of economic models. Thirty-five sectors and five hundred plus companies are registered in the Pakistan Stock exchange, considering the volatile and high-risk market. This study has used a Multi-Criteria Decision-Making (MCDM) strategy by using Multi-Objective Optimization on the idea of Ratio Analysis to seek out the most effective sector and company’s financial performance based on the criteria. A review of literature indicates that these methods have not been applied earlier for selection stocks in Pakistan stock exchange. After finding the most effective and efficient performing sector and companies, made portfolio in custody with the most effective two sectors and made hybrid portfolio of those best sector using same criteria and each portfolio is consisted on less then and equal to ten company securities. Results indicate that best optimal portfolio is supported to investor requirements, value of the corporate, return of those companies and prices are top prioritized factor taken during this study. The findings are useful for each new investor and also for financial organization.
Introduction
Academic studies linked to risks and returns at the ground level generally deliver helpful information for several stakeholders (Hong, 2019). Specifically, the information might help bankers introduce fair lending and borrowing strategies and investors to work out the unplanned premium and corresponding returns for every sector. That information also supports policymakers in recalling proper guidelines for sector growth (Loc, 2019). From the perspective of investor, they need to analyze the best sector and companies for investment, as it may be seen, there are four main purposes that investors seek to optimize (Skrinjaric, 2019). They want to maximize the expected return and skewness on one hand and to reduce the portfolio risk (variance) and kurtosis on the opposite. The important vital risk-return model, the theory of portfolio selection developed by Markowitz (1952) and he provides a solution to the important question of how investors should allocate their funds among assets to get an efficient and effective portfolio. Generally, after quantifying risks and returns, the speculation promotes that investors consider various combinations on the premise of the risk-return trade-off. In previous studies on that problem, the quality deviation or variance is employed to eliminate the risk factor (Tihana, 2019).
In the portfolio optimization of financial markets, it's considered a difficult task to create a portfolio because of many investment sizes (Sigo, 2019). Investors invest their money to earn good return at minimum risk of losing money. Generally, finance says higher the chance higher the return. It’s no sneaky that higher risk will higher return investment, especially, when markets are rising (Gary, 2014). Also it is saying, utilize your investment at low price of stock and sell at high. It means assets should be purchased at low value and sells it at high price. Complications of how can assign the full fortune among the assets in portfolio optimization, the primary ever financial ultimate for portfolio selection is presented by Markowitz in 1952. He calculates investments on the evidence of mean and variance, a crucial statement of Markowitz model is that true expected return should be recognized by investor. Actually investors are needed to size the expected return as investment return fluctuations with regard to time. Absence of past data about stock profit, as an example of new entry market stock estimation on the investment return precisely is difficult (Qin, 2013).
Classical portfolio design overlooks the valuation mistake and thus formed unwell in ambiguous conditions (Fereiduni, 2017). That’s why, for estimates the return on investment that is required to mature a portfolio optimization approach that considers data ambiguity through integrating and differentiating statistical methods and by the support of specialists. So, there are many factors which do impact on the Return On Investment (ROI) and fundamental factor like financial ratios which help us to calculate the Stock return in future and there are liquidity ratio, profitability ratio, market ratio, leverage ratio and return ratio, consistent with these ratios company’s financial performance may be seen easily and firms may be categories’ consistent with these financial ratios, and it will be helpful to create optimize portfolio. Risk of any portfolio entirely depends on proportion of total investment invested in each stock and their variance and covariance (Statman, 2007).
Investors are categories into four types with regards to the Psychological, there are adventurer investors, Individualistic investor, Guardian investor and Celebrity investor. All of them were discussed thoroughly and defined alright (Thomas & Ronald, 2000). Some investors are seeking to urge arbitrage profit. Arbitrage profits that profit which is attractive because of the mispricing of the securities. Some investor felt substantial to invest in several securities at any level of risk and uncertainty before the mid of twenty centuries (Chiwira & Muyambiri, 2012). But now, People are interesting reciprocally and avoiding risk, because of the risk factor some people do not want to take a position in single security similarly because of the presence of uncertainty. A good company does not mean a decent investment.
In general, never put your all eggs in one basket. Booming the eggs in more than one bowl desire from the presence of various investment opportunities, some stockholders choose aggressive stocks and a few of them choose conservative stocks. This is an amount of recommendation which suggests that one should not concentrate all determinations and resources in one range and having only one range composed could lose everything. Just purchasing shares in many firms does not automatically lead to proper growth and in proper avoidances of risk (Scrimgeour, 2014). Portfolio
optimization will set to be done through MOORA application which helps us to categories the business consistent with the financial performance and therefore the stocks of top companies help us to create portfolio using financial criteria, that process which is consist on the gathering of knowledge, and conditional expectation use to develop the portfolio. Distribution information of a risk variable may only be available as intervals given by experts; the target of this paper is to develop an efficient robust portfolio optimization methodology that features financial data of the listed companies. Multiple Criteria Decision (MCD) will be generally defined because the method of choosing one from a hard and fast of obtainable substitutes or ranking substitutes on the premise of a group of criteria and these criteria have a typically different importance.
This study helps to financial institutions from the investing point of view. They will recognize the importance of Pakistan Stock Exchange (PSX) as an entire and which sector and company is best for the investing and making portfolio in a very sense of taking profit at a particular level of risk. It also helps to the individual investor to speculate in best sectors and corporations. This study also supports to the domestic and international players to grasp the simplest effective and efficient alternative sectors and corporations for earning profit with low level of risk. A program ‘R’ is going to be helpful to all or any reasonably investors to seek out and to create portfolio of the simplest sectors and corporations in line with their desire. By analysis, Investors are going to be ready to know the simplest substitute to earn return with maximum expected return and minimum risk level. Results from the analysis indicate that there exist possibilities of exploiting the advantages of MOORA methodology in order to form portfolios of the best alternatives companies in Pakistan.
Review of Previous Studies
The study within which a personal investor is achieved the most expected return from a good set of the securities which has attached there to a given level of risk. Portfolio theories describe the subsequent risk and return of a mixture of specific assets. A fundamental objective of the speculation is to identify asset groupings that are efficient. And here efficiency means the utmost expected rate of return on an investment for a precise level of risk. There are such an oversized amount of theories related to Portfolio like Asset Management Technique, Capital Assets Pricing Model (CAPM), Modern Portfolio Theory (MPT), Dow Johns Theory, Random Theory and Formula Theory.
Portfolio selection theory is given by Markowitz in 1952 and he got noble prize on this achievement, he introduced the tactic of expected return and variance and covariance for two assets portfolio. He suggested that assets should be in a very portfolio are correlated to every other. Also this theory discus the expected return for the chance adverse investor, if there's higher the chance within the portfolio then expected return of the investor will high.
Optimal portfolios contribution maximized probable predictable return for an unquestionable level of risk. It can be draw on the graph by putting risk of selection assets on the X-axis and also the anticipated profit on the Y-axis of the every possible outcome which reveals the foremost desirable portfolios. It helps to research efficient frontier which may be a mark created from the risk-return graph, included of best portfolios. Best portfolios designed alongside the curve have the most predictable return possible at the assumed amount of risk. This further ends up in learn Markowitz Efficient set.
Risk will be divided in to two (2) kinds, one is Systematic Risk (SR) and other one is Unsystematic Risk (UR). SR is irreducible like, recession and inflation can't be controlled and other one unsystematic and this one can be controlled by the diversification.
The efficient frontier describes the link between the return that may be expected from a portfolio and also the riskiness (volatility) of the portfolio. It is often drawn as a curve (See Figure 1) on a graph of risk against expected return of a portfolio. The efficient frontier gives the simplest return that may be expected for a given level of risk or rock bottom level of risk needed to attain a given expected rate of return.

Figure 1 : Portfolio
Formula
Portfolio return and Portfolio risk can be calculated as per the following:
Markowitz gives the following formulas:
Expected portfolio Return:
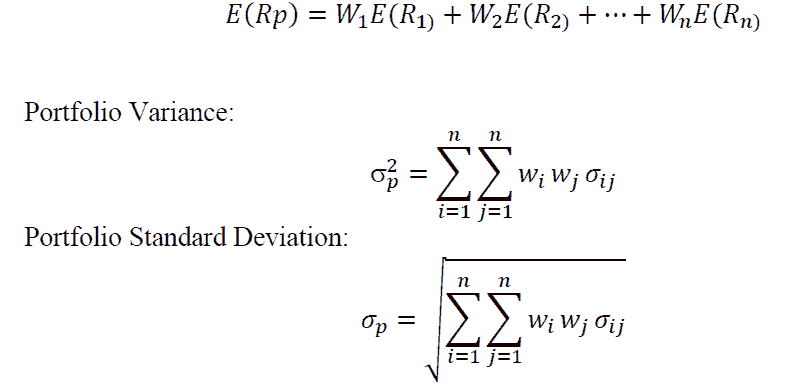
All of the above-mentioned formulas are presented by Markowitz.
Wi=Quantity of assets participated in stock i
Wj=Quantity of assets participated in stock j
σi,j=Covariance among the pairs of stock i and j
n=Number of stock in the selection or portfolio
Key Terms of the Study
Financial Ratios are referred to as Investor’s Ratios. Differing types of investor ratios are which tell about the various portion of economic performance like Liquidity Ratios which tells about the liquidity of the firm from the record of the businesses i.e., Current Assets available to current liabilities which referred to as current ratio, what quantity companies have its own resources to fulfill the present liabilities. It’s its own importance in financial ratios. Similarly, if do subtract the portion of inventories from the present asset and divide it to current liabilities then get the quick ratio (Acid- Test) which tells about the position of the businesses to disburse the present liabilities after the deduction of the inventories. It raises the question of what quantity companies are capable to pay the present liabilities. Income Statement: Profitability Ratios has its own importance in financial Ratios, which tells about the profitability of the firm, in a very way of profits, profit and operating profit to the Sales. Overall financial ratios discuss about the financial performance of the firm and its important form the investors perspective. Financial ratios are considered as evaluating businesses, developments and other finance-related bodies to see their financial performance and rightness. Naturally financial analysis is employed to research whether specific companies are steady, gooey or gainful sufficient warranty a financial investment. ROE and ROA tell the return that alarms a firm's equity holders the mostly measures their capability to receive a return on their equity funds. Also Dividend Payout Ratio (DPR) is that the fraction of earnings paid to stockholders within the kind of dividends (McLaney, 2009). See Figure 2 and Table 1.

Figure 2 : Financial Ratios
| Table 1 Types of Ratios |
|||
|---|---|---|---|
| Ratios | Importance and Definition | ||
| Liquidity Ratio | Those ratios which tell the firm’s capacity to encounter its short- term commitments using short-term assets. | ||
| Profitability Ratio | The firm’s aptitude to make profits on sales, properties and equity. | ||
| Return Ratio | Return ratios tell the yield received on total assets employed and equity in the commercial. | ||
| Financial Leverage | Financial leverage calculates major two key features of the practice of debt financing by the firm. | ||
| Market Ratio | Show the market estimate of an ordinary share in terms of earnings, cash flows, and dividends. | ||
| Criteria Code | Main Criteria | Sub Criteria Code | Sub Criteria |
| X1 | Liquidity Ratio | x11 | Current Ratio |
| x12 | Quick Ratio | ||
| X2 | Profitability Ratio | x21 | Net Profit |
| X3 | Return Ratio | x31 | ROA |
| x32 | ROE | ||
| X4 | Market Ratio | x41 | Price Earnings Ratio |
| x42 | E/S | ||
| x43 | D/P | ||
| X5 | Financial Leverage | x51 | Interest Coverage Ratio |
Literature Review
Present the authors in the order in which they have contributed to the work, and type them one per line (do not double space between authors). When all have been typed, highlight all of the authors and affiliations at once, and click on “Heading 2.” Do NOT use Heading 2 again anywhere in the document. A portfolio could be a fit grouping of securities and assets that individual investors and institutions hold with the target of earning a yield within the business world, portfolio optimization is precious with several problems. Investors want an optimal grouping of securities and assets that maximizes returns at the minimum level of risk. The MPT solves this problem through the diversification of investments (Aracioglu, Demircan & Soyuer, 2011). Markowitz (1952) introduced the concept of portfolio diversification additionally to advance the model of differentiated set (Portfolio). His model describes the choice of stocks for minimize the risk and maximize the yield by giving an optimal portfolio. But there is exertion in sophistication that which securities should be included in portfolio and this model also has limitation of including one period holding. Modern Portfolio Theory (MPT) studies the portfolio of mean and variance optimization where mean of predictable returns of stocks are taken as measure of portfolio return while risk of selection set (Portfolio) is calculated by the variance of stocks. Modern Portfolio Theory (MPT) takings all the stocks simultaneously while stocks are separately considered by the investors in allocation model (Reilly & Brown, 2012). Boscaljon (2005) examine the equally weighted portfolios of 500 stocks being traded in S&P and NYSE and suggest that a decent diversified portfolio should consist on 30 or but 30 stocks. A mean-variance framework for portfolio optimization is usually recommended by Markowitz (1952) which focused on the primary two moments of return distributions. Modern portfolio theory is, mathematical formulation of the concept of diversification in investing, with the aim of choosing a group of investment assets that has collectively lower risk than someone asset. This can be possible, intuitively speaking, because differing kinds of assets often change in value in opposite ways. The first assumption was that asset returns are normally distributed or that the utility function is quadratic and only depends on the primary two moments
Most researchers have worked for effective diversification (Ahuja, 2015; Boscaljon, Filbeck; Duchin & Levy, 2009; Bradfield & Munro, 2016). Theory of portfolio diversification is tested by Fama (1976) with random selection of fifty securities from NYSE. Bradfield & Munro (2016) found that 15 to 29 securities are essential for optimal portfolio in African nation when equally weighted portfolios formed. Ranking of Siberian Bank is on the idea of various MCDM method, like Simple additive method (SAW), TOPSIS, VIKOR, MOORA and GRY (Bojan, 2013). He used all mentioned MCDM in his research to rank the Siberian Bank on the idea of their financial ratios (Prigent, 2010) incorporated higher moments of skewers and kurtosis and also Davies, Kat & Lu (2009), who focused on selection of efficient funds from hedge funds. Brazil equity market examine by Santos (2015) and find that risk adjusted performance will be better obtained by fewer securities in portfolio with the assistance of improved allocation and also finds that in the financial crisis, the more quantity of stocks could also be desired to make a decent diversified portfolio. Kisaka (2015) examine the NSE for the five fiscal periods from Jan, 2009 to Dec, 2013 to find the how much securities should be in a portfolio for risk diversification and found that number of securities should lie between 18 and 22 securities for the optimal portfolio.
Empirical indication of the corporate is weak form efficiency below the random process theory on the developing of the portfolio in stock exchange of Pakistan Stock Exchange (PSX) (Mustafa, 2018). He selected companies on the bottom of market- capitalization and therefore the other optimal criterion of companies was founded on free float procedure and he observed on KSE 30, KSE 100, KMI 30 and KSE All. In short, they observed all the indices of the PSX and found that efficiency and productivity is present in PSX for making portfolio.
Pakistani stock market has appeared as one of the overtaking markets of South East Asia in the last two decades. After the financial restructurings of 1990s the market gained significant amount of capital inflow from developed markets. Numerous studies have been accompanied on aptitude of Karachi Stock Exchange (KSE), which is observed as the most dynamic and leading stock market of country and like other markets of South Asia, Pakistani market revealed absence of random walk (Haque & Nisa, 2011). Similarly in another study Nishat & Mustafa (2007) studied KSE-100 index for daily, weekly and monthly stock returns for the period 1991-2003 and found the stock market to be efficient after making adjustments for thin trading. Two most traded indices of Pakistani stock exchange are KSE 100 and KSE 30, unpredictability is highly persistent in KSE-100 index and smallest persistent in KSE-30 index (Shamshir & Mustafa, 2014).
Um-e-Habiba & Memon (2018) researched on selection of the portfolio in Pakistan and considering the various companies stocks, to examine the risk and how much securities should be in a portfolio and they found that size of the portfolio risk goes down spontaneously with the increasing stocks and suggested that there should be fifteen to twenty assets or securities in an exceedingly portfolio. They considered randomly listed companies of Pakistan Stocks Exchange (PSX) in portfolio selection. Only five companies of bank sector of ordinary & Poor 500 were considered in portfolio optimization using epistemic uncertainty (Asadujjaman, 2019). MOORA Model is employed in many fields like engineering, biology and provide chain for creating decision and also to search out the simplest alternative, selection of the things and inventories, equipment’s and also for the ranking materials. MOORA model is employed in India auto mobile industry to pick out the simplest bike per the customer needs and demand by taking the mileage, style, life span, cost and suspension as priorities (Chawla, 2019).
One significant point of alarm is that the several previous methods in the works are fully compensatory in multiple criteria aggregation (Liu, 2016). Brauers & Zavadskas (2014) also are presented the MOORA model and Multi-MOORA model, by using these techniques they researched on best alternative flying jet on the standards of cost, speed, weight and budget. MOORA model is additionally utilized in Finance for the choice of the simplest alternative branch of the bank on the standards of the population, accounts holder, Cash circulation. Also it's utilized in best alternative project for the longer term investment.
Data Collection and Methodology
equally weighted portfolios formed. Ranking of Siberian Bank is on the idea of various MCDM method, like Simple additive method (SAW), TOPSIS, VIKOR, MOORA and GRY (Bojan, 2013). He used all mentioned MCDM in his research to rank the Siberian Bank on the idea of their financial ratios (Prigent, 2010) incorporated higher moments of skewers and kurtosis and also Davies, Kat & Lu (2009), who focused on selection of efficient funds from hedge funds. Brazil equity market examine by Santos (2015) and find that risk adjusted performance will be better obtained by fewer securities in portfolio with the assistance of improved allocation and also finds that in the financial crisis, the more quantity of stocks could also be desired to make a decent diversified portfolio. Kisaka (2015) examine the NSE for the five fiscal periods from Jan, 2009 to Dec, 2013 to find the how much securities should be in a portfolio for risk diversification and found that number of securities should lie between 18 and 22 securities for the optimal portfolio.
Empirical indication of the corporate is weak form efficiency below the random process theory on the developing of the portfolio in stock exchange of Pakistan Stock Exchange (PSX) (Mustafa, 2018). He selected companies on the bottom of market- capitalization and therefore the other optimal criterion of companies was founded on free float procedure and he observed on KSE 30, KSE 100, KMI 30 and KSE All. In short, they observed all the indices of the PSX and found that efficiency and productivity is present in PSX for making portfolio.
Pakistani stock market has appeared as one of the overtaking markets of South East Asia in the last two decades. After the financial restructurings of 1990s the market gained significant amount of capital inflow from developed markets. Numerous studies have been accompanied on aptitude of Karachi Stock Exchange (KSE), which is observed as the most dynamic and leading stock market of country and like other markets of South Asia, Pakistani market revealed absence of random walk (Haque & Nisa, 2011). Similarly in another study Nishat & Mustafa (2007) studied KSE-100 index for daily, weekly and monthly stock returns for the period 1991-2003 and found the stock market to be efficient after making adjustments for thin trading. Two most traded indices of Pakistani stock exchange are KSE 100 and KSE 30, unpredictability is highly persistent in KSE-100 index and smallest persistent in KSE-30 index (Shamshir & Mustafa, 2014).
Um-e-Habiba & Memon (2018) researched on selection of the portfolio in Pakistan and considering the various companies stocks, to examine the risk and how much securities should be in a portfolio and they found that size of the portfolio risk goes down spontaneously with the increasing stocks and suggested that there should be fifteen to twenty assets or securities in an exceedingly portfolio. They considered randomly listed companies of Pakistan Stocks Exchange (PSX) in portfolio selection. Only five companies of bank sector of ordinary & Poor 500 were considered in portfolio optimization using epistemic uncertainty (Asadujjaman, 2019). MOORA Model is employed in many fields like engineering, biology and provide chain for creating decision and also to search out the simplest alternative, selection of the things and inventories, equipment’s and also for the ranking materials. MOORA model is employed in India auto mobile industry to pick out the simplest bike per the customer needs and demand by taking the mileage, style, life span, cost and suspension as priorities (Chawla, 2019).
One significant point of alarm is that the several previous methods in the works are fully compensatory in multiple criteria aggregation (Liu, 2016). Brauers & Zavadskas (2014) also are presented the MOORA model and Multi-MOORA model, by using these techniques they researched on best alternative flying jet on the standards of cost, speed, weight and budget. MOORA model is additionally utilized in Finance for the choice of the simplest alternative branch of the bank on the standards of the population, accounts holder, Cash circulation. Also it's utilized in best alternative project for the longer term investment.
Methodology
Multi-objective optimization is additionally acknowledged as a multi-criteria deciding process. Multiple objective optimizations are the technique of instantaneously optimizing two (2) or more contradictory qualities focus to confident frontiers.
Multi objective optimization method which might completely useful to unravel several forms of compound deciding proportional performance of some MCDM methods.
Stages to completion of MOORA method (Onay & Yildirim, 2016) are.
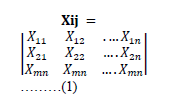
Stage 1: Decision Matrix.
Xij is devoted to matrix as raw data assemble in decision matrix, where i is represent to Row (m) that is the number of alternatives whereas j represents to columns (n) in the number of criteria. Decision matrix can be represented as.
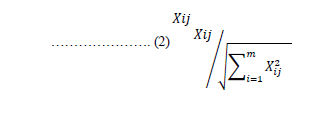
Stage 2: Normalization
Brauers, accomplishes that denominator for the finest choice is square root of the summation of squares of each substitute per worth.
Xij equal to
Stage 3: Optimize Criteria
Multi-objective optimization the above normalized formula performances are added in case of boosting (for helpful features) and reduced or subtracted from the helpful feature in the condition of minimization (for no helpful features). Then the optimization criteria develop:
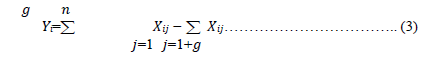
Where g is that the number of qualities to be boosted and (n-g) is that the number of qualities to reduce, and Yi is that the normalized value of the substitute value against the qualities and it's frequently detected nearly characteristics are more significant than others.
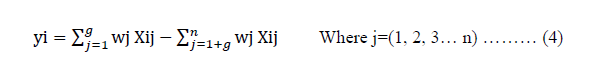
Here, wj is showing the weight of jth criteria, which can be resolute by applying an Analytical Hierarchy Process (AHP) and it may appearance like that one criteria could not be more significant than another criteria as all ratios are lesser than one (-1>Ratios >1). Yet it may generate to be essential to strain some criteria are more imperative than others. In order, ratios could be reproduced by multiplied with a specific number to give more significant to criteria.
Stage 4
Value of yi may be negative or positive reckoning on its best number (Helpful Criteria) and insignificant (Non-Beneficial Criteria) within the decision matrix. The ordinal rank of alternatives shows the ultimate preferred. Thus, the simplest alternative has the uppermost value, while the worst alternative has the preceding value.
The aim of this paper is to analyze the mentioned model and to optimize a portfolio on Pakistan Stock Exchange by using MOORA models. Domestic research until now has been focused only on the Portfolio diversification using random companies.
Reference Point Approach:
In this we use data of normalized matrix (As shown in Figure 3) to solve the non-beneficial objective to maximize. MOORA, Reference Point Theory (RPT) is selected with the Min/Max Metric {maxf|ri-xij|},
Where |ri-xij| is absolute values and xij is greater than, for instance minimization.

Figure 3 : Normalized Matrix
Stochastic Process
It is a set of random variables with a probability space (Ω, ±, P), where “Ω” Omega is showing to Sample Space “± ” Yaf is showing to the-σ −Algebra which could be in conditional Expectation {φ, U, Uc, Ω} and P is showing to the probability of the sample space. Stochastic process is also known as random variable and unintended process. Stochastic Process can be explained in such a way that is event occurred with respect to time. (Joseph Doob)
Random Variable={X(t);t ∈T }
There are two spaces, one is parameter space and other one is State Space. In parameter space is the space in which our event occurs. It could be time in finance, and denoted by “T” and state space shows that our possibilities lies in Ω and it is the subset of an event in any time t.
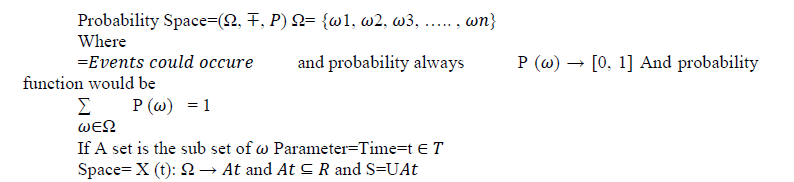
Where R is equal to real number and that comes out from the Sample Space and associated with the event occurred in time t could be interval of T. Space could be further divided in to two categories. Discrete and continues.
Conditional probability and Expectation:
It is also a type of stochastic process with some condition and probabilities also could be change according to the condition. It can be defined as two Random variable X and Y, belong to probability space ( Ω, ±, P), where Ω is equal to discrete and ± is equal to the power set of Ω, P is the P ({w})>0, for all “w” belongs to omega. Such that (Ω, ±, P)=Probability space
Ω<Positive infinity or finite, ± =Power set of the Ω
P ({w})>0,∀∈Ω
Probability always between zero and one, if it is equal to zero then no chance of an occurring an event if it is equal to one its mean event definite occurring.
Condition expectation of X given A can be expressed in the form:
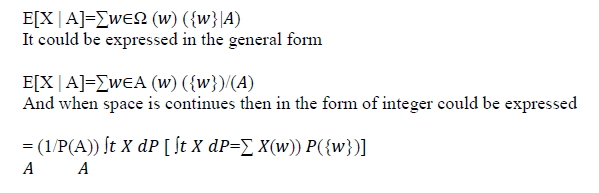
Above mentioned formula are connected to the range of the portfolio and it's helped us to form portfolio per the conditional expectation and portfolio consist on one to 10 or fifteen. Calculation of the portfolio have done per the mean-variance and best alternative of the portfolio selected from the MOORA method.
Analysis and Findings
According to the stochastic process we sorted out the 14 (Fourteen) sector which are written below (See table 2).
| Table 2 Analysis And Finding |
|
|---|---|
| Sector Code | Sector Name |
| A1 | TEXTILE COMPOSITE |
| A2 | SUGAR |
| A3 | FOOD and PERSONAL CARE PRODUCTS |
| A4 | CHEMICAL |
| A5 | TEXTILE SPINNING |
| A6 | CEMENT |
| A7 | GLASS and CERAMICS |
| A8 | AUTOMOBILE PARTS and ACCESSORIES |
| A9 | OIL and GAS EXPLORATION COMPANIES |
| A10 | TECHNOLOGY and COMMUNICATION |
| A11 | OIL and GAS MARKETING COMPANIES |
| A12 | PAPER and BOARD |
| A13 | ENGINEERING |
| A14 | MISCELLANEOUS |
By applying the MOORA model stage 1, after sorted the sectors, which is that the ratio system, in keeping with financial ratios as our criteria for locating the simplest sector to speculate. From table 3 to table 5, all data is described under the ratio system.
| Table 3 Sectors Average |
|||||||||
|---|---|---|---|---|---|---|---|---|---|
| Main Criteria | X1 | X2 | X3 | X4 | X5 | ||||
| Sector | x11 | x12 | x21 | x31 | x32 | x41 | x42 | x43 | x51 |
| A1 | 0.931 | 0.104 | -0.071 | 0.015 | 0.149 | -0.243 | 1.71 | 0.193 | 0.15 |
| A2 | 0.83 | 0.106 | -0.067 | -0.005 | 0.058 | -0.268 | -2.194 | 0.113 | -0.093 |
| A3 | 1.283 | 0.209 | -0.055 | 0.08 | 0.27 | -0.003 | 11.316 | 0.27 | 2.355 |
| A4 | 1.4 | 0.282 | 0.055 | 0.096 | 0.136 | -0.027 | 3.79 | 0.232 | 2.686 |
| A5 | 1.334 | 0.143 | -0.016 | 0.06 | 0.104 | -0.018 | 4.563 | 0.22 | 1.543 |
| A6 | 1.008 | 0.266 | 0.022 | 0.045 | 0.112 | -0.133 | 2.108 | 0.158 | 1.441 |
| A7 | 0.996 | 0.094 | -0.104 | -0.002 | 0.082 | -0.07 | 0.752 | 0.122 | 0.45 |
| A8 | 1.352 | 0.287 | 0.008 | 0.083 | 0.167 | -0.055 | 6.854 | 0.267 | 1.782 |
| A9 | 1.228 | 0.199 | 0.002 | 0.029 | 0.138 | -0.031 | 1.562 | 0.249 | 1.404 |
| A10 | 1.242 | 0.415 | -0.023 | 0.056 | 0.235 | -0.133 | 8.056 | 0.535 | 2.365 |
| A11 | 1.325 | 0.399 | 0.091 | 0.057 | 0.257 | -0.117 | 8.435 | 0.566 | 3.233 |
| A12 | 1.837 | 0.55 | 0.01 | 0.006 | 0.031 | -0.078 | -0.574 | 0.243 | 1.836 |
| A13 | 1.274 | 0.112 | -0.068 | -0.013 | 0.282 | -0.165 | -4.63 | 0.253 | 1.145 |
| A14 | 1.161 | 0.327 | 0.049 | 0.039 | 0.048 | 0.003 | 1.849 | 0.415 | 2.186 |
Above data is taken from the typical of the company’s financial statements with relation to their sectors. Arrange them consistent with the Matrix and take sum of their squares and their square roots as shown in table 4.
| Table 4 Sum of Squares And Their Square Roots |
|||||||||
|---|---|---|---|---|---|---|---|---|---|
| Main Criteria | X1 | X2 | X3 | X4 | X5 | ||||
| Sector | x11 | x12 | x21 | x31 | x32 | x41 | x42 | x43 | x51 |
| A1 | 0.866 | 0.011 | 0.005 | 0 | 0.022 | 0.059 | 2.925 | 0.037 | 0.022 |
| A2 | 0.689 | 0.011 | 0.005 | 0 | 0.003 | 0.072 | 4.815 | 0.013 | 0.009 |
| A3 | 1.646 | 0.044 | 0.003 | 0.006 | 0.073 | 0 | 128.044 | 0.073 | 5.546 |
| A4 | 1.96 | 0.08 | 0.003 | 0.009 | 0.019 | 0.001 | 14.363 | 0.054 | 7.212 |
| A5 | 1.78 | 0.02 | 0 | 0.004 | 0.011 | 0 | 20.823 | 0.049 | 2.382 |
| A6 | 1.017 | 0.071 | 0 | 0.002 | 0.013 | 0.018 | 4.444 | 0.025 | 2.077 |
| A7 | 0.992 | 0.009 | 0.011 | 0 | 0.007 | 0.005 | 0.565 | 0.015 | 0.203 |
| A8 | 1.827 | 0.082 | 0 | 0.007 | 0.028 | 0.003 | 46.978 | 0.072 | 3.177 |
| A9 | 1.507 | 0.04 | 0 | 0.001 | 0.019 | 0.001 | 2.44 | 0.062 | 1.972 |
| A10 | 1.542 | 0.172 | 0.001 | 0.003 | 0.055 | 0.018 | 64.896 | 0.286 | 5.592 |
| A11 | 1.755 | 0.159 | 0.008 | 0.003 | 0.066 | 0.014 | 71.141 | 0.32 | 10.45 |
| A12 | 3.374 | 0.303 | 0 | 0 | 0.001 | 0.006 | 0.33 | 0.059 | 3.37 |
| A13 | 1.622 | 0.013 | 0.005 | 0 | 0.079 | 0.027 | 21.433 | 0.064 | 1.31 |
| A14 | 1.348 | 0.107 | 0.002 | 0.002 | 0.002 | 0 | 3.417 | 0.172 | 4.778 |
| Sum of squares | 21.924 | 1.121 | 0.043 | 0.037 | 0.398 | 0.223 | 386.612 | 1.3 | 48.1 |
| Square Root | 4.682 | 1.059 | 0.208 | 0.193 | 0.631 | 0.472 | 19.662 | 1.14 | 6.935 |
In this segment, taken the square of all entities and sum them in line with the standards then we took square root of the sum of the squares to meet the condition of ratio system denominator. Final step of the ratio system is presented below(table 5), then sum all the standards and ranked them in ascending.
| Table 5 Ratio System of Moora Model |
||||||||||||
|---|---|---|---|---|---|---|---|---|---|---|---|---|
| Main Criteria | X1 | X2 | X3 | X4 | X5 | Rank to Maximum | ||||||
| Sector | x11 | x12 | x21 | x31 | x32 | x41 | x42 | x43 | x51 | Sum | Rank | |
| A1 | 0.199 | 0.098 | -0.343 | 0.079 | 0.236 | -0.514 | 0.087 | 0.169 | 0.003 | 0.014 | 12 | |
| A2 | 0.177 | 0.101 | -0.322 | -0.025 | 0.092 | -0.568 | -0.112 | 0.099 | 0.001 | -0.557 | 14 | |
| A3 | 0.274 | 0.198 | -0.262 | 0.415 | 0.429 | -0.005 | 0.575 | 0.237 | 0.8 | 2.66 | 3 | |
| A4 | 0.299 | 0.267 | 0.265 | 0.495 | 0.216 | -0.057 | 0.193 | 0.204 | 1.04 | 2.921 | 2 | |
| A5 | 0.285 | 0.135 | -0.075 | 0.309 | 0.165 | -0.037 | 0.232 | 0.193 | 0.343 | 1.55 | 7 | |
| A6 | 0.215 | 0.251 | 0.107 | 0.235 | 0.178 | -0.282 | 0.107 | 0.139 | 0.299 | 1.25 | 10 | |
| A7 | 0.213 | 0.088 | -0.502 | -0.01 | 0.13 | -0.148 | 0.038 | 0.107 | 0.029 | -0.054 | 13 | |
| A8 | 0.289 | 0.271 | 0.04 | 0.429 | 0.265 | -0.115 | 0.349 | 0.235 | 0.458 | 2.219 | 6 | |
| A9 | 0.262 | 0.188 | 0.008 | 0.15 | 0.219 | -0.065 | 0.079 | 0.218 | 0.284 | 1.344 | 9 | |
| A10 | 0.265 | 0.392 | -0.11 | 0.289 | 0.373 | -0.281 | 0.41 | 0.469 | 0.806 | 2.613 | 4 | |
| A11 | 0.283 | 0.377 | 0.436 | 0.297 | 0.407 | -0.248 | 0.429 | 0.496 | 1.507 | 3.984 | 1 | |
| A12 | 0.392 | 0.52 | 0.047 | 0.033 | 0.05 | -0.165 | -0.029 | 0.213 | 0.486 | 1.547 | 8 | |
| A13 | 0.272 | 0.106 | -0.329 | -0.066 | 0.447 | -0.35 | -0.235 | 0.222 | 0.189 | 0.256 | 11 | |
| A14 | 0.248 | 0.309 | 0.237 | 0.203 | 0.075 | 0.006 | 0.094 | 0.364 | 0.689 | 2.226 | 5 | |
In Ratio System of MOORA model, it could be seen that sector A11, A4 and A3 are ranked on top three respectively.
Reference Point Approach
It is linked with the ratio system and takes smallest value from section 4c and then subtracts the smallest point from the every respective criteria value. So, Reference points are(In Table 6):
| Table 6 Smallest Value in Criteria |
||||||||||
|---|---|---|---|---|---|---|---|---|---|---|
| Reference Point | 0.177 | 0.088 | -0.502 | -0.066 | 0.05 | -0.568 | -0.235 | 0.099 | 0.001 | |
This is showing to the absolute deviation from the reference point and then selected the maximum value of the alternatives sector in Table 7.
| Table 7 Reference Point Theory: Deviations From The Reference Point |
|||||||||||
|---|---|---|---|---|---|---|---|---|---|---|---|
| Criteria | X1 | X2 | X3 | X4 | X5 | Rank | |||||
| Sector | x11 | x12 | x21 | x31 | x32 | x41 | x42 | x43 | x51 | Max Value | Rank |
| A1 | 0.022 | 0.01 | 0.158 | 0.145 | 0.186 | 0.054 | 0.322 | 0.07 | 0.002 | 0.322 | 13 |
| A2 | 0 | 0.012 | 0.179 | 0.041 | 0.042 | 0 | 0.124 | 0 | 0 | 0.179 | 14 |
| A3 | 0.097 | 0.109 | 0.239 | 0.481 | 0.379 | 0.563 | 0.811 | 0.138 | 0.798 | 0.811 | 3 |
| A4 | 0.122 | 0.178 | 0.766 | 0.561 | 0.166 | 0.511 | 0.428 | 0.105 | 1.039 | 1.039 | 2 |
| A5 | 0.108 | 0.046 | 0.426 | 0.375 | 0.115 | 0.531 | 0.468 | 0.094 | 0.342 | 0.531 | 9 |
| A6 | 0.038 | 0.162 | 0.608 | 0.301 | 0.128 | 0.286 | 0.343 | 0.04 | 0.298 | 0.608 | 6 |
| A7 | 0.035 | 0 | 0 | 0.056 | 0.08 | 0.42 | 0.274 | 0.008 | 0.028 | 0.42 | 11 |
| A8 | 0.111 | 0.183 | 0.541 | 0.495 | 0.215 | 0.453 | 0.584 | 0.135 | 0.457 | 0.584 | 7 |
| A9 | 0.085 | 0.099 | 0.51 | 0.216 | 0.169 | 0.503 | 0.315 | 0.119 | 0.283 | 0.51 | 10 |
| A10 | 0.088 | 0.303 | 0.391 | 0.355 | 0.323 | 0.287 | 0.645 | 0.37 | 0.805 | 0.805 | 4 |
| A11 | 0.106 | 0.289 | 0.938 | 0.363 | 0.357 | 0.32 | 0.664 | 0.397 | 1.506 | 1.506 | 1 |
| A12 | 0.215 | 0.431 | 0.549 | 0.099 | 0 | 0.403 | 0.206 | 0.114 | 0.485 | 0.549 | 8 |
| A13 | 0.095 | 0.017 | 0.173 | 0 | 0.397 | 0.218 | 0 | 0.123 | 0.188 | 0.397 | 12 |
| A14 | 0.071 | 0.22 | 0.739 | 0.269 | 0.026 | 0.574 | 0.329 | 0.265 | 0.688 | 0.739 | 5 |
This is showing that sector A11, A4 and A3 are ranked on the highest of three respectively and final step is to compile both result to induce the MOORA decision. Hence, table 8 is:
| Table 8 Moora Decision |
|||
|---|---|---|---|
| Sector | Ratio System | Reference Point | MOORA Rank |
| A1 | 12 | 13 | 12 |
| A2 | 14 | 14 | 14 |
| A3 | 3 | 3 | 3 |
| A4 | 2 | 2 | 2 |
| A5 | 7 | 9 | 7 |
| A6 | 10 | 6 | 10 |
| A7 | 13 | 11 | 13 |
| A8 | 6 | 7 | 6 |
| A9 | 9 | 10 | 9 |
| A10 | 4 | 4 | 4 |
| A11 | 1 | 1 | 1 |
| A12 | 8 | 8 | 8 |
| A13 | 11 | 12 | 11 |
| A14 | 5 | 5 | 5 |
Sector A11, A4 and A3 are the simplest alternative for investment. Capitalization of A11, A4 and A3 are 192, 549 and 272 billion respectively and total companies under these sectors are 8, 27 and 21. Total return and risk in these sectors are comparatively high and low as compare to the opposite sector. Return of sector A11 is 29.64% and risk is 2.71%. Return of sector A4 is 14.20% and risk is 1.74%. While in sector A3, return is 35.56% and risk is 13.79%.See figure 4.

Figure 4 : Efficient Frontier
In above figure 4: Return is on Y-axis, and risk is on the X-axis. It is the efficient frontier of the portfolio A11, A4 and A3 with respect to their risk and return. Market risk free rate is not included in that risk. The LR, PR, RR and FL ratio graph could be seen clearly in graph that A11, A4, andA3 are the best alternatives for investment. According to the financial ratio it could be analyzed that sector A11, A4 and A3 having greater ROE as compare to other and also Current and Quick Ratio is high in contrast of the other sectors. Interest coverage ratio of the top ranked sector is also high and they are easily achieving yearly interest expense and after paying off the interest expense sectors has good Net profit related to the other sectors. MOORA model also allowing that sector A11, A4 and A3 are the best sector for the investing and also for making the portfolio. It could be evaluated in graph. Graph of the Sectors financial ratio average is from the figure 4 to figure 8:

Figure 5 : Return on Equity

Figure 6 : Current and Quick Ratio

Figure 7 : Intrest Coverage Ratio

Figure 8 :Net Profit
Hybrid Portfolio
In above section, we selected the best alternative sector to invest which are A11 and A4. Find out the best alternative companies of sector A11 and A4 by applying MOORA technique to make hybrid portfolio of these sectors. In both sector, Risk is low and a good return is there. We find that Attock Petroleum Limited is on the top in sector A11 and Ghani Global Holding Limited (GGHL) is on top in sector A4. According to stochastic process, could be justified the number of securities present in single portfolio and by repeated an event we can further make portfolio and can also select the best alternative as well.
By making a hybrid portfolio, investor can get a good return with low risk to maximize the overall profit. This research is suggested that best portfolio should be consisting of 10 securities with maximum return and minimum risk. It could be of one sector or hybrid. Companies under these sectors are filtered and financial data is written in section 4f.Obsereve table 9.
| Table 9 Hybrid Portfolio |
|
|---|---|
| Companies Code | Companies Name |
| A1101 | Attock Petroleum Ltd. |
| A1102 | Hascol Petroleum Ltd. |
| A1103 | Pakistan State Oil Co. Ltd. |
| A1104 | Shell Pakistan Ltd. |
| A401 | Agritech Ltd. |
| A402 | Akzo Nobel Pakistan Ltd. |
| A403 | Bawany Air Products Ltd. (Bawany Oxygen Ltd.) |
| A404 | Berger Paints Pakistan Ltd. |
| A405 | Descon Oxychem Ltd. |
| A406 | Engro Polymer & Chemicals Ltd. |
| A407 | Ghani Global holiding Limited Ltd. |
| A408 | ICI Pakistan Ltd. |
| A409 | Ittehad Chemicals Ltd. |
| A410 | Lotte Pakistan PTA Ltd.(Pakistan PTA Ltd.) |
| A411 | Nimir Industrial Chemicals Ltd. |
| A412 | Sitara Peroxide Ltd. |
Above table 9 is showing the companies which were filtered for creating portfolio. Four companies are filtered from the sector A11 and twelve companies from the sector A4.
Market share and plan data of those companies is healthier than other companies still. Attock Petroleum Limited and Ghani Global Holding Limited are best companies in respective sector and these companies are utilized their assets in great way to come up with profit. Cash conversion cycle and interest coverage rate is healthier than other companies. It can be seen in graph the full market share of GGHL is big in sector A4. Total capitalization of GGHL is 66129079 million. On the opposite side in Sector A11 Attock Petroleum Limited has capitalization of 33773469 in million. lucre and interest coverage ratio of those companies is additionally better than other companies. Financial data of the businesses is showing in table 10. From the table 11 to 12, showing to the MOORA applied on the financial ratios to rank them.Here figure 9 shows market capitalization.

Figure 9 :Market Capitalization
| Table 10 Financial Data |
|||||||||
|---|---|---|---|---|---|---|---|---|---|
| Main Criteria | X1 | X2 | X3 | X4 | X5 | ||||
| Sector | x11 | x12 | x21 | x31 | x32 | x41 | x42 | x43 | x51 |
| A1101 | 1.56 | 0.581 | 0.044 | 0.141 | 0.366 | 0.284 | 24.935 | 0.489 | 4.104 |
| A1102 | 0.879 | 0.192 | 0.01 | 0.024 | 0.184 | 0.066 | 1.771 | 1.878 | 5.696 |
| A1103 | 1.119 | 0.036 | 0.017 | 0.03 | 0.219 | -0.256 | 26.521 | 0.134 | 3.274 |
| A1104 | 0.851 | 0.066 | 0.011 | 0.038 | 0.342 | 0.082 | 5.556 | 0.311 | 2.86 |
| A401 | 0.236 | 0.021 | -0.392 | -0.071 | -0.147 | -1.027 | -4.601 | 0.001 | -2.266 |
| A402 | 1.936 | 1.194 | 0.118 | 0.099 | 0.245 | 0.108 | 1.584 | 0.622 | 5.629 |
| A403 | 0.328 | 0.01 | -0.114 | -0.021 | -0.012 | -0.857 | 0.274 | 0.014 | 0.931 |
| A404 | 0.999 | 0.082 | 0.003 | 0.012 | 0.049 | -0.383 | 0.095 | 0.224 | 1.18 |
| A405 | 1.434 | 0.213 | -0.087 | 0.009 | -0.074 | -0.98 | -0.879 | 0.001 | -0.188 |
| A406 | 0.755 | 0.26 | -0.018 | 0.012 | -0.004 | -0.307 | -0.639 | 0.098 | 1.063 |
| A407 | 1.607 | 0.503 | 0.149 | 0.219 | 0.46 | 0.376 | 3.513 | 0.613 | 1.443 |
| A408 | 1.481 | 0.276 | 0.041 | 0.083 | 0.183 | 0.262 | 9.188 | 0.233 | 5.824 |
| A409 | 0.972 | 0.064 | -0.007 | 0.032 | 0.088 | 0.123 | 2.043 | 0.201 | 0.649 |
| A410 | 1.5 | 0.472 | 0.02 | 0.054 | 0.139 | 0.948 | 0.965 | 0.104 | 2.968 |
| A411 | 1.175 | 0.039 | 0.05 | 0.084 | 0.16 | 0.009 | 0.738 | 0.098 | 2.782 |
| A412 | 0.834 | 0.012 | -0.17 | -0.015 | -0.06 | -0.544 | -0.357 | 0.001 | -1.295 |
EPS of the sector A11 and A4 is also more significant for return as it is mentioned in table. Further liquidity and quick ratio also appreciated. As we can see A407 has liquidity average 1.607 and quick average 0.503 which means it has enough capacity to meet the obligations and also has good opportunity for the growth in future.
| Table 11 Sum Of Squares And Their Square Roots (Companies) |
|||||||||
|---|---|---|---|---|---|---|---|---|---|
| Main Criteria | X1 | X2 | X3 | X4 | X5 | ||||
| Sector | x11 | x12 | x21 | x31 | x32 | x41 | x42 | x43 | x51 |
| A1101 | 2.433 | 0.338 | 0.002 | 0.02 | 0.134 | 0.08 | 621.774 | 0.239 | 16.84 |
| A1102 | 0.772 | 0.037 | 0 | 0.001 | 0.034 | 0.004 | 3.136 | 3.526 | 32.44 |
| A1103 | 1.251 | 0.001 | 0 | 0.001 | 0.048 | 0.065 | 703.358 | 0.018 | 10.716 |
| A1104 | 0.723 | 0.004 | 0 | 0.001 | 0.117 | 0.007 | 30.868 | 0.097 | 8.181 |
| A401 | 0.056 | 0 | 0.154 | 0.005 | 0.022 | 1.054 | 21.166 | 0 | 5.135 |
| A402 | 3.748 | 1.424 | 0.014 | 0.01 | 0.06 | 0.012 | 2.51 | 0.386 | 31.685 |
| A403 | 0.108 | 0 | 0.013 | 0 | 0 | 0.735 | 0.075 | 0 | 0.866 |
| A404 | 0.998 | 0.007 | 0 | 0 | 0.002 | 0.147 | 0.009 | 0.05 | 1.392 |
| A405 | 2.058 | 0.045 | 0.008 | 0 | 0.006 | 0.961 | 0.772 | 0 | 0.035 |
| A406 | 0.57 | 0.067 | 0 | 0 | 0 | 0.094 | 0.409 | 0.01 | 1.131 |
| A407 | 2.581 | 0.253 | 0.022 | 0.048 | 0.211 | 0.141 | 12.341 | 0.376 | 2.082 |
| A408 | 2.194 | 0.076 | 0.002 | 0.007 | 0.033 | 0.068 | 84.414 | 0.054 | 33.922 |
| A409 | 0.944 | 0.004 | 0 | 0.001 | 0.008 | 0.015 | 4.173 | 0.04 | 0.421 |
| A410 | 2.251 | 0.223 | 0 | 0.003 | 0.019 | 0.9 | 0.932 | 0.011 | 8.806 |
| A411 | 1.381 | 0.002 | 0.002 | 0.007 | 0.026 | 0 | 0.545 | 0.01 | 7.742 |
| A412 | 0.695 | 0 | 0.029 | 0 | 0.004 | 0.296 | 0.128 | 0 | 1.676 |
| Sum | 22.762 | 2.483 | 0.246 | 0.105 | 0.722 | 4.579 | 1486.608 | 4.818 | 163.072 |
| SQT | 4.771 | 1.576 | 0.496 | 0.324 | 0.85 | 2.14 | 38.557 | 2.195 | 12.77 |
| Table 12 Ratio System of Moora Model |
||||||||||||
|---|---|---|---|---|---|---|---|---|---|---|---|---|
| Main Criteria | X1 | X2 | X3 | X4 | X5 | |||||||
| Sector | x11 | x12 | x21 | x31 | x32 | x41 | x42 | x43 | x51 | Sum | Ranked | |
| A1101 | 0.327 | 0.369 | 0.088 | 0.435 | 0.43 | 0.133 | 0.647 | 0.223 | 0.321 | 2.972 | 1 | |
| A1102 | 0.184 | 0.122 | 0.02 | 0.074 | 0.217 | 0.031 | 0.046 | 0.856 | 0.446 | 1.995 | 4 | |
| A1103 | 0.234 | 0.023 | 0.034 | 0.092 | 0.258 | -0.12 | 0.688 | 0.061 | 0.256 | 1.527 | 7 | |
| A1104 | 0.178 | 0.042 | 0.023 | 0.118 | 0.402 | 0.039 | 0.144 | 0.142 | 0.224 | 1.312 | 8 | |
| A401 | 0.049 | 0.013 | -0.79 | -0.219 | -0.173 | -0.48 | -0.119 | 0 | -0.177 | -1.895 | 16 | |
| A402 | 0.406 | 0.757 | 0.238 | 0.306 | 0.288 | 0.05 | 0.041 | 0.283 | 0.441 | 2.811 | 3 | |
| A403 | 0.069 | 0.006 | -0.229 | -0.066 | -0.014 | -0.401 | 0.007 | 0.006 | 0.073 | -0.548 | 14 | |
| A404 | 0.209 | 0.052 | 0.005 | 0.038 | 0.057 | -0.179 | 0.002 | 0.102 | 0.092 | 0.38 | 11 | |
| A405 | 0.301 | 0.135 | -0.175 | 0.029 | -0.087 | -0.458 | -0.023 | 0 | -0.015 | -0.293 | 13 | |
| A406 | 0.158 | 0.165 | -0.037 | 0.038 | -0.004 | -0.144 | -0.017 | 0.045 | 0.083 | 0.288 | 12 | |
| A407 | 0.337 | 0.319 | 0.3 | 0.678 | 0.541 | 0.176 | 0.091 | 0.279 | 0.113 | 2.833 | 2 | |
| A408 | 0.31 | 0.175 | 0.083 | 0.257 | 0.215 | 0.122 | 0.238 | 0.106 | 0.456 | 1.963 | 5 | |
| A409 | 0.204 | 0.04 | -0.015 | 0.1 | 0.104 | 0.057 | 0.053 | 0.092 | 0.051 | 0.686 | 10 | |
| A410 | 0.314 | 0.3 | 0.039 | 0.166 | 0.163 | 0.443 | 0.025 | 0.048 | 0.232 | 1.731 | 6 | |
| A411 | 0.246 | 0.025 | 0.1 | 0.261 | 0.188 | 0.004 | 0.019 | 0.045 | 0.218 | 1.106 | 9 | |
| A412 | 0.175 | 0.007 | -0.342 | -0.046 | -0.07 | -0.254 | -0.009 | 0 | -0.101 | -0.64 | 15 | |
Referance Point Approach
Smallest value in every criterion is used to make reference point for the second step of MOORA model in Table 13.
| Table 13 Smallest Values in Criteria |
|||||||||
|---|---|---|---|---|---|---|---|---|---|
| Main Criteria | X1 | X2 | X3 | X4 | X5 | ||||
| Sector | x11 | x12 | x21 | x31 | x32 | x41 | x42 | x43 | x51 |
| Reference point | 0.049 | 0.006 | -0.79 | -0.219 | -0.173 | -0.48 | -0.119 | 0 | -0.177 |
Now above values are subtracted from the normalized table. Biggest value is separated in every alternative and ranks them (See Table 14).
| Table 14 Reference Point Approach |
|||||||||||
|---|---|---|---|---|---|---|---|---|---|---|---|
| Main Criteria | X1 | X2 | X3 | X4 | X5 | Rank | |||||
| Sector | x11 | x12 | x21 | x31 | x32 | x41 | x42 | x43 | x51 | Max | Rank |
| A1101 | 0.277 | 0.363 | 0.877 | 0.654 | 0.603 | 0.612 | 0.766 | 0.222 | 0.499 | 0.877 | 5 |
| A1102 | 0.135 | 0.116 | 0.81 | 0.294 | 0.389 | 0.511 | 0.165 | 0.855 | 0.623 | 0.855 | 7 |
| A1103 | 0.185 | 0.017 | 0.824 | 0.312 | 0.43 | 0.36 | 0.807 | 0.061 | 0.434 | 0.824 | 8 |
| A1104 | 0.129 | 0.036 | 0.812 | 0.338 | 0.575 | 0.518 | 0.263 | 0.141 | 0.401 | 0.812 | 9 |
| A401 | 0 | 0.007 | 0 | 0 | 0 | 0 | 0 | 0 | 0 | 0.007 | 16 |
| A402 | 0.356 | 0.751 | 1.028 | 0.525 | 0.461 | 0.53 | 0.16 | 0.283 | 0.618 | 1.028 | 2 |
| A403 | 0.019 | 0 | 0.561 | 0.153 | 0.159 | 0.079 | 0.126 | 0.006 | 0.25 | 0.561 | 14 |
| A404 | 0.16 | 0.046 | 0.795 | 0.257 | 0.23 | 0.301 | 0.122 | 0.101 | 0.27 | 0.795 | 10 |
| A405 | 0.251 | 0.129 | 0.615 | 0.248 | 0.085 | 0.022 | 0.097 | 0 | 0.163 | 0.615 | 13 |
| A406 | 0.109 | 0.159 | 0.753 | 0.258 | 0.168 | 0.336 | 0.103 | 0.044 | 0.261 | 0.753 | 12 |
| A407 | 0.287 | 0.313 | 1.09 | 0.897 | 0.713 | 0.655 | 0.21 | 0.279 | 0.29 | 1.09 | 1 |
| A408 | 0.261 | 0.169 | 0.873 | 0.477 | 0.388 | 0.602 | 0.358 | 0.106 | 0.634 | 0.873 | 6 |
| A409 | 0.154 | 0.034 | 0.775 | 0.319 | 0.276 | 0.537 | 0.172 | 0.091 | 0.228 | 0.775 | 11 |
| A410 | 0.265 | 0.294 | 0.829 | 0.385 | 0.336 | 0.923 | 0.144 | 0.047 | 0.41 | 0.923 | 3 |
| A411 | 0.197 | 0.019 | 0.89 | 0.48 | 0.361 | 0.484 | 0.138 | 0.044 | 0.395 | 0.89 | 4 |
| A412 | 0.125 | 0.001 | 0.448 | 0.173 | 0.102 | 0.226 | 0.11 | 0 | 0.076 | 0.448 | 15 |
Above table is showing the second step of MOORA which is indicator approach. Consistent with the RPA Company A407 is on the highest rank and also it's considered in making portfolio. Final results of the MOORA model may be seen in below table 15.
| Table 15 Moora Model |
|||
|---|---|---|---|
| Company | Ratio System | Reference Point | Final Rank |
| A1101 | 1 | 5 | 5 |
| A1102 | 4 | 7 | 4 |
| A1103 | 7 | 8 | 7 |
| A1104 | 8 | 9 | 8 |
| A401 | 16 | 16 | 16 |
| A402 | 3 | 2 | 2 |
| A403 | 14 | 14 | 14 |
| A404 | 11 | 10 | 11 |
| A405 | 13 | 13 | 13 |
| A406 | 12 | 12 | 12 |
| A407 | 2 | 1 | 1 |
| A408 | 5 | 6 | 6 |
| A409 | 10 | 11 | 10 |
| A410 | 6 | 3 | 3 |
| A411 | 9 | 4 | 9 |
| A412 | 15 | 15 | 15 |
Company A407 and A402 and A410 is on the very best three ranked and it will be considered in making portfolio. Size of portfolio is ten and per framework we could make different portfolio like mentioned below:
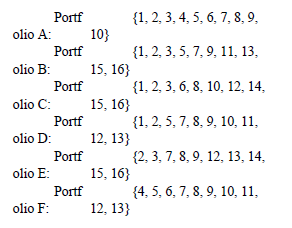
It may otherwise be made further more portfolios by applying conditional probabilities and expectation.
Here table 16 shows bucket of the companies.
| Table 16 Bucket of The Companies |
|||||||||||
|---|---|---|---|---|---|---|---|---|---|---|---|
| Portfolio A | Portfolio B | Portfolio C | Portfolio D | Portfolio E | Portfolio F | ||||||
| 1 | A407 | 1 | A407 | 1 | A407 | 1 | A407 | 2 | A402 | 4 | A1102 |
| 2 | A402 | 2 | A402 | 2 | A402 | 2 | A402 | 3 | A410 | 5 | A1101 |
| 3 | A410 | 3 | A410 | 3 | A410 | 5 | A1101 | 7 | A1103 | 6 | A408 |
| 4 | A1102 | 5 | A1101 | 6 | A408 | 7 | A1103 | 8 | A1104 | 7 | A1103 |
| 5 | A1101 | 7 | A1103 | 8 | A1104 | 8 | A1104 | 9 | A411 | 8 | A1104 |
| 6 | A408 | 9 | A411 | 10 | A409 | 9 | A411 | 12 | A406 | 9 | A411 |
| 7 | A1103 | 11 | A404 | 12 | A406 | 10 | A409 | 13 | A405 | 10 | A409 |
| 8 | A1104 | 13 | A405 | 14 | A403 | 11 | A404 | 14 | A403 | 11 | A404 |
| 9 | A411 | 15 | A412 | 15 | A412 | 12 | A406 | 15 | A412 | 12 | A406 |
| 10 | A409 | 16 | A401 | 16 | A401 | 13 | A405 | 16 | A401 | 13 | A405 |
Portfolio of the chosen companies is mentioned above table 16 and also the company’s maximum and minimum value from the last five years to till twenty first Feb 2020 is showing in table. It’s easily are distinguished the impact of presidency on the market and our relationships with other countries. If FDI and international investors are willing to invest in any country, it's conformed that the market of that country will goes up. Investors desire an honest environment for investment. So, they will earn good return. If they are feeling not well financial condition and government policies, they are doing deny investing their money in this country. So, last five year market price of picked up companies Maximum and minimum on the PSX.See Table 17.
| Table 17 Max, Min and Current Market Prices of Pick-Up Companies |
|||
|---|---|---|---|
| Duration | 5 Years | Date | 21st Feb, 2020 |
| Company Code | Max | Min | Current |
| A1101 | 676.38 | 232.95 | 348.91 |
| A1102 | 387.47 | 20.52 | 22.52 |
| A1103 | 472 | 128.84 | 182.5 |
| A1104 | 652.25 | 124.8 | 186.49 |
| A401 | 14.62 | 2.31 | 4.15 |
| A402 | 410.12 | 76.46 | 275.51 |
| A403 | 42.36 | 3.16 | 31.02 |
| A404 | 288.97 | 61 | 70.25 |
| A405 | 38.38 | 4.23 | 22.35 |
| A406 | 41.05 | 8.11 | 32 |
| A407 | 44.74 | 6.74 | 15.1 |
| A408 | 1132.07 | 366.39 | 706 |
| A409 | 51.05 | 17.72 | 19.6 |
| A410 | 19.92 | 5.66 | 13.8 |
| A411 | 13.55 | 4.98 | 6.47 |
| A412 | 39.7 | 10.24 | 20.1 |
In any financial market research, if the target of the analysis involves determination of stocks to buy for and at what price, there are two basic methodologies: Fundamental analysis, which maintains that markets may misprice a security within the short run but that the "correct" price will eventually be reached. Profits are made by trading the mispriced security so anticipating the market to acknowledge its "mistake" and re-price the protection. Technical analysis maintains that everybody information is reflected already within the stock price. Trends 'are your friend' and sentiment changes predate and predict trend changes. Investors' emotional responses to cost movements end in recognizable price chart patterns. Technical analysis doesn't care what the 'value' of a stock is. Their price predictions are only extrapolations from historical price patterns.
Total risk and return of above company also mentioned in table 18 and efficient portfolio graph is showing separately moreover. Maximum expected return 25.24% in A412 with the 1.57% risk. Minimum risk is 0.02% in A409 with the expected return 3.15%. Hence, higher the chance and better the return and low the chance low the return.
| Table 18 Return and Risk on The Current Price/Share of The Company |
|||
|---|---|---|---|
| Company Code | Current Price | Return | Risk |
| A1101 | 348.91 | 11.00% | 0.23% |
| A1102 | 22.52 | 11.96% | 0.08% |
| A1103 | 182.5 | 6.19% | 0.07% |
| A1104 | 186.49 | 4.65% | 0.05% |
| A401 | 4.15 | 19.77% | 0.53% |
| A402 | 275.51 | 4.33% | 0.04% |
| A403 | 31.02 | 19.63% | 0.63% |
| A404 | 70.25 | 13.74% | 0.42% |
| A405 | 22.35 | 18.31% | 0.59% |
| A406 | 32 | 14.83% | 0.53% |
| A407 | 15.1 | 18.04% | 0.48% |
| A408 | 706 | 9.28% | 0.18% |
| A409 | 19.6 | 3.15% | 0.02% |
| A410 | 13.8 | 14.82% | 0.47% |
| A411 | 6.47 | 17.73% | 0.76% |
| A412 | 20.1 | 25.24% | 1.57% |
Company A407 is simply which has the Expected return on the side of the blue line and risk is down the line, which suggests value and reputation with regard to return and risk is sweet and also best alternative companies in keeping with MOORA model. Expected return and risk of selected companies may well be seen within the figure 10:

Figure 10 : Companies Expected Return and Risk
Total investment in a very Portfolio A to F is in line with the return contribution of that security in total return of the portfolio securities. To sum up to date we have introduced the concepts of Return and Expected Return additionally to straightforward deviation as a measure of risk. By calculating the portfolio Expected return and risk we are ready to add the conclusion that portfolio best portfolio is C. Expected return an Risk is relatively other portfolio is best and it's clearly distinguish other portfolio return and risk. Portfolio B has higher return in overall portfolio with 17.88% while it has also higher risk in selected portfolio with 13.00%. Portfolio A has minimum risk and also minimum return with 14.97 % and 9.14% respectively. In overall selection, Best alternative portfolio is portfolio C and it is consisted on the A407, A402, A410, A408, A1104, A409, A406, A403, A412 and A401.
| Table 19 Portfolio A To F |
||
|---|---|---|
| Portfolio | Return | Risk |
| A | 14.97% | 9.14% |
| B | 17.88% | 13.00% |
| C | 15.39% | 9.70% |
| D | 15.79% | 10.10% |
| E | 16.83% | 11.60% |
| F | 15.76% | 10.10% |
It could be seen in above the table 19 clearly that the best portfolio is combination of the Portfolio C .
Figure 11: Portfolio Expected Return and Risk
As we can see in above figure 11 that efficient line is from 17% and risk is from 5% to 6%, it is clearly shown that portfolio 3 or portfolio C is near to the efficient line of the expected return and below the efficient risk.
Discussion and Implications
This study attempts to identify the most effective alternatives sector and firms for creating a portfolio based on financial ratios criterion. It analyzes the factors that influence the most efficient and effective sector and company for the portfolio investment in Pakistan. To rank the sector and company, this study used the multi criteria decision technique, which is Multi Objective Optimization by Ratio Analysis (MOORA) and it is consisted on two approaches, one is ratio analysis and second is reference point approach which is initiated from the previous build ratios, unpicks the difficult problem of normalization whereas the importance of the objectives is treated independently. A financial ratio is taken into account the most effective tool to investigate the financial position of the corporate and even have the importance in investment decision. Financial ratio is employed as criteria to pick out the most effective alternative sector in PSX, 14 sectors were sorted out through the stochastic process so after sort the sector, applied the MOORA to rank them. Data of the sectors is taken a median from the annual report of the businesses from the financial year 2009 to 2018. Market price of the picked-up companies is taken from the last five year trading to Feb, 2020. Mean value of the businesses is calculated and also finds out the chance on the expected return. Then various portfolios of the chosen companies are performed.
Some of sectors are good in market ratio and a few of them are good in obey the short term and long term obligation. After combine the financial factors this study found that Chemical sector and Oil & Gas Marketing sector were ranked on top in line according to the criteria. Companies of these two sectors are taken into account to make the best portfolio. Before going to make the portfolio, applied the MOORA on the companies of these two sectors and find out the best companies to make the portfolio. By making different set of the selected companies with the help of the stochastic process and used the conditional probability in making portfolio set.
This study benefits to financial institutions from the selecting point of view. They could be able to recognize the importance of Pakistan Stock Exchange (PSX) as an entire and which sector and company is best for the investing and making portfolio in an identical logic of taking profit at a particular level of risk and also able to know the best sector and best companies in PSX. It also helps to the individual investor to speculate in best sectors and corporations from the investing point of view and also help them to understand the importance of the PSX in Pakistan and also able to know the importance of exchange in the development of the country. This study also supports to the domestic and international players to grasp the simplest effective and efficient alternative sectors and corporations for earning profit with low level of risk in any country by applying the MOORA model and using stochastic process.
Conclusion
Portfolio is the set of different securities and assets. This research has used the stocks of registered companies in PSX and applies the MOORA model to find out the best sector and companies in PSX. This study finds that Oil and Gas Marketing sector and Chemical sector in PSX is on top according to criteria, after again by applying the MOORA model on the picked-up sectors, found the best companies of the top selected sector in PSX and try to make the hybrid portfolio and make different set of portfolio through stochastic process. We find the best portfolio of the picked-up companies and virtually invested in these portfolios to find the relation of the risk and return. Total investment is distributed equally in stokes of the company’s portfolio. Total number of stock in one portfolio is ten and the expected return of the company calculated from the past prices of the stocks. Maximum return and minimum risk is on the set of portfolio C. Solution of selection the best alternative sector and company help to investor for making portfolio and also from the investing point of view.
Limitations and Future Directions
Every research has weaknesses; this one is not an exception. There are certain weaknesses that are associated with reality. It can be forecasted how stocks of an organization are visiting behave during it slow in future, but nobody truly knows what's going to happen within the world during the following five minutes. Limitation of this research is that it's on the bases of secondary data and also current factor of economy didn't absorb consideration. Although this research will help to new investor to know the choice of best alternatives for sector and firms in line with MOORA model which is multi criteria decision method and further how we will use the model to define the sectors and firms.
Second limitation of this research is that the MCDM method. Only one method is use during this research which is MOORA. In future Multi MOORA and other MCDM like AHP, TOPSIS, and VIKOR would be used. Local and international players would can also get earn more profit by using MOORA model If the Multi MOORA (Multi Objective Optimizing by Ratio Analysis) model is employed for share evaluation then calculation would have reexamined frequently, maybe with containing more objectives and criteria. Nine objectives were measured, with the importance of the objectives measured on the premise of financial ratios yet. With these changes, MCDM (Multi Criteria Decision Method) could develop a satisfactory mechanism to follow the evolution of share quotations. Therefore, opportunities those similar studies on the foremost illustrious share indices of the most important countries would be made at some point. So, as to determine similarities and dissimilarities it should be preferable to use the identical objectives and also the same method for comparing most famous share indices. Other financial factors and also economic factors like FDI, Inflation and government fiscal policies and monetary budget can be used as criteria to choose up best sector and firms for creating an effective and efficient portfolio with low risk and maximum return. Last one is that this researched is purely on stock exchange of the Pakistan; we can use this method further in mercantile exchange and also in Foreign exchange market to find out the best alternatives commodity and currency for investment.
References
- Ahuja, A. (2015). Portfolio diversification in the karachi stock exchange. Pakistan Journal of Engineering, Technology & Science, 1(1), 3-5.
- Asadujjaman, M. (2019). Robustness based portfolio optimization under epistemic uncertainty. Journal of Industrial Engineering International, 15(1), 207–219.
- Bojan, D., Dragisa, S., & Mira, D. (2013). Comparative analysis of some prominent MCDM methods: A case of ranking Serbian Banks. Serbian Journal of Management, 8 (2), 213 – 241.
- Brauers, W.K.M., & Zavadskas, E.K. (2006). The MOORA method and its application to privatization in a transition economy control cybern. Journal of Finance, 35 (2), 445-469.
- Bradfield, D., & Munro, B. (2016). The number of stocks required for effective portfolio diversification: The South African case. South African Journal of Accounting Research, 1(1), 1-16.
- Chawla S., Agrawal S., & Singari, R.M. (2019). Integrated Topsis-Moora model for prioritization of new bike selection. Advances in Engineering Design, 44(4), 755-765.
- Caporale, G.M., & Alex, P. (2017). Calendar anomalies in the Ukrainian stock market. Investment Management and Financial Innovations, 14(1), 104– 14.
- Dineen, S. (2005). Probabilities for finance. American Mathematical Society.
- Domian, D.L., Louton, D.A., & Racine, M.D. (2007). Diversification in portfolios of individual stocks: 100 Stocks are not enough. Financial Review, 42(4), 557- 570.
- Duchin, R., & Levy, H. (2009). Markowitz versus the Talmudic portfolio diversification strategies. Journal of Portfolio Management, 35(2), 71.
- Gupta, G., Khoon, C.N.H., & Shahnon, S. (2001). How many securities make a diversified portfolio in KLSE stocks. Asian Academy of Management Journal, 6(1), 63-79.
- Gary, E., & Stroik. (2014). Financial resolutions for a new year. Journal of Wealth Management, 8(1), 15-20.
- Hong, D.V., Thach, N.P., Loc, M.T., & Thang, C.N. (2019). Risk, return and portfolio optimization for various industries in the ASEAN region. Borsa Istanbul Review, 19(2), 132-138.
- Haque, A., Liu, H.C., & Fakhar-Un-Nisa. (2011). Testing the weak form efficiency of Pakistani stock market (2000–2010). International Journal of Economics and Financial Issues, 1(4), 153-162.
- Karande, P., & Chakraborty, R. (2012). Application of multi-objective optimization on the basis of ratio analysis (MOORA) method for materials selection. Materials and Design, 37(2), 317–24.
- Liu, J., Liao, X., Zhao, W., & Yang, N. (2016). A classification approach based on the outranking model for multiple criteria ABC analysis. International Journal of Economic and Finance, 2(1), 157–169.
- Markowitz, H. (1952). Portfolio selection. The Journal of Finance, 7(1), 77-91.
- Muhammad, N., & Scrimgeour, F. (2014). Stock returns and fundamentals in the Australian market. Asian Journal of Finance & Accounting, 6(1), 271–90.
- Mustafa, K., & Nishat, M. (2007). Testing for market efficiency in emerging markets: A case study of the Karachi stock market. The Lahore Journal of Economics, 12(1), 119-140.
- Pengqian, Y., & Lee, J.S. (2019). Model-based deep reinforcement learning for dynamic portfolio optimization. Journal of Finance, 15(1), 15-20.
- Robert, A., & Strong. (2008). Portfolio construction, management, and protection. CFA University of Maine.
- Santos, A.A. (2015). Beating the market with small portfolios. Evidence from Brazil. Economic A, 16(1), 22-31.
- Sego, B. (2019). Using grey incidence analysis approach in portfolio selection. International Journal Financial Study, 7(1), 11-20.
- Shamshir, M., Baig, M.J., & Mustafa, K. (2018). Evidence of random walk in Pakistan stock exchange: An emerging stock market study. Journal of Economics Library, 5(1), 1-3.
- Shamshir, M., & Mustafa, K. (2014). Presence of day-of-the-week effect in the Karachi stock market. Research Journal of Finance and Accounting, 5(19), 46-58.
- Statman, M. (2007). How many stocks make a diversified portfolio? Journal of Financial and Quantitative Analysis, 22(3), 353-363.
- Skrinjaric, T. (2019). Stock market reactions to Brexit: Case of selected CEE and SEE stock markets. International Journal of Financial Studies, 7(1), 2-5.
- Um, H., Sasdhwani, R., & Memon, P.A. (2018). Selecting optimal portfolio in Pakistan. Journal of Business and Management, 2(1), 1-6.