Research Article: 2022 Vol: 26 Issue: 2S
Predicting Financial Distress of Chinese Public Listed Companies
Huang Zhixiang, Salaar Farooq
Citation Information: Zhixiang, H. (2022). Predicting financial distress of Chinese public listed companies. Accounting and Financial Studies Journal, 26(S2), 1-19.
Abstract
In this research, a prediction model based on Principal Component Analysis (PCA) and a Binary Logistics Regression (BLR) model is constructed based on the data of Chinese public listed companies from the year 2013 to 2018, and compared with two of the most famous financial distress prediction models including Altman’s Z-score model and Ohlson’ O-score model in terms of their ability in predicting financial distress of Chinese public firms. The predictive results from each model are evaluated using Mann-Whitney U test, descriptive analysis, ROC curve and AUC. The findings consistently revealed that, except profitability, solvency and cash flow, a company’s operating capability and growth capacity are also significantly differentiated from financially distressed and financially stable companies. Further, all of the four models are able to predict financial distress of Chinese public companies. However, among the four models in this research, the Altman’s Z-score model is able to provide remarkable accuracy one year before their occurrence in Chinese public listed firms.
Keywords
Financial Distress, PCA, BLR, Z-score Model, O-score Model, ROC Curve, AUC
Introduction
With the fast growing of economic scale, China has been the second-largest economy in the world, which contributed to the flourishing of domestic public listed companies. China's market has enormous investment potential, and subsequently, the security market has been growing significantly. However, when the Chinese security market is being prosperous, a range of risks are also emerging to pose a threat to investors. One of the main risks being posed to investors is the increasing number of corporate financial failures among Chinese public listed companies. The private enterprises in China that were expanding at a considerable pace in recent years by accruing a high level of debt leverage have become a centre of financial default (Weinland, 2019). As a result of increasing bond defaults in China, more and more debtors failed to pay off financiers’ investments or interests (Sun, 2020). For example, according to Bloomberg (2019), in the first quarter of 2019, the number of domestic bonds defaulted by Chinese firms reached 39.2 billion Yuan, which is 3.4 times the number for the equivalent phase of 2018. When a firm is facing insolvency or default, it is an indication that it is under financial distress which is posing risks on its investors. For this reason, it is important for investors to effectively evaluate and understand companies’ financial performance especially identifying potential corporate financial distress, where financial distress means a corporation is unable to pay off their liabilities—that is, going into default, and even bankruptcy, confronting liquidation or asset seizure and division.
Given that a company experiencing financial distress can contribute to enormous losses to investors, to be capable of diagnosing or forecasting if a company is under financial distress before it takes effects is vital to investors or other stakeholders’ interests. In recent years, a variety of approaches had been developed for diagnosing or forecasting corporate financial distress or bankruptcy, such as multiple discriminant models, logistic regression, machine learning methods, including support vector machine and neural networks. Some of the well-known approaches are Altman’s Z-score model, Ohlson’s O-score model, Zmijewski’s Probit model, Shumway’s Hazard model, and Blum's D-score model.
However, those famous models are mainly developed based on data from other countries, especially in the US. Furthermore, the accounting standards and the characteristics of the market and companies are different between the western countries and China, thus, it is questionable if those models are practical to predict corporate financial distress of Chinese companies. For these reasons, it is significant to develop new models based on the data of Chinese companies and examine their abilities in forecasting or diagnosing financial distress for Chinese enterprises. Therefore, this research is aimed at developing new prediction models, particularly for Chinese companies by using the data of Chinese public listed companies in recent years. Furthermore, the predictive abilities of newly developed models will be examined and compared with the Z-score model adjusted by Chen & Holdings (2007) for Chinese public listed companies as well as the O-score model which are widely recognized as reliable and powerful, regarding their prediction ability for Chinese public listed companies.
Literature Review
Altman (1968) first developed a multivariate prediction model for predicting corporate failure. Predicting financial distress using statistical model has been a popular topic in the finance and management field. Before discussing the development of financial distress prediction model, the definition of financial distress or financial failure and prediction should be clearly understood.
As Geng, Bose & Chen (2015) suggested, financial distress refers to a company’s incapability to cover its liabilities or other obligations, which generally emanates from poor cash flow and profitability. As a result, the company would be going into default, or bankruptcy, confronting liquidation or asset seizure and division. Altman, Hotchkiss & Wang (2019) have defined corporate failure and bankruptcy a result of financial distress. Additionally, as Kihooto, Omagwa & Wachira, et al., (2016) stated, the term financial distress, to some extent, also refers to corporate failure, bankruptcy, insolvency or even default. In other words, they are coherent. Therefore, when there are various prediction models for predicting bankruptcy, corporate failure, or financial distress, we could say that they are doing the same thing, as bankruptcy, insolvency, to some extent, refer to the same status of a company that is financial distress.
When it comes to the word of prediction, Morris (2018) had explained that the definition of prediction includes two meanings; one meaning is identification, while another one is forecast the event before it occurs. Therefore, we do study a variety of prediction models, regarding their abilities of both identifying and forecasting financial distress.
Next, one of the foundations of establishing a financial distress prediction model is the assumption that the closer a company to be financial distress, the more similar its financial performance will be to a financially distressed company. This had been proved by many researches. For example, Beaver (1966) found that there is a significant deterioration in the financial performance of a company up to a five-year period prior to its corporate failure, with increasing significance in the difference between financial indicators from failed firms and non-failed firms. Therefore, those famous prediction models were developed by the accounting data in the year of or one year prior to the occurrence of financial distress. However, they still have the prediction power one year, two years or even up to five years prior to the financial distress.
Prediction Models
In accordance with Devi & Radhika (2018), there are a range of approaches for predicting bankruptcy (financial distress) which can be divided into two types including statistical methods and Machine Learning (ML) techniques. Statistical approaches comprise Linear Discriminant Analysis (LDA), Multi-Discriminant Analysis (MDA) and Binary Logistic Regression (BLR). On the other hand, Machine Learning techniques include Artificial Neural Networks (ANN), Support Vector Machines (SVM), Decision Trees (DT) and Other ML techniques. Additionally, optimization methods, including Genetic Algorithm (GA) and Particle Swarm Optimization (PSO) are also used to integrate with ML models to enhance the prediction ability for large scale of the data source.
As the pioneer of predicting financial distress, Altman (1968) applied a multiple discriminant statistical approach to establish a model consisting of five financial factors from financial ratios and equity market value for predicting bankruptcy, and the model showed an accuracy rate at 95%. However, the statistical requirements, such as normality distribution, had limited the application of the model. Additionally, the data he used for developing that model was from the companies in the manufacturing industry. As there is a consideration that there is a difference among industries regarding companies’ financial characteristics.
Ohlson (1980) developed the O-score model for predicting corporate financial distress, as another classical approach logit analysis technique which is relatively better than discriminant analysis model as logit analysis do not ask for the statistical requirement of normal distribution. The accuracy rate of the Ohlson model was 96% for the estimation sample and 85% for the validation sample.
However, as suggested by Shumway (2001), a bankruptcy probability estimated by a static model is biased and inconsistent thank to the negligence of constant changes happen to the firms. Therefore, he developed a discrete hazard model using accounting and market variables, providing an accuracy rate of up to 96.5% in classifying bankrupt corporations.
Chen & Holdings (2007) adjusted the Altman’s Z-score Emerging Market Scoring model based on Chinese public listed companies from 16 different industries and formed the Z(China)-Score model including four factors providing a prediction accuracy of 80% for Chinese public listed companies categorized as Special Treatment, three years prior to bankruptcy. Therefore, this modified model was seen to be remarkably practical for Chinese corporations.
Independent Variables
In this research, financial ratio are used as independent variables, which refers to a quotient of two accounting parameters, is a prominent tool for evaluating a company’s financial performance, as those financial ratios reflect the in-depth financial situation of a company. Thereby, they are widely used to develop prediction models using statistical technique or other methods.
Profitability
Profitability refers to a company’s ability to generate profit, or operating success in a particular period, normally one year (Davidson, 2020). According to Wu, Dai & Shi (2018), profitability is critical in determining the value of a corporation and its stock price. It is one of the most important factors in the analysis of a corporation’s financial performance. Ratios reflecting profitability include Net Profit Margin, Gross Operating Margin, Return on Equity, Return on Assets and others.
From a range of variables, Wang (2018) found that the factors of profitability, including Gross Operating Margin and Net Assets per Share, are significant in differentiating financially distressed and normal firms in China. Meanwhile, Guo (2018) found that variables of profitability comprising of Return on Assets, Return on Total Assets, and Return on Equity, Net Profit Margin and Earnings per Share are also significant in predicting financial distress of Chinese public listed companies. Balasubramanian, Radhakrishna & Sridevi, et al., (2019) found that there is a significant relationship between ratios of Return on equity, Return on investment, Net profit margin and the likelihood of financial distress in Indian listed companies. Liu, Liu & Xu (2020) found that Earnings per share are significant in the prediction of financial distress in Chinese public listed firms.
In this research, financial ratios representing profitability including net profit margin, gross operating margin, return on equity, return on assets, earnings per share, and net assets per share are selected.
Solvency
Solvency refers to a firm’s ability to pay interest at regular due day and to repay the principal of obligation at it comes to mature (Davidson, 2020). Further, solvency ratios, also named leverage ratios, are measuring a firm’s going concern and ability to pay its long-term debt by comparing its debt level with assets, equity, and income (Lessambo, 2018). It is a critical factor in evaluating a firm’s financial performance. At the same time, liquidity is indicating a company’s capability to repay its short-term liabilities expected to be due within 12 months (Davidson, 2020). To some extent, they measure the same factor, which is a company’s ability to repay the debt. Therefore, in this research, ratios of liquidity, reflecting a firm’s capability of paying off its liabilities, are integrated with the variable of solvency.
Ahmed (2017) found Cash Ratio, Quick Ratio, Current Ratio and Debt to Assets Ratio are significant in the classification of financial distress of Chinese public listed companies. Wang (2018) found that Debt to Assets Ratio is significant in differentiating financially distressed and normal firms in China. Additionally, Guo (2018) found that solvency ratios, including Current Ratio, Cash Ratio, and Times Interest Earned are significant in classifying financially distressed and financially stable firms in China. Balasubramanian, Radhakrishna & Sridevi, et al., (2019) found that there is a significant correlation between ratios of Ratio of Long-term Debt to Equity, Current ratio, Interest coverage ratio and the probability of financial distress in Indian listed companies. Liu, Liu & Xu (2020) found that Interest Coverage Ratio is significantly in predicting financial distress of Chinese public listed firms.
In this research, financial ratios representing solvency including current ratio, quick ratio,debt to assets ratio, cash ratio, ratio of debt to equity are selected.
Cash Flow
As Morris (2018) stated, a company continuously generating negative cash flow, meanwhile, with no access to capital, would be eventually run out of cash, which indicates bankruptcy. Cash flow refers to the cash generated from the business activities and retained in the company’s account after a whole year. Therefore, the ratios measuring cash flow or the relationship between it and the company’s other factors; indicate a company’s ability to generate cash.
Ahmed (2017) found that the cash flow coverage ratio is significantly different between financially distressed and financially stable firms in China. Wang (2018) found that Operating Revenue Cash Coverage is significant in differentiating financially distressed and normal firms in China. Feng (2018) also found that the ratio of Net Operating Revenue Cash Coverage is significantly different between financially distressed companies and financially stable companies in China.
In this research, financial ratios representing cash flow including recovery rate for all cash, operating revenue cash coverage, cash flow adequacy ratio, operating index are selected.
Growth Capacity
Growth capacity refers to an enterprise’s ability to expand its operational scale, and to improve its market competitiveness, as well as to add value in the invested capital, in the premise of ensuring the survival of itself (Wu, Dai & Shi, 2018). Thereby, ratios of growth capacity can be used to evaluate a company’s capacity of grow in the future and to determine the value of investing in it.
Quan & Cheng (2010) found that the Growth Rate of Total Assets reflecting growth capacity of a company is significantly different between financially distressed firms and financially stable firms in China. Guo (2018) found that the Growth Rate of Owners' Equity measuring growth capacity is significant in predicting financial distress of Chinese public listed corporations. Feng (2018) also found that Growth Rate of Operating Revenue, Growth Rate of Owners' Equity, Growth Rate of Total Assets and Growth Rate of Operating Profit are significantly different between Chinese companies under financial distress and without financial distress.
In this research, financial ratios representing growth capacity including growth rate of total assets, capital accumulation rate, growth rate of net assets per share, growth rate of operating profit are selected.
Operating Capability
Operating capability ratios, also called activity ratios, are reflecting how a firm efficiently manages both working capital and longer-term assets (Robinson, 2020). The faster the turnover of corporate assets, the higher the liquidity, the stronger the solvency of the corporation, and eventually, the faster the assets can generate income. Operating capacity ratios include: inventory turnover, accounts receivable turnover rate, operating cycle, current asset turnover rate, etc.
Quan & Cheng (2010); Liu, Liu & Xu (2020) found that Inventory Turnover and Total Assets Turnover are significant in the classification of financial distress of Chinese public listed firms. Wang (2018) found that the ratios of Accounts Receivable Turnover, Total Asset Turnover are significant in differentiating financially distressed and normal firms in China. Furthermore, a research by Guo (2018) also indicated the significance of Fixed Asset Turnover, which is a ratio reflecting operating capacity, in the classification of financial distress in Chinese public listed corporations. Feng (2018) found that Accounts Receivable Turnover, Total Assets Turnover and Fixed Asset Turnover are also significant in classifying Chinese firms with financial distress and without financial distress.
Research Hypotheses
In this study, in order to answer the research questions, several research hypotheses are developed as follow:
Research Hypotheses I: Z(China)-score model has the ability to predict financial distress of Chinese public listed firms;
Research Hypotheses II: O-score model has the ability to predict financial distress of Chinese public listed firms;
Research Hypotheses III: Principal components predicting model has the ability to predict financial distress of Chinese public listed firms;
Research Hypotheses IV: Logistics regression model has the ability to predict financial distress of Chinese public listed firms.
Research Methodology
Theoretical Models
Chen and Holdings (2007)’s Z (China)-Score Model
Z=0.517 − 0.460x1+9.320x2+0.388x3+1.158x4
Where,
x1=Total Liabilities to Total Assets;
x2 =Net Profit to Average Total Assets;
x3=Working capital to Total Assets; x4 =Retained Earnings to Total Assets.
Criteria of financial distress:
(1) Companies with Z<0.5 are categorized as technically under financial distress;
(2) Companies with 0.5<Z<0.9 are categorized as potential distressed firms and should be closely watched;
(3) Companies with Z>0.9 are categorized as financially stable firms.
Ohlson (1980)’s O-score Model
Ohlson=–1.32 – 0.407X1+6.03X2 – 1.43X3+0.0757X4 – 2.37X5 – 1.83X6+0.285X7 – 1.72X8 – 0.52X9
Where,
X1=Log (Total assets to GNP);
X2=Total Liabilities to Total Assets;
X3=Working Capital to Total Assets;
X4=Current liabilities to Current assets;
X5=Net income to total assets;
X6=Funds provided by operations to total liabilities;
X7=1 if net income is negative for the last two years, 0 otherwise;
X8=1 if total liabilities>total assets, 0 otherwise;
X9=(Nit – Nit-1)/(| Nit |+| Nit-1 |), Nit is net income for the most current period.
Research Methodology
This is a quantitative research with the development of a principal components prediction model and a binary logistics regression model, as well as the comparison of those two models and the O-score model and the Z(China)-score model.
The comparison is conducted by inputting the data of Chinese public listed companies under financial distress and without financial distress to the prediction models, then comparing the prediction results and the real situation.
The reason that public listed companies are selected is that their financial data and other information are available in their annual reports and government department website in China. Additionally, whether a company is under financial distress or not is judged by if it is posted special treatment. For instance, if a company is being specially treated, it indicates that the company is under financial distress. We collect the data from the years 2013 to 2018.
First of all, 25 financial ratios in terms of 5 aspects of a company’ financial performance is selected based on the literature review. Meanwhile, all the collected data will be processed and coded for implementing the models.
Second, two samples are created for conducting the research. The first sample is the estimation sample to establish two new models which are the PCA model and the BLR model, and assign the cut-off for the O-score model. Another sample is examination sample, used for the examination and comparison of predictive abilities of the four models.
Third, all the independent variables will be tested with single factors analysis, including a two-sample T-test or a Mann-Whitney U test, to eliminate insignificant variables.
Fourth, it is the development of new models. Principal components analysis and Binary Logistic Regression will be performed to develop two prediction models based on the estimation sample with the retained variables from the single factors analysis. Meanwhile, ROC (Receiver Operating Characteristic) curve will be created for the O-score model based on the estimation sample, to assign a proper cut-off by using the Youden index.
Fifth, the four models will be implemented using the data collected to generate the judgemental scores for predicting corporate financial distress. Therein a range of null hypotheses will be tested, by comparing the scores’ mean of four models to determine if they are significantly different between two groups of financial status, using the methods of two-sample T-test or Mann-Whitney U test. After that, a descriptive analysis will be performed to compare the classification of prediction capabilities with the indicators of Accuracy, Precision, and Recall. Finally, the ROC curve will be applied to evaluate the prediction abilities of the four models.
Single Factor Analysis
In this section, two-sample T-test or Mann-Whitney U test will be implemented to determine if a factor is significant for distinguishing two groups. For example, to test if a financial indicator is significantly different between two groups of companies under financial distress and without financial distress, or to answer another question of if the predicted scores are significantly different between two classes of companies with financial distress and stable firms.
Principal Components Prediction Model
As Morris (2018) suggested, there are considerable commonalities among the financial ratios, which means that they usually do not exclusively measure merely one financial characteristic of a firm. Therefore, it is believed that it is necessary to minimize the overlaps among the variables used to develop a prediction model. Thus, principal components analysis will be used to develop a financial distress prediction model.
Principal Components Analysis (PCA) is a data reduction technique useful for summarizing or describing the variance in a set of variables into fewer dimensions than there are variables in that data set.
The PCA generates linear transformation and compression of highly correlated variables to obtain new independent principal components that can reflect the majority of the information of the original variables, and construct a comprehensive evaluation function according to the contribution of each principal component as the weight, so as to carry out a comprehensive evaluation on each individual (Wang, Shen & Li, 2010).
In PCA, a series of original variables can be transferred to be few principal components from f1 to fm as follow:
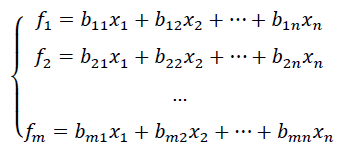
According to Li (2018), it is considered sufficient when the accumulated contribution of the principal components counted more than 85% of the total variance of the dependant variable. Zhang, Zhu & Xu (2001) proposed an approach for establishing a Principal Component Prediction Model (PCA model) for predicting corporate financial failure based on the method of Principal Components Analysis. The principal components are linear combinations of the original financial ratios. After acquiring n principal components, based on the contribution of each principal component, the predictive function model would be as below:
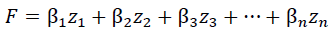
Where β refers to the contribution of the principal component;
F is the prediction value.
After acquiring the predictive function model, the cut-off value of the model could be assigned based on the estimation sample to provide the highest predictive accuracy.
Binary Logistic Regression
In this research, a Binary Logistics Regression model (BLR model) will also be developed for predicting corporate financial distress. Comparing with other statistical models, one of the advantages of logistics regression is that it does not make any distributional assumptions for the variables. Furthermore, when the dependant variable is categorical rather than continuous, logistics regression is appropriate for developing a prediction model. In this study, as the dependant variable is binary that whether the company is under financial distress or not, binary logistics regression is suitable and is used to develop a prediction model of financial distress. The logistic function is as follow:
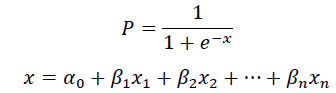
Where P is the probability of the occurrence of the event of financial distress; β is the coefficient of variables; α_0 is the constant.
When P is larger than 0.5, it is considered that the event of financial distress is more likely to occur. Moreover, when it is closer to 1, it is more likely to happen. On the contrary, when it is smaller than 0.5, the company is considered more likely to be stable.
Research Framework

Figure 1: Theoretical Framework
As illustrated by Figure 1, in the development of new models, the independent variables are companies’ profitability, solvency, cash flow, growth capability and operating capacity, while the dependant variable is the financial performance of the company that if the company is under financial distress. Meanwhile, each ability is reflected by different financial ratios, such as net profit margin and gross operating margin for profitability. First of all, the independent variables will be tested in term of normality distribution. If so, the parametric test of independent sample T-test would be implemented to check if there is a difference between the means of each variable of companies under financial distress and without financial distress. If not, the non-parametric test of Mann-Whitney U-test would be applied to compare the median of each variable of firms under financial distress and without financial distress. Second, the principal components analysis will be conducted to determine the principal components of the selected factors. Subsequently, a prediction model can be created by the principal components. Third, a binary logistics regression will be performed, based on the independent variables in terms of five aspects of corporate financial performance and the dependent variable of financial status.
The Sampling Procedure and Size
The population of the study is all the Chinese public listed companies in Shenzhen and Shanghai Stock Exchanges. In 2020, there are 3584 listed companies in 2018 from 19 different industries, while in 2013, there were merely 2489 listing companies. The samples for conducting the study will be randomly extracted from the entire population of public listed companies from the years of 2013 to 2018, wherein the population size is 18050 firm years.
In accordance with Taherdoost (2016), who has summarized a technique for determining the sample size for researches, in order to achieve a confidence level of 95% and a margin of error of 5% which is acceptable for a social study, research targeting on a population with 3000, requires a sample size of 341, while the minimum sample size could be 384 for any population larger than 100,000. Further, the higher the sample size, the less the margin of error would be. Thus, the ideal sample size for this study should be 384. However, after filtering firms missing accounting data and outliers of companies with financial ratios deviating from the mean value as much as two times of standard deviation, there are 155 and 276 financially distressed firms in the fiscal year t and t+1 respectively. Therefore, by randomly sampling the financially stable firms and combining them with the randomly selected financially distressed companies, two samples have been created with sizes of 310 and 552, respectively.
The first sample is the estimation sample including a total of 310 cases to develop the PCPM and BLRM and to compare them with Z(China)-score model and O-score model. In this sample, the dependent variable is their financial status that if the company is under financial distress of fiscal year t. While the dependent variables in sample 2 is the firms’ financial status of fiscal year t+1.
Data Collection Strategy
Because the sample for the research is relatively large, it is difficult to collect data, including corporate financial metrics and ratios, and financial distress judgement from those companies one by one. However, those data are already available in those commercial database companies, and the data is accessible in a famous and reputable database for reducing costs and time. Therefore, secondary data from 2013 to 2018 are used to conduct the research, and they are retrieved from the CSMAR database. The data needed for this research include financial indicators from corporate annual financial reports, market equity related to stock market information, macroeconomic indicators of GNP (Gross National Product) price index. Additionally, the information that companies being posted special treatment during the period from 2013 to 2020 are also needed for the research. All of those data are retrieved from the database, as those data are already collected and organized by the CSMAR database from the CSRC and other channels such as the NBSC (National Bureau of Statistics of China).
Data Analysis Methods
Descriptive Analysis
In the section of descriptive analysis, three popular indicators are used to assess the prediction models. They are accuracy, precision, and recall developed based on the concepts from the confusion matrix (Saito & Rehmsmeier, 2015). True Positive indicates that a positive subject is classified as positive; on the contrary, False Positive means that a negative subject is wrongly categorized as positive. Similarly, False Negative indicates a wrongly classified negative, and True Negative means a correctly classified negative. On the other hand, FP also refers to Type I Error, and FN is the same as Type II Error. In the prediction of financial distress, the positive class refers to the company with financial distress, while negative implies a company with stable status.
Accuracy is the most intuitive measure, as it answers the question of how many companies are correctly classified in terms of financial distress from all the companies. Precision answers the question of how many companies are being classified as with financial distress are actually under financial distress. Recall answers the question of how many companies under financial distress are being classified as financial distress. The calculation of accuracy, precision and recall are shown as below:
Accuracy=(TP+TN)/(TP+FP+FN+TN)
Precision=TP/(TP+FP)
Recall=TP/(TP+FN)
Precision and recall are observed in the positive sample and negative sample respectively, therefore, the imbalance of a sample would not influence the measurement. However, in this research, all the samples are balanced with equal numbers of positive and negative cases; in other words, the numbers of companies under financial distress and stable are equal. Therefore, the measurement of accuracy, precision, and recall can all be used to evaluate the performance of those models. However, it is concerned that recall would be one of the most important measures for the prediction of financial distress, as we want to find out as much as possible all the companies that are under financial distress or going to suffer financial distress.
ROC Curve and AUC
Receiver Operating Characteristic (ROC) Curve is a popular and useful approach for evaluating and comparing binary classifiers, and determines which one is better (Krzanowski & Hand, 2009). The ROC curve is usually a continuous curve displaying True Positive Rate (TPR) on the Y-axis and False Positive Rate (FPR) on the X-axis, with a variation of classification threshold. The closer it comes to the top left-hand corner of the graph; the better is the performance of the classifier. In binary classification, it is assumed that every observation is a member of one of two classes (positive and negative). The observations with a rating value higher than the certain threshold would be classified as positive; on the contrary, observations below the threshold would be categorized as negative (Cook & Rajbhandari, 2018).
There are two parameters used to evaluate the classification performances of classifiers:
Sensitivity=TPR=TP/(TP+FN)
Specificity=TNR=TN/(FP+TN)
1-Specificity=FPR=FP/(FP+TN)
Since we care more about the positive cases, thus, the question of how many negative cases have been predicted as positive is needed to be answered. FPR answers this question, which equals to 1 – Specificity. Therefore, sensitivity also equals TPR on the Y axis, while 1 – Specificity equals FPR on the X-axis in the graph of the ROC curve. A higher sensitivity or specificity means a better classifying performance.
While for a classifier, one of the most important factors is the cut-off, which can determine the accuracy of prediction. The ROC curves can illustrate a rating’s trade-off between TPs and FNs by plotting sensitivity as a function of specificity for all possible cut-offs (Cook & Rajbhandari, 2018).
Based on the ROC curve, a common composite performance measure used to determine the optimal cut-off of a classifier is Youden’s index. Youden’s index is the maximum of TP - FP, equivalently TP+TN−1, or Sensitivity+Specificity −1(Krzanowski & Hand, 2009). To be specific, the value of cut-off for a binary classifier can be determined by the value of the model’s numeric result corresponding to the maximum value of TP-FP, which is Youden’s index. As in the prediction of corporate financial distress, the main aim of that is to precisely forecast or diagnose if a company is under financial distress, Youden index can be applied to determine the optimal threshold for the classification models.
The Area Under the Curve (AUC) is a common measure to evaluate and compare the performances of two or more classifiers. The meaning is, when AUC is 0.8, given a positive and a negative sample, it implies there is an 80% chance that the model will be able to categorize a correctly positive group and negative group. The formula for AUC is as follow:
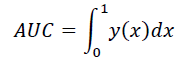
Usually, AUC has a range from 0.5 to 1. An AUC value of 0.5 indicates that the classifier does not have any classification capability, and the graph becomes the diagonal, while the value of 1 implies perfect classification. As given by Table 1, there is an excellent classifier if the AUC>0.95, and the classifier is good if the AUC is larger than 0.75.
| Table 1 Criteria of Classifier Evaluation |
|
|---|---|
| AUC | Description |
| > 0.99 | Nearly perfect |
| 0.85 – 0.95 | Very strong |
| 0.75 – 0.85 | Strong |
| 0.65 – 0.75 | Substantial |
| 0.50 – 0.65 | Moderate |
| ≤ 0.50 | Abysmal |
Principal Components Prediction Model
First, the KMO measure is 0.649, which is higher than the minimum requirement of 0.6, and a p-value less than 0.05 indicates that principal components analysis can be conducted. The proportion of total variance explained is 87%, which is higher than 85%, indicating that it is sufficient for the principal components to represent them. According to the variance explained by components, which is to be the coefficient of each component in the prediction model, the final prediction model is as below:

Where F is a score for each company representing the company’s overall financial performance, and the next step is to assign a proper cut-off for the model, to classify financially distressed and financially stable firms using the method of Youden’s index.
Using the function of the ROC curve in SPSS software, the Youden’s index is found with a value of 0.323. The corresponding F score of the model is 0.056. Thus the cut-off value is 0.056. This cut-off means that if the PCA model gives a company an F score less than or equal to 0.056, the company is predicted to be under financial distress, and vice versa.
Logistics Regression Model
First of all, the Omnibus tests (p=0.000) indicates that the new BLR model is statistically significant and better than the intercept-only model in block 0. The Cox & Snell R2 (0.329) and Nagelkerke R2 (0.438) indicate that the model explains around 32.9% to 43.8% of the variation of the dependent variable (a company’s financial status). The Hosmer-Lemeshow tests the null hypothesis that the predictions by the new model fit perfectly with observed group memberships (Wuensch, 2014). The p-value is 0.231, which is higher than 0.05, indicates the acceptance of the null hypothesis that the model fit with the data well.
Finally, variables of x_1 (p=0.015), x_2 (p=0.000), x_3 (p=0.021), x_4 (p=0.000), x_5 (p=0.000), x_6 (p=0.010), x_7 (p=0.000), x_8 (p=0.000) and x_9 (p=0.005) added significantly to the model. However, the constant is not significant in the model. Meanwhile, the variable of Debt to Assets Ratio (x_4) is the most significant variable in the model, which indicates that every unit increases in the Debt to Asset Ratio, financial distress is 13.481 times more likely to occur in the company.
As a result, the model can be formulated by the coefficients of each variable as below:

Where x_1=Operating Index, x_2=Capital Accumulation Rate, x_3=Net Assets per Share, x_4=Debt to Assets Ratio, x_5=Growth Rate of Operating Profit, x_6=Comprehensive Income Per Share, x_7=Growth Rate of Total Assets, x_8=Total Assets Turnover, x_9=Gross Operating Margin.
The cut-off for the P score generated from the BLR model is 0.5. If the P score is higher than 0.5, the company is classified as financial distress, while a company with a P score less than 0.5 would be considered to be financially stable.
Assignment of Cut-Off for O-score Model
In order to adjust the O-score model to make it fit the characteristics of Chinese public listed firms, a new threshold for the model is to be assigned by Youden’s index. As conducted by SPSS software, the Youden’s index of O-score model is 0.284, with a corresponding O score of -3.454. Therefore, the cut-off for O-score model specifically for Chinese public listed firms is -3.454. Companies with an O score higher less than or equal to -3.454 indicate it is under financial distress predicted by O-score model.
Findings
Based on the logistics regression analysis, there are nine financial ratios including operating index, debt to assets ratio, net assets per share, gross operating margin, comprehensive income per share, total assets turnover, capital accumulation rate, growth rate of operating profit and growth rate of total assets have been added into the prediction model, indicating their power of classifying or predicting financial distress of Chinese public listed companies. They belong to the aspects of a company’s cash flow, solvency, operating capability and growth capacity, wherein the growth capacity has the most variables. Therefore, it is clear that there is a significant relationship between companies’ growth capacity, operating capability, profitability, solvency, cash flow and their potential of experiencing financial distress.
There are four sub-hypotheses to be tested as below:
Hypothesis 1: There is a significant difference between the mean value of the Z(China) score of companies under financial distress and without financial distress in the fiscal year t;
Hypothesis 2: There is a significant difference between the mean value of the O score of companies under financial distress and without financial distress in the fiscal year t;
Hypothesis 3: There is a significant difference between the mean value of the F score of companies under financial distress and without financial distress in the fiscal year t;
Hypothesis 4: There is a significant difference between the mean value of the P score of companies under financial distress and without financial distress in the fiscal year t.
First of all, normality test is conducted to determine which method to be used to compare the means of financially distressed and financially stable firms. As illustrates in Table 2, wherein the Z score, O score, F score and P score represent the score of the Z(China)-score model, O-score model, PCA model and BLR model respectively, the Kolmogorov-Smirnov test indicates that all of these four models’ scores are not normally distributed (p<0.05).
| Table 2 Tests of Normality 1 |
||||||
|---|---|---|---|---|---|---|
| Tests of Normality | ||||||
| Kolmogorov-Smirnova | Shapiro-Wilk | |||||
| Statistic | df | Sig. | Statistic | df | Sig. | |
| Z score | 0.373 | 310 | 0.000 | 0.144 | 310 | 0.000 |
| O score | 0.056 | 310 | 0.022 | 0.970 | 310 | 0.000 |
| F score | 0.361 | 310 | 0.000 | 0.179 | 310 | 0.000 |
| P score | 0.095 | 310 | 0.000 | 0.947 | 310 | 0.000 |
While Table 3 shows that the scores of each model are significantly different between financially distressed and financially stable firms (p<0.05). Therefore, four hypotheses are all accepted.
| Table 3 Mann-Whitney U Test 1 |
||||
|---|---|---|---|---|
| Test Statistics | ||||
| Z score | O score | F score | P score | |
| Mann-Whitney U | 6714.000 | 8351.000 | 7173.000 | 3323.000 |
| Wilcoxon W | 18804.000 | 20441.000 | 19263.000 | 15413.000 |
| Z | -6.715 | -4.640 | -6.133 | -11.012 |
| Asymp. Sig. (2-tailed) | 0.000 | 0.000 | 0.000 | 0.000 |
Descriptive Analysis
As shown in Table 4, the model providing the highest overall accuracy in classifying financial distress of fiscal year t is the BLR model, with an accuracy rate of 80.32%. It means the model is able to classify 80.32% of the total of companies correctly in terms of financial distress. Meanwhile, the precision of the BLR model is also the highest amongst the four models, at a rate of 81.94%, indicating 81.94% of companies being classified as with financial distress are actually under financial distress. Further, the BLR model also provides the highest recall amongst these four models, at a rate of 79.38%, meaning 79.38% of firms under financial distress are being classified as financial distress. Therefore, the classification ability of the BLR model for the fiscal year t is significantly well, compared with the Z(China)-score model, O-score model, and PCA model.
| Table 4 Model Comparison 1 |
||||||||
|---|---|---|---|---|---|---|---|---|
| Model prediction | FD | Stable | Overall | Accuracy | Precision | Recall | ||
| FD | TYPE I Error | Stable | Type II Error | |||||
| Z(China)-score model | 95 | 29 | 126 | 60 | 221 | 71.29% | 61.29% | 76.61% |
| O-score model | 64 | 20 | 135 | 91 | 199 | 64.19% | 41.29% | 76.19% |
| PCA model | 74 | 25 | 130 | 81 | 204 | 65.81% | 47.74% | 74.75% |
| BLR model | 127 | 33 | 122 | 28 | 249 | 80.32% | 81.94% | 79.38% |
ROC Curves and AUC

Figure 2: ROC Curve 1
Moving on, as demonstrated by Figure 2, the four ROC curves show the classificatory abilities of the four models, respectively. The closer to the top left corner, the higher the classification performance the model has. Therefore, the same result as the descriptive analysis above, the performance of classification of the BLR model is remarkably better than the other three models.
Finally, the p-values of the four models are all less than 0.05 (See Table 5), indicating the four models do a significant job at classifying financial distress. While, the AUC of the BLR model is the highest one which is 0.862, meaning the best predictive accuracy among the four models.
| Table 5 AUC 1 |
|||||
|---|---|---|---|---|---|
| Area Under the Curve | |||||
| Test Result Variable(s) | Area | Std. Errora | Asymptotic Sig.b | Asymptotic 95% Confidence Interval | |
| Lower Bound | Upper Bound | ||||
| Z score | 0.721 | 0.031 | 0.000 | 0.661 | 0.780 |
| O score | 0.652 | 0.031 | 0.000 | 0.591 | 0.714 |
| F score | 0.701 | 0.030 | 0.000 | 0.643 | 0.760 |
| P score | 0.862 | 0.021 | 0.000 | 0.820 | 0.904 |
Hypothesis 5: There is a significant difference between the mean value of the Z(China) score of companies under financial distress and without financial distress in the fiscal year t+1;
Hypothesis 6: There is a significant difference between the mean value of the O score of companies under financial distress and without financial distress in the fiscal year t+1;
Hypothesis 7: There is a significant difference between the mean value of the F score of companies under financial distress and without financial distress in the fiscal year t+1;
Hypothesis 8: There is a significant difference between the mean value of the P score of companies under financial distress and without financial distress in the fiscal year t+1.
First, the Kolmogorov-Smirnov test means that all of these four models’ scores are not normally distributed (p<0.05). Next, the scores of Mann-Whitney U test of each model are significantly different between financially distressed and financially stable firms (p<0.05). Therefore, four hypotheses are all accepted.
Descriptive Analysis
| Table 6 Model Comparison 2 |
||||||||
|---|---|---|---|---|---|---|---|---|
| Model prediction | FD | Stable | Overall | Accuracy | Precision | Recall | ||
| FFD | TYPE I Error | Stable | Type II Error | |||||
| Z(China)-score model | 240 | 52 | 224 | 36 | 464 | 84.06% | 86.96% | 82.19% |
| O-score model | 192 | 38 | 238 | 84 | 430 | 77.90% | 69.57% | 83.48% |
| PCA model | 203 | 50 | 226 | 73 | 429 | 77.72% | 73.55% | 80.24% |
| BLR model | 206 | 80 | 196 | 70 | 402 | 72.83% | 74.64% | 72.03% |
Surprisingly, the model generating the best accuracy in predicting financial distress of fiscal year t+1 turns to the Z(China)- score model (see Table 6), with an accuracy rate of 84.06%. Similarly, the precision of the Z(China)-score model is also the significantly highest among the four models, at a rate of 86.96%. However, the model providing the highest recall among these four models is the O-score model, at a rate of 83.48%, followed by the Z(China)-score model with 82.19%. As a whole, the Z(China)-score model is the best model to predict financial distress in the year t+1. However, the BLR model becomes the worst model, with an accuracy rate of only 72.83%.
ROC Curves and AUC

Figure 3: ROC Curve 2
As displayed by Figure 3, the four ROC curves show the predictive performances of the four models. It is clear that the predictive performances of the O-score model, the PCA model and the BLR model are close, while the Z(China)-score model is overall the best one.
Finally, the p-values of the four models are all less than 0.05 (See Table 7), indicating the four models do a significant job in the prediction of financial distress. While the AUC of the Z(China)-score model is the highest one, meaning the highest predictive ability. Furthermore, all of the four models have generated an AUC higher than 0.8, which means that all of the four models are strong in predicting financial distress in the fiscal year of t+1.
| Table 7 AUC 2 |
|||||
|---|---|---|---|---|---|
| Area Under the Curve | |||||
| Test Result Variable(s) | Area | Std. Errora | Asymptotic Sig.b | Asymptotic 95% Confidence Interval | |
| Lower Bound | Upper Bound | ||||
| Z score | 0.898 | 0.015 | 0.000 | 0.868 | 0.927 |
| O score | 0.841 | 0.017 | 0.000 | 0.807 | 0.874 |
| F score | 0.843 | 0.017 | 0.000 | 0.810 | 0.877 |
| P score | 0.801 | 0.019 | 0.000 | 0.763 | 0.839 |
Conclusion
Based on the data of 25 financial ratios in terms of a company’s profitability, solvency, cash flow, growth capacity and operating capability from the year of 2013 to 2018 collected from CSMAR Database, a PCA model and a BLR model are developed and compared with the famous Z-score model and O-score model.
First of all, the results reveal that there is a significant relationship between companies’ growth capacity, operating capability, profitability, solvency, cash flow and their potential of experiencing financial distress. However, regardless of factors of profitability, solvency and cash flow which have been widely used in prediction of financial distress, it was found that financial ratios in terms of a company’s growth capacity and operating capability are also significant in classifying financial distress in the BLR model. Therefore, except the traditionally recognized factors of profitability, solvency, and cash flow, a company’s growth capacity and operating capability are also significantly influential factors in the prediction of financial distress.
Furthermore, that all the sub-hypotheses are all accepted indicates all of the four models are able to classify or predict financial distress of Chinese public companies, by giving a particular score for a company and comparing it with a cut-off. For the same reason, Research Hypotheses I, Research Hypotheses II, Research Hypotheses III and Research Hypotheses IV are all accepted.
Finally, in terms of the classification of financial distress for fiscal year t, the BLR model developed in this research provides the best performance, with an accuracy rate of 80.32%, a precision rate of 81.94% and a recall rate of 79.38%. While regarding the prediction of financial distress for the fiscal year of t+1, the Z(China)-score model becomes the best one, with an accuracy rate of 84.06%, a precision rate of 86.96% and a recall rate of 82.19%.
To conclude, the four models are all able to predict financial distress. However, the Z(China)-score model is the most powerful one in doing this job one year prior to the occurrence of financial distress which indicating that it is more practical for investors to avoid loss from an investment.
References
Ahmed, M.U. (2017). Financial distress analysis of special treatment companies in China. International Journal of Chinese Culture and Management, 4(1), 19-29.
Crossref , Google scholar , Indexed
Altman, E.I., Hotchkiss, E., & Wang, W. (2019). Corporate financial distress, restructuring, and bankruptcy: Analyze leveraged finance, distressed debt, and bankruptcy. John Wiley & Sons.
Crossref , Google scholar , Indexed
Balasubramanian, S.A., Radhakrishna, G.S., Sridevi, P., & Natarajan, T. (2019). Modeling corporate financial distress using financial and non-financial variables. International Journal of Law and Management.
Crossref , Google scholar , Indexed
Beaver, W.H. (1966). Financial ratios as predictors of failure. Journal of accounting research, 71-111.
Bloomberg. (2019). China defaults hit record in 2018. 2019 Pace Is Triple That.
Crossref , Google scholar , Indexed
Chen, S., & Holdings, C.F. (2007). Corporate financial distress diagnosis in China.
Cook, J.A., & Rajbhandari, A. (2018). Heckroccurve: ROC curves for selected samples. The Stata Journal, 18(1), 174-183.
Crossref , Google scholar , Indexed
Davidson, W. (2020). Financial Statement Analysis, (3rd edition). Newark: John Wiley & Sons, Incorporated.
Devi, S.S., & Radhika, Y. (2018). A survey on machine learning and statistical techniques in bankruptcy prediction. International Journal of Machine Learning and Computing, 8(2).
Crossref , Google scholar , Indexed
Feng, N. (2018). Qiye caiwu weiji yujing moxing sheli ji fenxi Enterprise Financial Crisis Early Warning Model Establishment and Analysis'. ['Development and Analysis of Early Warning Model of Enterprise Financial Crisis']. Kuaiji zhiyou Friends of Accounting [Friends of Accounting], 9, 113-115.
Geng, R., Bose, I., & Chen, X. (2015). Prediction of financial distress: An empirical study of listed Chinese companies using data mining. European Journal of Operational Research, 241(1), 236-247.
Crossref , Google scholar , Indexed
Gneiting, T., & Vogel, P. (2018). Receiver Operating Characteristic (ROC) curves. arXiv preprint arXiv:1809.04808.
Crossref , Google scholar , Indexed
Guo, Z. (2018). Shangshi company caiwu weiji yujing moxing de shizheng fenxi: Empirical analysis of the financial crisis early warning model of listed companies'. ['Empirical analysis of the financial crisis early warning model of listed companies']. Caikuai xuexi Accounting Learning [Accounting Learning], 20, 223-224+226.
Crossref , Google scholar , Indexed
Kihooto, E., Omagwa, J., Wachira, M., & Ronald, E. (2016). Financial distress in commercial and services companies listed at Nairobi Securities Exchange, Kenya. European Journal of Business and Management, 8(27), 86-89.
Krzanowski, W.J., & Hand, D.J. (2009). ROC curves for continuous data. Crc Press.
Crossref , Google scholar , Indexed
Lessambo, F.I. (2018). Financial statements: Analysis and reporting. Springer.
Crossref , Google scholar , Indexed
Li, Y. (2018). Research on financial crisis prediction of listed manufaturing corporations with Pca-Svm model. Master. Harbin Institute of Technology.
Crossref , Google scholar , Indexed
Liu, K., Liu, W., & Xu, Q. (2020). Research on the financial crisis early warning of listed companies in China—based on probit model and logit model. Academic Journal of Business & Management, 2(3).
Crossref , Google scholar , Indexed
Morris, R. (2018). Early warning indicators of corporate failure: A critical review of previous research and further empirical evidence. Routledge.
Crossref , Google scholar , Indexed
Ohlson, J.A. (1980). Financial ratios and the probabilistic prediction of bankruptcy. Journal of accounting research,109-131.
Crossref , Google scholar , Indexed
Quan, C., & Cheng, X. (2010). Study on screening warning indicators of enterprise’s financial crisis [J]. Contemporary Economy & Management, 8.
Crossref , Google scholar , Indexed
Robinson, T.R. (2020). International financial statement analysis. John Wiley & Sons.
Saito, T., & Rehmsmeier, M. (2015). The precision-recall plot is more informative than the ROC plot when evaluating binary classifiers on imbalanced datasets. PloS one, 10(3), p.e0118432.
Crossref ,Google scholar , Indexed
Shumway, T. (2001). Forecasting bankruptcy more accurately: A simple hazard model.The journal of business, 74(1), 101-124.
Crossref , Google scholar , Indexed
Sun, Y. (2020). China bond investors battle to claim cash after defaults.
Taherdoost, H. (2016). Sampling methods in research methodology. How to Choose a Sampling Technique for Research.
Crossref , Google scholar , Indexed
Wang, S., Shen, X., Li, J., & Wang, S. (2010). Jiyu PCA-BLR moxing de gupiao touzi celve stock investment strategy based on PCA-BLR model' ['Stock investment strategy based on PCA-BLR model']. Zhongguo zhengquan qihuo China Securities & Futures [Securities & Futures of China], 8(10), 40-42.
Wang, Z. (2018). Shangshi gongshi caiwu weiji yujing moxing goujian yanjiu listed companies financial crisis warning model construction research'. ['Research on the Construction of financial crisis warning model for listed Companies']. Caikuai xuexi Accounting learning [Accounting Learning], 12, 25-26.
Weinland, D. (2019). Corporate defaults in China surge in 2019 to record high $18.6Bn.
Wu, X., Dai, S., Shi, Y., Xiaojiang, W., Shenglei, D., & Yuying, S. (2018). Caiwu baobiao fenxi Financial Statement Analysis'. ['Analysis of financial statement']. Southwestern University of Finance and Economics Press.
Wuensch, K.L., (2014). Binary logistic regression with SPSS. Retrieved March, 18, 2015.
Zhang, A., Zhu, & Xu, D. (2001). Shangshi company caiwu shibai de zhuchengfen yuce moxing jiqi shizheng yanjiu Principal component forecasting model and empirical research on the financial failure of listed companies' ['The principal Component prediction model of financial failure for listed companies and its empirical research']. Jingrong yanjiu Journal of Financial Research], 3, 10-25.
Received: 16-Dec-2021, Manuscript No. AAFSJ-21-9120; Editor assigned: 18-Dec-2021, PreQC No. AAFSJ-21-9120(PQ); Reviewed: 28-Dec-2021, QC No. AAFSJ-21-9120; Revised: 09-Jan-2022, Manuscript No. AAFSJ-21-9120(R); Published: 16-Jan-2022