Research Article: 2022 Vol: 28 Issue: 6
Predicting the Stock Prices of Indonesia′s State-Owned Enterprises by Using Arima and Garch Model
Muhammad Yunus Kasim, Tadulako University
Darman, Tadulako University
Juliana Kadang, Tadulako University
Husnah, Tadulako University
Citation Information: Kasim, M.Y., Darman, Kadang, J., Husnah. (2022). Predicting the stock prices of indonesia’s state-owned enterprises by using arima and garch model. Academy of Entrepreneurship Journal, 28(6), 1-7.
Abstract
This study aims to identify and analyze stock price projections and the application of the ARIMA & ARCH/GARCH model in State-Owned Enterprises listed on the Indonesia Stock Exchange. This research is a descriptive research with a quantitative approach. Data was collected through recording stock prices for each company as many as 19 companies from January 2017 to December 2019 at www.idx.co.id. The results of the research show that the average stock price movement in 2017 decreased due to global economic conditions such as the weakening of the rupiah against the US dollar, sluggish coal and nickel commodity prices, decreased demand for imports of raw materials from China, rising world oil prices, company policies in expanding, and government policies in the infrastructure sector. In 2018, stock price movements rose again due to the improving global economy and in 2019 the average stock price movement tended to be stable. The model used on the stock prices of PGAS, BBRI, and BMRI companies uses the ARIMA (1,0,1) model. The ARIMA model is sufficient to use on the stock price because the normality conditions are met. Meanwhile, the stock prices of PTBA, ANTM, TINS, KRAS, SMBR, SMGR, INAF, KAEF, ADHI, WIKA, PTPP, GIAA, TLKM, JSMR, BBNI, and BBTN use the GARCH (1,0,1) model which indicates volatility in the data that causes the error contains homoscedasticity and results in the non-fulfillment of the normality requirements of the model.
Keywords
Stock Prices, ARIMA, ARCH / GARCH, Indonesia, State-Owned Enterprises.
Introduction
Per capita income in a developing or developed country can be seen from the development of the capital market. The most prominent characteristic is seen from its market capitalization value, namely the number of listed companies, cumulative trading volume, strict capital market regulations, as well as the advancement of supporting technology and domestic investor culture.
Capital markets in developing countries have the consequence of a small market capitalization value. Market capitalization is usually seen from the comparison ratio with the value of a country's Gross Domestic Product (GDP). Another consequence is that there is a thin volume of trading transactions, more due to the asynchronous trading in the market. Asynchronous trading is caused by the number of securities listed but not completely traded or no transactions occur. The investment climate in Indonesia is still improving and is being maintained by the government. In fact, many foreign investors invest in this country. In Indonesia, for foreign investors, there are many national companies that are in the strategic sector of the country, offered by foreign institutions through the acquisition of shares. Foreign investment should be able to boost the macro economy because of the inflow of funds.
The aims of this research are to analyze stock price movements in state-owned companies listed on the Indonesia Stock Exchange, to know the factors that affect stock prices in state-owned companies listed on the Indonesia Stock Exchange, and to apply the ARCH/GARCH model to obtain stock price modeling in state-owned companies listed on the Indonesia Stock Exchange in order to provide information for an investor.
Literature Review
Foreign investors invest in developing countries for the general reason that developing countries' market potential has not been fully explored. In addition to attracting natural resources, labor wages are still cheap, and as a target for products and services. Another reason is the striking difference with developed countries, developing countries are categorized as growing while developed countries are mature. This can be interpreted that developing countries have more attractiveness from high economic growth and automatically accompanied by high returns. Economic growth is an aggregate indicator of the industry in a country.
Stock index is one of the variables used to measure economic performance in a country. This is possible because when the country has bright economic prospects, investors will automatically be attracted to invest their funds in the capital market of the country concerned. This will encourage the occurrence of bullish periods which will encourage the movement of the stock index. On the other hand, when the economic atmosphere is gloomy, it will also be reflected in the stock index which will decline.
Listing on the Indonesia Stock Exchange (IDX) is one way for issuers to obtain fresh funds from the capital market. Referring to the conditions set by the capital market manager, issuers can conduct their initial public offering through the initial public offering (IPO) mechanism. State-owned companies in Indonesia that go public based on data from the website www.SOE.go.id consist of 6 sectors, namely Mining, Basic Industry and Chemicals, Consumer Goods Industry (Pharmaceuticals), Construction, Infrastructure, and Finance.
Two types of stock analysis are generally carried out in the investment world, namely technical and fundamental analysis. These two ways of analyzing then differentiate the type of investor, whether he is a Trader or a Value Investor. The advantages and risks of the two analytical techniques are certainly much different.
Technical analysis techniques are not much different from stock analysis or other financial investment assets. The most popular technical indicators used as tools include the Moving Average, Moving Average Convergence Divergence (MACD), Relative Strength Index (RSI), and the Stochastic Oscillator indicator. The four indicators are used by Traders to analyze limited to seeing stock price movements and changes in direction based on the technique of each indicator through charts/charts that make it easier to identify trends in stock movements in general so that investors can decide on investments.
Statistical modeling of stock prices is one of the methods used to describe the characteristics of time series data in the financial sector on returns and risks using the Autoregressive Conditional Heteroscedastic (ARCH) method which was first introduced by Engle (2001). In its development, Enders (2008) to avoid large orders in the ARCH model, Bollerslev (1986) developed the Autoregressive Generalized Conditional Heteroscedastic (GARCH) model. This method is able to overcome problems with time series data, in this case stock returns which tend to have high volatility and non-constant diversity are called time series data with conditional heteroscedasticity.
Methodology
This study uses a quantitative forecasting approach through the Generalized Autoregressive Conditional Heteroscedastic (GARCH) method to obtain the best model that can provide information on the condition of each share of the SOE sector company. The data used in this study is secondary data obtained by recording the data of public companies owned by SOEs listed on the Indonesia Stock Exchange (IDX) through the website www.idx.co.id.
The data analysis technique used is time series analysis using the GARCH method using Excel 2007 and Eviews 10 software (Table 1).
| Table 1 Stock Price Closing Data Modeling for All Issuers | ||||
| No | Name of Issuer | Stock Code | Model | Information |
| 1. | PT. Tambang Batubara Bukit Asam (Persero) Tbk | PTBA | 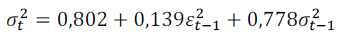 |
GARCH (1,1) |
| 2. | PT. Aneka Tambang (Persero) Tbk | ANTM |  |
GARCH (1,1) |
| 3. | PT. Timah (Persero) Tbk | TINS |  |
GARCH (1,1) |
| 4. | PT. Krakatau Steel (Persero) Tbk | KRAS |  |
GARCH (1,1) |
| 5. | PT. Semen Baturaja (Persero) Tbk | SMBR | 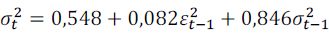 |
GARCH (1,1) |
| 6. | PT. Semen Gresik (Persero) Tbk | SMGR | 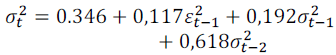 |
GARCH (1,2) |
| 7. | PT. Indofarma (Persero) Tbk | INAF | 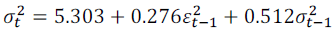 |
GARCH (1,1) |
| 8. | PT. Kimia Farma (Persero) Tbk | KAEF | 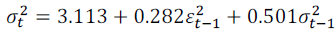 |
GARCH (1,1) |
| 9. | PT Adhi Karya (Persero) Tbk | ADHI |  |
GARCH (1,1) |
| 10. | PT. Wijaya Karya (Persero) Tbk | WIKA |  |
GARCH (1,1) |
| 11. | PT. Pembangunan Perumahan (Persero) Tbk | PTPP |  |
GARCH (1,1) |
| 12. | PT. Garuda Indonesia (Persero) Tbk | GIAA |  |
GARCH (1,1) |
| 13. | PT. Perusahaan Gas Negara (Persero) Tbk | PGAS |  |
ARIMA(1,0,1) |
| 14. | PT. Telkom (Persero) Tbk | TLKM | 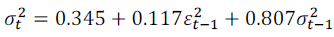 |
GARCH (1,1) |
| 15. | PT. Jasa Marga (Persero) Tbk | JSMR | 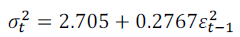 |
ARCH (1) |
| 16. | PT. Bank BNI (Persero) Tbk | BBNI |  |
GARCH (1,1) |
| 17. | PT. Bank BRI (Persero) Tbk | BBRI | 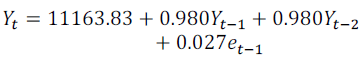 |
ARIMA(1,0,1) |
| 18. | PT. Bank BTN (Persero) Tbk | BBTN | 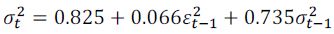 |
GARCH (1,1) |
| 19. | PT. Bank Mandiri (Persero) Tbk | BMRI | 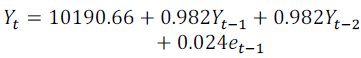 |
ARIMA(1,0,1) |
In the mining sector, PTBA issuers have the highest average share price of Rp. 9,327. In the basic and chemical industry sectors, SMGR issuers have the highest average share price of Rp. 10,548. The comparison of the average stock prices of INAF and KAEF issuers is not much different. KAEF issuers move at an average of Rp. 1,787 while INAF issuers move at an average of Rp. 1,606 (Table 2).
| Table 2 Comparison of Sectoral Data of Mining, Industry and Consumer Goods | |||||||||||
| Mining | Industry | Consumer Goods | |||||||||
| PTBA | ANTM | TINS | KRAS | SMBR | SMGR | INAF | KAEF | ADHI | WIKA | PTPP | |
| Mean | 9.327 | 655 | 821 | 522 | 1.425 | 10.548 | 1.606 | 1.787 | 2.315 | 2.637 | 3.591 |
| Median | 10.309 | 693 | 818 | 518 | 648 | 10.120 | 1.346 | 1.340 | 2.240 | 2.665 | 3.738 |
| Maximum | 13.164 | 917 | 1.186 | 849 | 3.508 | 15.184 | 4.341 | 3.162 | 3.030 | 3.625 | 4.382 |
| Minimum | 4.380 | 308 | 491 | 290 | 272 | 8.781 | 133 | 680 | 1.754 | 1.586 | 2.521 |
| Std. Dev. | 2.679 | 175 | 184 | 163 | 1.208 | 1.687 | 1.410 | 782 | 332 | 483 | 480 |
| Skewness | -0.411 | -0.607 | 0.162 | 0.280 | 0.411 | 1.401 | 0.409 | 0.326 | 0.359 | 0.074 | -0.731 |
| Kurtosis | 1.765 | 2.393 | 2.446 | 1.969 | 1.437 | 4.105 | 1.724 | 1.581 | 2.271 | 2.822 | 2.781 |
| Jarque-Bera | 3.302 | 2.764 | 0.618 | 2.063 | 4.679 | 13.611 | 3.447 | 3.660 | 1.571 | 0.080 | 3.279 |
| Probablity | 0.091 | 0.251 | 0.733 | 0.356 | 0.096 | 0.001 | 0.178 | 0.160 | 0.455 | 0.960 | 0.194 |
| Observation | 36 | 36 | 36 | 36 | 36 | 36 | 36 | 36 | 36 | 36 | 36 |
In the construction and building sector, PTPP issuers have the highest average share price of Rp.3,591. In the infrastructure sector, JSMR issuers have the highest average share price of Rp. 5,472. In the financial sector, BBRI issuers have the highest average share price of Rp.13,050 (Table 3).
| Table 3 Comparison of Sectoral Data of Construction, Infrastructure and Finance | |||||||||||
| Construction | Infrastructure | Financial | |||||||||
| ADHI | WIKA | PTPP | PGAS | JSMR | TLKM | GIAA | BBNI | BBRI | BBTN | BMRI | |
| Mean | 2.315 | 2.637 | 3.591 | 2.943 | 5.472 | 3.818 | 401 | 5.960 | 13.050 | 1.826 | 10.274 |
| Median | 2.240 | 2.665 | 3.738 | 2.677 | 5.352 | 4.090 | 364 | 5.659 | 11.855 | 1.731 | 10.464 |
| Maximum | 3.030 | 3.625 | 4.382 | 5.494 | 7.107 | 4.736 | 600 | 9.208 | 34.433 | 3.446 | 13.357 |
| Minimum | 1.754 | 1.586 | 2.521 | 1.611 | 4.242 | 2.717 | 303 | 4.401 | 9.503 | 1.021 | 6.856 |
| Std. Dev. | 332 | 483 | 480 | 990 | 799 | 734 | 81.91 | 1.102 | 4.750 | 673 | 1.624 |
| Skewness | 0.359 | 0.074 | -0.731 | 1,201 | 0.553 | -0.428 | 0.754 | 0.833 | 3.406 | 0.706 | -0.140 |
| Kurtosis | 2.271 | 2.822 | 2.781 | 3,684 | 2,536 | 1.555 | 2.463 | 3.332 | 14.637 | 2.553 | 2.320 |
| Jarque-Bera | 1.571 | 0.080 | 3.279 | 9,372 | 2.158 | 4.231 | 3.844 | 4.333 | 272 | 3.291 | 0.811 |
| Probablity | 0.455 | 0.960 | 0.194 | 0,009 | 0.339 | 0.1205 | 0.146 | 0.114 | 0.000 | 0.192 | 0.666 |
| Observation | 36 | 36 | 36 | 36 | 36 | 36 | 36 | 36 | 36 | 36 | 36 |
The results of the study show that the movement of stock prices up and down in 19 state-owned companies in six sectors is highly dependent on global economic conditions, commodity prices, government policies, company policies, and company financial statements. The phenomenon of the global economy in 2017 which led to a decline in stock prices in all sectors due to the weakening of mining raw material commodity prices, the weakening of the rupiah exchange rate against the US dollar, and the government's policy of reducing gas prices and toll rates. The company's internal factors also contributed to the decline in stock prices in several companies due to poor financial reports. However, in 2018 to 2019 stock prices tend to increase and move constantly also influenced by improving global economic conditions through economic growth in Indonesia which increased by 0.23% in 2018 and 0.05% in 2019.
Several factors that affect stock prices in this study are in line with research that has been carried out to determine the factors that affect the world capital market in several countries. Research conducted by Yang et al. ( 2003) found that both before and after the crisis, the capital markets in the United States and Japan still had an influence on capital markets in Asia, one of which was Indonesia. Darrat & Zhong (2002) state that the capital markets in the United States, Hong Kong, Japan and Singapore have a significant influence on capital markets in Asia Pacific. Karim et al. (2005) ) concluded in their research that the Indonesian capital market is closely related to capital market conditions in America, Japan and China. Wong et al. (2004) stated that the capital markets in the United States, Britain and Japan have links to several countries in Asia which are included in emerging markets.
Other studies to determine the effect of world oil prices on the capital market, including research by Hayo & Kuntan (2005) found evidence that capital market movements in Russia are influenced by changes in world oil prices and capital market movements in the United States (Dow Jones Index). Research by Kilian & Park (2009) shows that the movement of oil prices has no direct effect on the United States capital market. Besides oil, gold is one of the important commodities that can affect the movement of the stock market. This is based on the fact that gold is an alternative investment that tends to be safe and risk-free (Sunariyah, 2006). The research results for the world gold variable give the opposite conclusion. Research conducted byTwite (2002) found that gold is one of the factors that positively influences stock index movements in Australia, while Smith (2001) shows that world gold prices have a negative influence on stock price index movements in the United States. Other factors that should be considered besides the movement of global stock indices and commodity indicators such as oil prices and gold prices, the next thing worth considering is the exchange rate. Changes in exchange rates greatly affect companies, especially companies listed on the stock exchange so that it will have an impact on changes in the stock exchange index in a country.
The theory put forward by Houston & Brigham (2010); regarding the main factors that influence stock prices, namely changes in interest rates, economic regulations issued by the government, announcements of company financial statements, and announcements of company investments such as factory expansion, research development and business closures. other. This theory is in line with the research results obtained in accordance with the conditions of stock price movements in 19 state-owned companies in six sectors.
Fluctuations in the return time series data have high volatility and different variations at each point in time. The ARIMA model is used for time series data where the error variance is heteroscedasticity. This is indicated by testing the normality of the estimated model. The results of the normality test on the model estimation generated in the ARCH/GARCH model more meet the normality requirements than the ARIMA model used in this study. The performance of the ARCH/GARCH model is in line with previous research conducted by Nur Widiyawati in 2009 regarding the Application of the GARCH Model and the EGARCH Model on Property Sector Stocks during the World Economic Crisis. tall one. This is in accordance with the theory put forward by Enders (2008), namely time series data in the financial sector showing periods of high volatility followed by periods of relative calm, indicating that the assumption of constant error is not met (homoscedasticity). The GARCH model works by relating the variance of the error at time t to the variance of the error at the previous time.
The ARIMA model is still used on PGAS, BBRI, and BMRI stocks because after testing the model meets the requirements for normality in the time series data of these stocks. This research is in accordance with the research conducted by Bayu Arestya Ramadhan regarding Comparative Analysis of ARIMA Method and GARCH Method to Predict Stock Prices in Telecommunication Companies Listed on the IDX in 2012 to 2013 providing the results of the ARIMA model that can be used to model the stock prices of TLKM, ISAT, and EXCL because the time series data is stationary when differentiation and logarithmic transformation are performed. The resulting model also meets the normality requirements, meaning that the variance in the time series data does not experience homoscedasticity.
Conclusion
Based on the results of the analysis of stock price movements in state-owned companies from 2017 to 2019 it can be concluded that stock prices in all sectors tended to decline in 2017 due to global economic turmoil such as the improvement in the United States economy getting more solid so that the Fed decided to increase the Fed Funds Rate in December 2017, the economic recovery was not yet conclusive and the economic growth slowdown in China, and the recovery of the Euro and Japan is still limited and not solid enough. The flow of foreign funds that entered the capital market throughout 2018 was better than 2017). Economic data in 2018 was quite good, such as increasing loan growth so that this achievement could be capital for the JCI to return to record positive results next year; 3). Economic conditions in 2019 are even better. This is indicated by several sectors experiencing an increase in stock prices and better financial performance, especially in the financial sector. Improved performance in the financial sector affects performance in other sectors; 4). Based on the results of data modeling of closing stock prices of publicly listed companies owned by SOEs; 5). ARIMA modeling is used in three companies, namely PT. Perusahaan Gas Negara (Persero) Tbk, PT. Bank Rakyat Indonesia, Tbk, and PT. Bank Mandiri, Tbk because the closing prices of shares in the three companies are already stationary in terms of their average and variance; 6). The ARCH/GARCH modeling was used in 16 other companies because the closing stock price data contains a high volatility dependence, meaning that the variance in the data continues to increase over time and will form a trend pattern which indicates the variance of the data is not homogeneous. Therefore, ARCH/GARCH modeling is used to overcome the problem of heteroscedasticity.
Based on the conclusions of the study, it can be put forward some suggestions in this study. First, the stock price return time series data changes every time, every certain time period it is possible to produce different models, so further studies are needed to apply other ARCH/GARCH models. Second, other suggestions that can be given for further research are to study further about the best model that can be used on stock data that contains high volatility and forecast stock data so that it can be a useful reference for investors.
References
Darrat, A.F., & Zhong, M. (2002). Permanent and transitory driving forces in the Asian-Pacific stock markets. Financial Review, 37(1), 35-51.
Indexed at, Google Scholar, Cross Ref
Enders, W. (2008). Applied econometric time series. John Wiley & Sons.
Engle, R. (2001). ARCH/GARCH Models in Applied. The Journal of Economic Perspectives, 15(4), 157-168.
Hayo, B., & Kutan, A.M. (2005). The impact of news, oil prices, and global market developments on Russian financial markets. Economics of Transition, 13(2), 373-393.
Indexed at, Google Scholar, Cross Ref
Houston, B., & Brigham, E.F. (2010). Dasar-dasar manajemen keuangan. Jakarta: Salemba Empat.
Karim, B.A., Majid, M.S.A., & Karim, S.A.A. (2009). Integration of stock markets between Indonesia and its major trading partners. Gadjah Mada International Journal of Business, 11(2), 229-252.
Kilian, L., & Park, C. (2009). The impact of oil price shocks on the US stock market. International Economic Review, 50(4), 1267-1287.
Indexed at, Google Scholar, Cross Ref
Smith, G. (2001). The price of gold and stock price indices for the United States. The World Gold Council, 8(1), 1-16.
Sunariyah. (2006). Pengantar Pengetahuan Pasar Modal,5th ed. Yogyakarta: UPP STIM YKPN.
Twite, G. (2002). Gold prices, exchange rates, gold stocks and the gold premium. Australian Journal of Management, 27(2), 123-140.
Indexed at, Google Scholar, Cross Ref
Wong, W.K., Penm, J., Terrell, R.D., & Lim, K.Y.C. (2004). The relationship between stock markets of major developed countries and Asian emerging markets. Advances in Decision Sciences, 8(4), 201-218.
Yang, J., Kolari, J.W., & Min, I. (2003). Stock market integration and financial crises: the case of Asia. Applied Financial Economics, 13(7), 477-486.
Received: 20-Sep-2022, Manuscript No. AEJ-22-9320; Editor assigned: 21-Sep-2022, PreQC No. AEJ-22-9320(PQ); Reviewed: 13-Oct-2022, QC No. AEJ-22-9320; Revised: 20-Oct-2022, Manuscript No. AEJ-22-9320(R); Published: 23-Oct-2022