Research Article: 2021 Vol: 24 Issue: 1S
Predicting Trend of Stock Market Index Using Sliding Window Based On Long Short Term Memory Deep Network
P.V.Chandrika, VIT Business School, Vellore Institute of Technology
K. Sakthi Srinivasan, Vellore Institute of Technology
Abstract
Stock markets are found to be non-volatile in nature. To understand the volatility in the markets one requires certain techniques to be adopted. With the emergence of Artificial Intelligence various techniques have been adopted to study the volatility in stock markets. Many researcher applied techniques of machine learning and artificial intelligence to predict the stock market prices. Knowing the direction of the stock market helps the investors to plan their investments and boost their returns. There is an enormous study done in the area of predicting the stock market prices of the companies by adopting these techniques. But the present study considers the market indices from developed and emerging markets which constitute NASDAQ Composite Index from United States, KOSPI Market Index from South Korea and tries to apply the deep learning neural network model of Recurrent Neural Network with Long Short Term Memory (RNN+LSTM). The selected indices are modelled on RNN+LSTM to predict the direction of the market index. Data considered for the study ranges from Jan 2012 to March 2021 capturing the variables Low Price, High Price, Open Price, Close Price and Volume on each day. One day before closing price of the index is fed as input and is processed onto Recurrent Neural Network with Long Short Term Memory to predict one day a head direction of the index. The performance of the LSTM model is evaluated based on the accuracy of prediction which is found to be 81% on NASDAQ and 81.9% on KOSPI market Index.
Keywords
Developed Markets, Emerging Markets, Machine Learning, Deep Learning, RNN and LSTM
Introduction
The Non-linear nature of the stock markets is found to be one of the most disinteresting factor to an individual who would wish to do the investment in financial markets. The earlier theories on financial markets stated that the markets behaviour cannot be predicted. Fama (1963) proposed Efficient Market Theory which stated that the stock markets are unpredictable. Later (Malkie, 1973) stated that stock markets deviate every day and hence it takes random walks. Again Keim, et al., (1986) applied econometric model of GARCH stating that the stock markets are time dependent and sequential. Later in the early 19th Century with the emergence of computers (MuCulloch & Pits, 1943) proposed Multi-Layer perceptron which has ability to learn through neurons. This paved the way for predicting the stock market prices by using various mathematical models. Hence there are three different methods by which the stock market prices can be predicted. First method of prediction is Fundamental analysis which comprises of industry analysis, company analysis and economic analysis. This technique considers internal and external factors that affect the stock market prices. Second method includes Technical Analysis where it identifies the different patterns in the stock market prices and tries to visualize using charts and graphs. This helps in understanding the movements of the stock markets. There are various technical indicators that are considered to visually represent the stock markets. Third method is Technological analysis which further can be further divided into three sub-sections of Machine Learning, Deep Learning and Predictive Models. The present study aims at predicting the one day ahead direction of the two stock market indices by using Deep Learning Techniques. The two market indices considered for the study are selected from developed and emerging markets. NASDAQ Composite Index which covers the three major stock indices of US is chosen under the developed markets. Korean Composite Stock price Index (KOSPI) which is common index for all the stocks in South Korea is considered under Emerging Markets. The intra-day data of the selected stock indices are considered for building the Recurrent Neural Network Long Short Term Memory model by considering the 9.3 years which ranges from 01 January 2012 to 31 March 2021. The intra-day data collected for the study captures the Low Price, High Price, Open Price and Close price of the selected Stock indices.
This study attempts to predict the direction of stock indices using RNN+LSTM deep network. Through the experimental results it is found that the accuracy at which RNN+LSTM deep network predicting the one day ahead of the stock direction remains the same and is found to be accurate for short term prediction.
The rest of the paper is organized as follows. Literature Survey is described in Section 2, objectives of the study and limitations are presented in Section 3. Data description and pre-processing methods and modelling are discussed in Section 4, a brief on RNN+LSTM is also detailed. In Section 5 results of the models used are summarized and in section 6 presents the concluding remarks.
Literature Survey
This Section deals with the past research carried in the area of predicting the stock market prices by applying deep learning techniques.
Zhao & Zeng, et al., (2021), in their research has adopted the techniques of RNN-M, LSTM-M and GRU-M to predict the attention mechanism to predict the stock markets. The results showed that the GRU-M and LSTM-M are found to be significantly better than RNN-M. And it is also found that the Deep Neural Networks doesn’t yield the best results.
Moghar & Hamiche (2020) has applied RNN+LSTM network on New York Stock Exchange and NKE to predict the future stock values. And it is found that the RNN were showing minimum loss in prediction.
Jain, et al., (2018) has applied CNN+LSTM to predict the short term prices of Tata Consultancy Services (TCS) and Madras Rubber Factory Limited (MRF) stocks. The Experimental results show that the model with Convolution Neural Network and Long Short Term Memory (LSTM) is found to be more efficient.
Qiyuan (2016) applied RNN+LSTM network on hourly stock market data of six US company stock prices to predict the next day closing price of the stocks. The Highest accuracy of predicting the stock prices upto 59.5% and lowest accuracy is found to be 49.75%.
Jayanath & TGI Fernando (2017) has applied Recurrent Neural Network for predicting the stock prices of listed companies in Columbo Stock Exchange. The Model is compared with other two models of Feed Forward Network and GRU networks. The results show that Recurrent Neural Network with Long Short Term Memory has shown the high accuracy of 99%.
Qiu, et al., (2014) has applied Neural Network with back propagation show an improved accuracy, but it is much effective in a hybrid model embedded with Genetic Algorithm. GA-ANN outperforms compared to ANN in predicting the movement of Nikkei 225 index for monthly observation (Qiu, 2014).
Kumar & Sharma (2016) finds a high accuracy of 99 per cent using ANN in Nifty 50. Alotaibi, et al., (2018) finds ANN with back propagation capable of predicting Saudi Stock market and Oil prices.
Korczak (2017) developed a hybrid model of Artificial Neural Network with Principle Component Analysis which is called as Agent trader (A-trader) System to forecast the prices of Talit and NASDAQ stock index. Naeini (2010) used MLP and Elman Recurrent Network and finds MLP underperforming.
In one study, Ticardo & Murillo (2016) used DNN to get prediction accuracy of 65 percent, a similar less error metrics is observed when Convolution Neural Network used along with LR and SVM (Dingle & Fournier, 2017) and turns out to be more superior in high accuracy.
Back propagation in a hybrid setup with random optimized method is a good forecast for Japanese stock market (Baba & Kozaki, 1992).
Objective
Based on the past study, it is seen that the various neural networks are been modelled on the various stock prices of the companies but there is no research paper which has applied the RNN+LSTM deep network on Developed and Emerging Market index.
• To find the one day ahead direction of the selected stock index.
• To evaluate the accuracy of RNN+LSTM in predicting the stock market direction.
Methods
To predict the direction of stock indices, the study propose a data driven sequence. The data set includes, opening/closing value, trade volume of two selected stock market indices, NASDAQ and KOSPI. Technical indicators reflecting the price movements is another input variable.
Pre-processing and scaling of the variables is done before modelling the data on RNN+LSTM deep network. The selected stock indices are modelled on with requisite 4 hidden layers and activation function of ‘adam’ which takes care of noisy data. The performance of the RNN+LSTM is evaluated on both the selected stock market indices.
Recurrent Neural Network with Long Short Term Memory
Recurrent Neural Network is a deep learning algorithm that has the capability of handling the sequential and noisy data. In RNN+LSTM each hidden layer is trained on certain neurons by using activation functions. The RNN+LSTM model of divided into three layers 1. Input 2. Hidden and 3. Output. And Constitutes three gates 1. Input gate 2. Forget Gate and 3. Output Gate. The RNN+LSTM is applied on sequential data where a sliding window is generated. The input fed to the RNN+LSTM takes is
Ht=f(ht-1, Xt)
Where Ht=State at current state ‘t’
ht-1= State at which takes closing price of previous day
Xt=Current State.
In RNN each state depends on all previous computations. At the first stage the previous day closing price of the index is fed into the network and the processed through the neurons. The processed neurons generate the weights, and the highest weights are fed to the next layer which is hidden layer. The processed data will again be processed on hidden layers with defined neurons along with generated weights. The processed data with highest weights is been taken to last layer which contains the activation layer to optimize the weights and classify the input variables. Throughout the process of RNN+LSTM model the mathematical model that is constructed takes the following form:
Y=Ht-1U + XtW.
Where Ht-1 is the previous day closing price of the index, U is the weights generated at the initial stage of the network. Xt is the processed data on the next layer of RNN+LSTM network which generated weights W.
The network has the capacity to store the weights from the initial layer to output layer. Once the highest weight nodes are been taken to the next layer the lowest weights are again processed on each layer of the network hence all the inputs are processed throughout the network.
While modelling the data on the neural networks, it is found that all the neural network models has the problem of vanishing and exploding gradient. Inorder to avoid this problem Neural Networks are tunned with activation functions. These are the functions which are been used at the last layer of RNN+LSTM to activate a neuron. These activation functions verify the processed data and tries to classify the information received by the neuron. There are multiple activation functions that can be used based on the type of the output. The general and basic activation function used in the network model is the weighted average. Which can be mathematically represented as α(x)= Σwixi which is weighted average.
Y=Activation (∑ (Weight * Input) + bias)
The Present RNN+LSTM model has been trained by using sigmoid activation function since it is predicting the direction of the stock index and involves the classification of the output. Sigmoid Function is calculated as
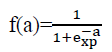
This function is used when output is bounded between 0 & 1 and it is interpreted as the probability of neuron to activate. It is commonly called logistic function.
The following represents the RNN Architecture:

Figure 1: Recurrent Neural Network Model
The RNN+LSTM architecture constitutes three different processing gateways. The first gateway takes the input which is previous day closing price of the index and processes the input by generating weight as discussed above and later moves to second gateway Long Short Term Memory (LSTM) takes the cell state at a time to predict the value. Usually the cell state can be altered by specific gates. LSTM gate use Logistic Sigmoid Function as the activation function in the last gateway and classifies towards if it is taking 1 and classifies as 0 if the market closing price is towards 0. The three gateways used in the network are explained as follows:
Forget Gateway: At the forget gateway, previous day’s closing price is given as the input. The input is processed by generating the weights at each neuron, squashes with logistic function or the element wise multiplication with the cell and leaves an output with all relevant information through which it eliminates the unwanted information.
Input Gateway: The processed data in the Forget Gateway is added to the input gateway to extract the new information. The input is taken from the previous gateway and the current input is transformed using sigmoid function.
Output Gateway: This is the gateway that extracts the output and initiates the classification of the input data by transforming the cell memory.
Performance Metrics:
This section describe the different error metrics used to get the accuracy. The accuracy metrics considered for the study include:
Mean Squared Error (MSE):
Mean Squared Error is the average of Squared error calculated on test dataset. MSE is given by
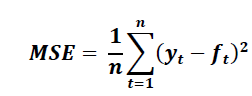
Lower MSE implies the prediction model is better.
Results and Discussion
This section deals with analysis and interpretation of deep learning models of Recurrent Neural Network with Long Short Term Memory on the selected stock indices. (Table 1)
| Table 1 Recurrent Neural Network With Long Short Term Memory Model Parameters |
||||||
|---|---|---|---|---|---|---|
| Stock Index | Train Data | Test Data | LSTM Layers | No of Epochs | Trainable Parameters | Activation Functions |
| NASDAQ | 1860 | 515 | (3, 96) | 100 | 1,85,953 | Sigmoid |
| KOSPI | 1764 | 454 | (3, 96) | 100 | 1,85,953 | Sigmoid |
From the above Table the 1860 and 1764 (80% of total observations) data points are considered for the training the RNN+LSTM model and the same model is tested on 515 (20% of total observations) with 3 hidden layers with 96 neurons. Totally 1,85,953 parameters are trained across the layers with Sigmoid activation function. Activation Function of ‘Adam’ takes care of overfitting of the network model. Once the model is trained on the RNN+LSTM network with requisite parameters the performance metrics are considered to evaluate the model. (Table 2)
| Table 2 Performance of Rnn+Lstm on Selected Stocks |
|||||
|---|---|---|---|---|---|
| Stock Index | Loss Function | Accuracy | Precision | Recall | F1-Score |
| NASDAQ | 0.0135 | 0.81 | 0.82 | 0.79 | 0.81 |
| KOSPI | 0.0019 | 0.82 | 0.83 | 0.8 | 0.819 |
From the above table it is clear that the loss function which is mean squared error is found to be 0.00135 and 0.0019. The Accuracy at which RNN+LSTM is able to predict the direction of the stock index is found to be 81% on NASDAQ Stock index and 82% on KOSPI Market Index. It is also evident from the above table that the Precision values are 0.82 and 0.83 on selected market indices, stating that the probability at which the selected market indices take upward direction is 82% on NASDAQ and 83% on KOSPI market index, provided if the network model also predicts that stock market is taking an upward direction. Similarly the Recall values of the stock indices is found to be 0.79 and 0.80 which states that there is 79% and 80% probability of network model predicting that the selected stock index takes upward direction provided the market is also moving in upward direction on a day before.
F1 Score captures the average of Precision and Recall. It is found that the average probability at which the NASDAQ market index takes the upward trend and the network model also predicting the same upward trend is found to be 81% and the average probability at which KOSPI index predicting the upward trend in the market and the network model predicting the same is found to be 81.9%. Figure 1

Figure 2: Showing The Performance Metrics of Rnn+Lstm Network
From Figure (a), it is clear that the classification metrics of RNN+LSTM network is the same with respect to True Positives and True Negatives. Figure (b) represents the accuracy of the proposed model and is clear that the accuracy of prediction for both the selected stocks is found to be 81% and 82%.
Conclusion and Future Scope of Work
In this paper, a comprehensive one day ahead index closing value forecast process is presented. The process starts with data cleaning and pre-processing followed by analysis of the model and prediction metrics. It is found that the average probability with which the proposed network model predicts the trend and the actual market trend is found to be 81% on NASDAQ and 81.9% on KOSPI index which is fairly good probability to consider.
The experiment clearly reveals that RNN+LSTM is able to predict the movement for the next day. As this study is confined to short term forecasting, it is observed that RNN+LSTM proves its strength in performance. For future work, the same model can be used on a more high frequency data and by adopting the other Machine Learning Techniques like hybrid models by integrating two neural network models.
References
- Zhao, J., Zeng, D., & Liang, S. (2021). Prediction model for stock price trend based on recurrent neural network. Journal of Ambient Intelligence and Humanized Computing, 12, 745–753. https://doi.org/10.1007/s12652-020-02057-0
- Moghar, A., & Hamiche, M. (2020). Stock market prediction using LSTM recurrent neural network. Procedia Computer Science, 170, 1168-1173, ISSN 1877-0509, https://doi.org/10.1016/j.procs.2020.03.049.
- Jain, S., Gupta, R., & Asmita, A., (2018). Stock price prediction on daily stock data using deep neural networks. International Journal of Neural Networks and Advanced Applications, 5, 2018, 45 - 54, ISSN 2313-0563.
- Qiyuan. (2016). Stock market forecasting using recurrent neural network, award of MS degree department of computer engineering.
- Jayanath, S., & Fernando, T.G.I.PY. (n.d). AU - - 2017/12/15A Recurrent neural network approach in predicting daily stock prices: An application to the Sri Lankan Stock MarketDO - 10.1109/ICIINFS.2017.8300345
- Duke. (2017). “Stationary & Differencing”. http://people/duke.ew/~rnau/411diff.htm (Accessed January 2017).
- Ayodele, A., Aderemi, A., & Charles, A. (2014). Stock price prediction using the ARIMA model. Proceedings - UKSim-AMSS 16th International Conference on Computer Modelling and Simulation, UKSim. 10.1109/UKSim.2014.67.
- Ali, M., Adebiyi, M., Ariyo, A., Oluyinka, A., & Korede, A.C. (2014). Comparison of ARIMA and artificial neural networks models for stock price prediction. Journal of Applied Mathematics, Hindawi Publishing Corporation, 10.1155/2014/614342.
- Babu, C.N., & Reddy, B.E. (2014). Selected Indian stock predictions using a hybrid ARIMA-GARCH model. 2014 International Conference on Advances in Electronics Computers and Communications, 1-6.
- Banerjee, D. (2014). Forecasting of Indian stock market using time-series ARIMA model 2014. 2nd International Conference on Business and Information Management (ICBIM), Durgapur, 131-135, doi: 10.1109/ICBIM.2014.6970973.
- Steel, A. (2014). Prediction in financial time series data, master of science in computing, institute of technology, Blanchardstown.
- Patel, J., Shah, S., Thakkar, P., & Kotecha, K. (2015). Predicting stock and stock price index movement using trend deterministic data preparation and machine learning techniques, Journal of Expert systems with Applications, 42, 259-268.
- Hore, S., Vipani, R., Das, P., & Dutta, S. (2018). Prediction of stock value using NIFTY 50 market index and RBF – Kernel based Support Vector Regressor. International Journal of Advanced Research in Science and Engineering, 7(3), ISSN: 2319-8324.
- Swell, M.V. (2017). Application of machine learning to financial time series analysis. Doctorate of Philosophy, University College of London, University of London.
- Dingli, A., & Fourier, K.S. (2017). Financial time series forecasting – A machine learning approach. Machine Learning and Applications: An International Journal, 4, 1/2/3.
- Mingyne, Q. (2014). A study on prediction of stock market index and portfolio selection. Doctorate of Engineering, Fukuoka Institute of Technology, Fukuoka university, Japan.
- Estrada, G.B. (2015). Thesis deep learning for multivariate financial time series. Master of Science, KTH Institute of Technology, Stockholm.
- Krollner, B., Vanstone, B., & Finnie, G. (2020). Financial time series forecasting with machine learning techniques: A Survey. European Symposium of ANN – Computational Intelligence and Machine Learning, Bruges, 28-30. ISBN – 2-930307-10.2.
- Majumder, M.M.D., & Hussain, A. (2017). Forecasting of Indian stock market index using Artificial Neural Network (ANN). Research at National Stock Exchange India Ltd.
- Kumar, G., & Sharma, V. (2016). Stock market forecasting of nifty 50 using machine learning techniques with artificial neural network approach. International Journal of Modern Computer Science (IJMCS), 4(3), ISSN: 2370-7868.
- Alotaibi, T., Nazir, A., Alroobaea, R., Abtibi, M., Alsubeai, F., Alghamde, A., & Alsulimani, T. (2018). Saudi Arabia stock market prediction using neural network. International Journal on Computer Science and Engineering, 0975-3397.
- Grigoryan, H. (2015). Stock market prediction using ANN Case study of Talit, Nasdaq OMX, Baltic Stock”. Database Systems Journal, 6, 2/2015.
- Naeini, M.P., & Hamidreza, T., & Homa, B. (2010). Stock market value prediction using neural networks, 132 – 136. 10.1109/CISIM.2010.5643675.
- Qui, M., & Song, Y. (2016). Predicting the direction of stock market index movement using an optimized ANN. Pone Journal.
- Panda, C., & Narasimhan, V. (2006). Predicting stock returns – An experiment of the ANN in Indian Stock Market. South Asia Economic Journal, 7(2), 205-218.
- Ticardo, A., & Murillo, A. (2016). Thesis short term forecasting of financial time series with deep neural network. Masters in Systems and Computer Engineering Universidad National de Colombia.
- Dingle, A., & Fournier, K.S. (2017). Financial time series forecasting – A deep learning approach. International Journal of Machine Learning and Computing, 7.
- Korczak, J., & Hernes, M. (2017). Deep learning for financial time series forecasting in a-trader system. Proceedings of the Federated conference on computer science and Information systems, ACSIS, 11, 905-912.
- Tang, Y. (2013). Deep learning using linear support vector machine, master of science, department of computer science, University of Toronto, Toronto, Ontario, Canada.
- Hiransha, M., Krishnan, G.E.A, Menon, V.K., & Soman, K.P. (2018). NSE stock market prediction using deep learning models. International Conference on Computational Intelligence and Data Science, 1351-1362.
- Gao, Q. (2016). Thesis titled, stock market forecasting using RNN, Master of Science, University of Missouri – Colombia.
- Baba, N., & Kozaki, M. (1992). An intelligent forecasting system of stock price using neural networks. (Proceedings 1992) IJCNN International Joint Conference on Neural Networks, Baltimore, MD, USA, 371-377, 1, doi: 10.1109/IJCNN.1992.287183.
- Acunto, G.D. (2016). Dissertation, a deep learning model to forecast financial time series. Master of Science, Universita deglistudi DI Torino. ML-Support Vector Machine (online): Available: www.tutorialspoint.com/machine_learning_with_python/machine_learning_with_python_classification_algorithms_support_vector_machine.htm (Accessed July 2020).
- Mitchell, T.M. (2017). “Machine Learning”. McGrawHill Education.
- Kumar, D.U. (n.d.). “Business analytics the science of data-driven decision making”. Wiley.
- Zhou, X., Pan, Z., Tang, G.S., & Zhao, C. (2018). Stock market prediction on high frequency data using generative adversial nets. Hindawi, Mathematical Problems in Engineering, ID 4907423.
- Sezera, O.M., Gudeleka, M.U., & Ozbayoglu, A.M. (2019). Financial time series forecasting with deep learning: A Systematic Literature Review: 2005-2019”. (https://arxiv.org/pdf/1911.13288.pdf)