Research Article: 2021 Vol: 25 Issue: 2S
Reducing Agency Issues: Examining Earnings Management Constraints in Emerging Markets
Wil Martens, RMIT University, Hanoi
Phuong T.M. Pham, FPT University
Keywords
Investor Protection, Earnings Management, Emerging Markets, Institutional Settings.
Abstract
We examine whether selected institutional setting variables and societal trust can curtail Earnings Management (EM) practices in emerging economies. Results reveal that minority investor rights, legal enforcement, disclosure requirements, and a greater number of analysts following are inversely correlated with EM activity. These findings align with findings from developed market studies. In contrast to developed market studies and original to this paper, higher levels of societal trust fail to show statically significance in curtailing EM. From this, we infer that findings on variables that reduce EM are not broadly applicable, supporting segmented market research on EM. Further, we infer that formal institutions enact greater EM constraint than informal institutions in emerging markets. Our findings help extend the literature by further identifying factors that reduce agency conflicts and influence EM.
Introduction
In recent decades, emerging economies have begun to shift from closed economies toward open, heterogeneous market- driven economies (Hong, 2020). Emerging market firms are increasingly competing in global markets, facing foreign multinational corporations. Although the banking system dominates as a key supplier of credit, the stock market is increasingly becoming an effective outlet where businesses can access capital (Vo, 2017) and broaden their owner- ship structure. The efficiency of capital allocation in equity markets depends on financial disclosure and information availability (Zhong & Gao, 2017). Regulators, in addition to working to ensure that capital asset prices fully reflect information affecting their value (Pettit, 1972), aim to ensure capital markets allocation efficiency by minimizing privileged market access and that gains from private information is penalised (Patel et al., 2002). Allocation effectiveness will vary for different markets, particularly those without efficient information systems (Wu et al., 2021). To better compete for capital, to make financial reports more informative, or signal firm performance to outsiders, man- agers might manipulate earnings (Cudia & Dela Cruz, 2018). Earnings Management (EM) may also be undertaken to fulfill positive earnings thresholds and analysts’ forecasts (Lin et al., 2020), but becomes fraudulent when it falls outside the bounds of acceptable accounting practice (Rahman et al., 2013). The degree to which firms manipulate earnings is higher in emerging markets than in developed markets as managers are less constrained by corporate governance (Lin & Wu, 2014). Thus, the extent to which managers alter reported earnings is a major concern for the accounting profession (Mostafa, 2017), as the firm’s stakeholders as earnings management obscures real performance, and reduces the ability make informed decisions. The management of earnings creates a separation of interests between stakeholders and management and has possible agency costs – EM being an agency cost (Xie et al., 2003). As proper corporate governance is a tool for reducing agency problems (El-habashy, 2019), with this study, we aim to examine the ability of institutional settings and societal trust to curtail opportunistic EM and reduce agency issues. Research on EM is prevalent (Schipper (1989); Dechow et al., (1996); Degeorge et al., (1999); Dechow et al., (2012)) and has yielded empirical evidence suggesting that EM behaviour is curtailed by institutional settings (Leuz et al., 2003; La Porta et al., 2002; Enomoto et al., 2015). Although research in this area exists, empirical work focusing on a wide spectrum of emerging markets and institutional constraints is limited. Emerging-market countries have unique EM dynamics due to their early structural and cultural development, in addition to their undeveloped capital markets and high heterogeneity (Sheth, 2011; Shankar & Narang, 2019). Because of the unique characteristics of this market, significant variation exists in their institutional settings and culture. As these characteristics play an essential role in an organization’s operational performance, there is a strong incentive to expand research into this area.
This study makes theoretical and empirical contributions to the literature in the following dimensions. First, this study investigates whether institutional a setting curtails EM from which each shows a varying level of ability to curtail. This finding is consistent with findings from developed markets. Second, societal trust fails to show an ability to curtail EM. The variable’s failure to curtail EM suggests that country-level formal institutions perform better at curtailing management behaviour and that societal trust cannot substitute for formal institutions. To reduce the imbalance in the agency relationship between managers and stakeholders, we pursue further research in areas that curtail EM activity in this market. An understanding of this relationship is also essential to policy and firm development.
This paper is organized as follows. The recent literature on earnings management and institutional settings is outlined in 2. The study data is described in Section 3, followed by methodology. Section 4 presents the results of the estimations, and Section 5 provides concluding remarks and study implications.
Background and Hypothesis Development
Accruals Earnings Management
Practitioners often consider EM to be problematic, requiring immediate remedial action; academics conversely, disagree on the extent of EM and its impact on reported earnings (Dechow & Skinner, 2000). In outlining EM’s characteristics, Healy & Wahlen (1999) and (Roychowdhury, 2006) state that management’s use of financial judgment and structuring transactions to change financial reports with the intent to conceal a firm’s underlying economic performance or to influence contractual performance that depends on the reported financial practices, is the management of earnings. Managing earnings may be influenced by issues created by ownership and control separation (Jensen & Meckling, 1976, Shleifer & Vishny, 1997) – commonly considered an agency issue. In an agency relationship, one party acts on behalf of another (Shapiro, 2005). In publicly listed firms, agency issues may stem from the separation of ownership from management or from disagreements between controlling and non-controlling shareholders (Liu et al., 2021). Knowledge asymmetry among managers and shareholders leads to market imperfections of moral hazard and negative selection, which may impact capital market effectiveness (Berglo¨f & Claessens, 2006; Jensen & Meckling, 1976). The majority of studies in global capital markets posit that institutional investors have a knowledge advantage over private investors, and the imbalances may cause individuals to adopt irrational investment decisions (Barber & Odean, 2008; Brandt et al., 2010; Chung & Zhang, 2011; Nofsinger & Sias, 1999). Examples of the knowledge imbalance and the resultant issues may be managers who optimize personal financial interests over those of the firm or those involved selecting negative net present value projects for empire creation (Jensen, 1986).
The quality of income is an important predictor for firm performance as it provides additional information on a firm’s results (Li et al., 2014; Sloan, 1996; Demirer, 2013), and accruals contain greater uncertainty than cash flow as accruals stem from decisions on estimates and allocations during the implementation of cash flows (Francis et al., 2005). If information asymmetry is high, stakeholders will not have the appropriate information to react appropriately to the manipulated revenue. This study proposes that when information asymmetry is minimized, earnings quality improves and EM curtailed. We, therefore, posit that stronger institutional settings will be a catalyst in reducing EM.
Institutional Setting Variables
Leuz, et al. (2003), La Porta, et al. (2002), An, et al. (2016), & Martens, et al. (2020) propose that good administrative environment can reduce agency issues by reducing the opportunistic behaviour of managers. They claim that strong in- situational environments, including strong investor security and compliance restrict managers’ ability to achieve private control benefits, thus decreasing the possibility of EM activities. Accordingly, we assert that good institutional environments minimize agency disputes by granting investors rights to avoid expropriation of their investment by man- agers and by ensuring that investor rights can be applied when appropriate. In markets where institutional settings are weaker, we expect the benefit of institutional settings to be less pronounced.
Minority (outside) investor rights is our first institutional setting variable examined. Agency theory suggests monitoring by ownership can be a good governance component (Kazemian & Sanusi, 2015). Investor rights is a key concern for investors in emerging markets as unchecked controlling shareholders’ power can lead to the expropriation of minority investor rights (Atwi et al., 2017; El-Helaly et al., 2018). As minority investor rights is related to firm governance, higher quality financial reporting is associated with a lower likelihood of qualified audit reports (Pucheta-Mart´?nez & Garc´?a-Meca, 2014) and reduces the potential for EM (Alzoubi, 2018). Legal enforcement, our second institutional setting variable examined, is often associated with the efficacy of a country’s judicial system and the enforcement of laws (Ippoliti et al., 2015). Agency theory assets that the natural selection process favors law governing corporate behaviour (Fama & Jensen, 1983; Hill & Jones, 1992). Managers’ misstating earnings are likely to encounter legal troubles (Kim et al., 2017).
Emerging markets may not sufficiently protect shareholders’ interests due to their weak legal and enforcement environment around shareholders’ interests (Ma et al., 2009; Ahmed et al., 2018). In countries with weaker legal enforcement, legal risks increase, and governance’s focus shifts to deterring defaults (Esty & Megginson, 2003). Burgstahler & Eames (2006) found strong enforcement in certain European countries does not diminish all EM, yet is a decreasing factor in AEM (Leuz et al., 2003; Oyebamiji, 2020). Corporate disclosure, our third institutional setting variable, pertains to information asymmetry between investors and managers (Lobo & Zhou, 2001); higher disclosure quality is negatively associated with EM. With greater disclosure, the public is less likely to doubt a company’s sustainability and attract greater investor interest (Herdjiono & Sari, 2017). Lobo & Zhou (2001) hypothesised that it was more challenging to implement EM in countries with stricter disclosure regulations.
Poor disclosure and financial opacity are common among companies in emerging markets (Fan et al., 2011). While transparency and disclosure in selective emerging markets have increased over time (Patel et al., 2002), voluntary disclosure and EM are not simultaneously determined or associated (Consoni et al., 2017). There may be competing elements that justify tighter managerial control over information, as management may want to disclose or retain information that serves their interests (Denlsetz & Lehn, 1985). The number of analysts following is our fourth variable. Financial analysts are professionals that analyze investment opportunities by providing insight to and monitoring of firm performance. The analysts’ estimates on companies’ profits and earnings per share are often given much weight and their forecasts may be considered more reliable than those of management (Embong & Hosseini, 2018). Firms that fail to perform as analysts predict often experience stock price declines (Bozanic et al., 2019; Yu, 2008). Chan, et al., (2014) find a negative correlation between analysts following and EM, indicating increased analysts following reduces EM. Financial analysts may also play a role in expanding EM because the pressure to meet or beat analysts’ forecasts may drive managers to manipulate earnings (Hong et al., 2014; Coen & Desfleurs, 2016).
Based on the evidence of institutional settings in the literature, the following hypotheses are stated:
H1 Earnings management is curtailed by greater minority investor rights.
H2 Earnings management is curtailed by greater legal enforcement.
H3 Earnings management is curtailed by greater disclosure requirements.
H4 Earnings management is curtailed by greater number of analyst following
Culture Effect: Societal Trust
Organizational cultures, principles, and value structures within organizations are nominative studies for practitioners and academics for several decades (Dechow & Skinner, 2000). Survey and interview data connects organizational culture to firm value (Graham et al., 2017) as culture affects those who rise to leadership across organizational ranks (Schein, 2010). Many companies formally codify culture into statements or value suggestions, and clarify that codification is not the key driver of corporate culture (McShane & Von Glinow, 2010). Studies show that culture shapes individual values and influences behaviour (Hofstede, 1980; Chui et al., 2002; Doupnik & Tsakumis, 2004; Kwok & Tadesse, 2006; Zhang, 2018). In emerging markets where financial statement consistency is dubious (Alfraih, 2016), trust serves to informally link information in an unbiased manner.
Countries possessing relatively high trust levels tend to possess relatively low levels of corruption (Lin & Wu, 2014). Guan, et al. (2020) find a stronger association between firm-level commitment to reliable disclosure and earnings estimates in low-trust countries, indicating that country-level societal trust is linked to the effectiveness of firm-level credibility. Investors in high-trust countries perceive these voluntary disclosures as more trustworthy. Insufficient societal trust can exacerbate moral hazards due to low social costs (Ho et al., 2020), that cultural differences cannot be overlooked when examining investor protection across countries (Stulz & Williamson, 2003). Bao & Bao (2004) suggest that culture may contribute to the variation in earnings smoothing across countries. Motivated by literature, this study investigates how societal trust shapes how management prepares and reports financial information. Based on the evidence of culture’s effect on earnings management, the following hypothesis is stated:
Descriptive Statistics
Study population
| Table 1 Observations by Year, Country, and Industry |
|||||||||
|---|---|---|---|---|---|---|---|---|---|
| Observations by Year | Observations by Country | Observations by Industry | |||||||
| Year | n | % | Country | n | Observations | % | Industry | Observations | % |
| 2000 | 332 | 1.07 | Argentina | 85 | 1,348 | 4.35 | Chemical Products | 3,176 | 10.26 |
| 2001 | 570 | 1.84 | Bahrain | 30 | 459 | 1.48 | Communications | 1,773 | 5.73 |
| 2002 | 759 | 2.45 | Bangladesh | 96 | 704 | 2.27 | Durable goods | 1,237 | 3.99 |
| 2003 | 1,116 | 3.6 | Bulgaria | 255 | 3,116 | 10.06 | Electric, gas and sanitary services | 385 | 1.25 |
| 2004 | 1,421 | 4.59 | Croatia | 90 | 1,185 | 3.83 | Electronic Equipment | 468 | 1.51 |
| 2005 | 1,605 | 5.18 | Estonia | 15 | 214 | 0.69 | Entertainment Services | 605 | 1.95 |
| 2006 | 1,739 | 5.62 | Jordan | 177 | 2,305 | 7.44 | Food Products | 6,236 | 20 |
| 2007 | 1,847 | 5.96 | Kazakhstan | 57 | 566 | 1.83 | Health | 942 | 3.04 |
| 2008 | 1,941 | 6.27 | Kenya | 41 | 630 | 2.03 | Manufacturing | 8,551 | 27.61 |
| 2009 | 2,017 | 6.51 | Kuwait | 165 | 2,299 | 7.42 | Oil & Gas | 2,237 | 7.22 |
| 2010 | 2,084 | 6.73 | Lebanon | 6 | 94 | 0.3 | Paper and paper products | 3,359 | 10.85 |
| 2011 | 2,166 | 6.99 | Lithuania | 19 | 247 | 0.8 | Retail | 302 | 0.98 |
| 2012 | 2,274 | 7.34 | Mauritius | 73 | 728 | 2.35 | Scientific instruments | 739 | 2.39 |
| 2013 | 2,339 | 7.55 | Morocco | 67 | 961 | 3.1 | Transportation | 959 | 3.1 |
| 2014 | 2,367 | 7.64 | Nigeria | 147 | 1,481 | 4.78 | |||
| 2015 | 2,362 | 7.63 | Oman | 108 | 1,634 | 5.28 | |||
| 2016 | 2,377 | 7.68 | Pakistan | 221 | 2,910 | 9.4 | |||
| 2017 | 1,653 | 5.34 | Romania | 148 | 1,803 | 5.82 | |||
| Slovenia | 38 | 501 | 1.62 | ||||||
| Sri Lanka | 258 | 3,462 | 11.18 | ||||||
| Tunisia | 68 | 792 | 2.56 | ||||||
| Vietnam | 345 | 3,530 | 11.4 | ||||||
| Total | 30,969 | 100 | Total | 2,509 | 30,969 | 100 | 30,969 | 100 | |
This study’s sample includes all publicly listed and delisted (to avoid survivorship bias) firms taken from Data stream for the years 2000-2017 in 22 emerging markets. Following prior studies, this study’s sample excludes all financial and insurance firms as their financial reporting standards differ. After completing all firm collections and removals, the total sample set includes 2,509 firms and 30, 969 firm-year observations. Data is skewed toward more recent observations as firm generally increase each year, save for 2017. Vietnam has the most numerous observations; Lebanon has the least; for industries, food products were the most numerous, whereas retail has the least. Table 1 provides an itemized review of the study population by year, country, and industry.
Accrual Earnings Management Detection Methods
The dependent variable of interest in our study is Accrual-Based Earnings Management (AEM). To analyze the effects of institutional settings and societal trust on the EM, we apply three methods AEM proxies to add robustness. These methods include Leuz, et al. (2003), Yoon, et al. (2006) & Kothari, et al. (2005), and will be known as Model A, B, and C, respectively. An outline of each detection proxy follows.
Model A
Our first EM proxy follows Leuz, et al. (2003)’s AEM detection method and comprise of three separate measures (AEM1, AEM2, and AEM3) and is outlined in Table 7, Combined, three measures combined form a single composite measure of an average of a firm’s scaled rank score per country per year by N, as per Lemma, et al. (2019).1 The composite score is denoted as Model A.
AEM1 is calculated as the standard deviation of operating income divvied by the standard deviation of operating cash flow, and used to account for the fact that a manager may counteract variation in operating cash flow with accruals (Leuz et al., 2003). A higher AEM1 value suggests a lower degree of EM. AEM2 is calculated as the correlation of changes in accruals and changes in operating cash flow. A higher AEM2 values suggest a greater amount of income smoothing. AEM3 is calculated by dividing the absolute values of accruals by the absolute value of operating cash flow. A higher AEM3 value suggests a greater degree of income control (Lemma et al., 2019).
Model B
Our second detection model follows Yoon, et al. (2006) and is denoted as Model B. This model has shown an out- performance over other residual dependent models in emerging markets (Yoon et al., 2006; Islam et al., 2011; Alareeni & Aljuaidi, 2014). Modelled after Sloan (1996) & Lee & Lee (2015), this study ranks accruals per country and year.
Model C
The third AEM detection method follows Kothari, et al. (2005)’s performance-matched approach. It is denoted Model C. This method is both well-specified and powerful at estimating discretionary accruals as it considers a company’s past and present economic performance (Caiet al., 2020). This study follows previous researchers and ranks accruals per country and year.
Regression Models
To test the hypotheses, the following research model has been constructed and takes into consideration the four in- situational settings variables as well as our cultural variable shown via Equations 3.1-3.4. This model is common framework of discretionary accruals and influenced by McNichols (2002). We use both single regression variables to examine AEM relationship to the study’s variables and a multiple regression model inclusive of all study variables and are shown via Equation 3.6.
ModelA,B,C=α0+α1(AnalystFollowing)+ε (Eq. 1)
ModelA,B,C=α0+α1(DisclosureIndex)+ε (Eq. 2)
ModelA,B,C=α0+α1(LegalEnforcement)+ε (Eq. 3)
ModelA,B,C=α0+α1(MinorityInvestorRights)+ε (Eq. 4)
ModelA,B,C=α0+α1(SocietalTrust)+ε (Eq. 5)
ModelA,B,C=α0+α1(AnalystFollowing)+α2(DisclosureIndex)+α 3 (LegalEnforcement)+ α4(Minority Investor Rights)+ α5(Societal Trust)+ε (Eq. 6)
Empirical Results
Descriptive Statistics
Table 2 presents the summary statistics of key variables. Mean scores for Model A, Model B, and Model C, variables are fairly similar, yet their standard deviation exhibits greater dispersion at 0.17671, 0.2890 and 0.2891, respectively. Mean scores for the four investor protection variables of Analysts Following, Disclosure Index, Legal Enforcement, and Minority Investor Rights are 5.17, 6.45, 4.69, and 5.70, respectively.
The four anterior variable’s stability (as noted by their low standard deviation compared to the mean) is a common property in survey-based data (Callen et al., 2011). The cultural variable of Societal Trust has a mean score of 3.4, with a standard deviation of 2.03.
| Table 2 Earnings Management Statistics of Key Variables | |||||||
|---|---|---|---|---|---|---|---|
| Variable | Mean | Std. Dev | Q1 | Median | Q3 | Min | Max |
| Model A | 0.5101 | 0.1671 | 0.3948 | 0.5086 | 0.625 | 0.023 | 1 |
| Model B | 0.51 | 0.289 | 0.26 | 0.5088 | 0.76 | 0.003 | 1 |
| Model C | 0.5101 | 0.2891 | 0.2602 | 0.5091 | 0.761 | 0.003 | 1 |
| Analyst | 5.1785 | 8.4176 | 1.3665 | 1.972 | 4.927 | 0.293 | 47.766 |
| Disclosure | 6.4587 | 2.0042 | 5 | 6 | 8 | 3 | 10 |
| Enforcement | 4.6966 | 0.9561 | 4.066 | 4.771 | 5.406 | 2.883 | 7.872 |
| Investors Rights | 5.7057 | 1.0496 | 4.7 | 5.8 | 6.7 | 3.7 | 7.5 |
| Trust | 3.4013 | 2.0364 | 2 | 3.9 | 4.8 | 0 | 8.1 |
Table 3 presents the correlation table of key metrics. Consistent with expectations, we find Disclosure Index, Legal environment, Analysts Following, and Minority Investor Rights negatively correlated with all AEM detection proxies. The level of Societal Trust shows a positive relationship with the AEM proxies. To further understand the relationship between the AEM proxies and the institutional settings variables, these variables are regressed in the following section.
Regression Results
We hypothesize that the effects of AEM are curtailed by investor protection variables and greater societal trust. Negative coefficients are expected when variables provide AEM constraint. Panels A. B, and C of Table 4 display Model A, B and C results, respectively, via Pooled OLS regression. Coefficient signs for the individual regressions tests are mostly analogous to the multiple regression test, thus, only the latter results are described.
| Table 3 Correlation between EM and Study Variables | ||||||||
|---|---|---|---|---|---|---|---|---|
| Variables | (1) | (2) | (3) | (4) | (5) | (6) | (7) | (8) |
| (1) Model A | 1 | |||||||
| (2) Model B | 0.485*** | 1 | ||||||
| (3) Model C | 0.476*** | 0.758*** | 1 | |||||
| (4) Analyst | -0.0198* | - 0.0339*** | - 0.0359*** | 1 | ||||
| (5) Disclosure |
-0.268*** | -0.251*** | -0.249*** | 0.0920*** | 1 | |||
| (6) Enforcement |
-0.160*** | -0.166*** | -0.168*** | 0.203*** | 0.0843*** | 1 | ||
| (7) Investor Rights | - 0.0483*** |
- 0.0832*** |
- 0.0863*** |
0.245*** | 0.310*** | - 0.0907*** |
1 | |
| (8) Trust | 0.160*** | 0.138*** | 0.137*** | 0.209*** | 0.137*** | -0.308*** | 0.390*** | 1 |
| Significance is denoted p = 0.05 level for *: p¡0.10, **: p¡0.05, ***: p¡0.01 | ||||||||
As predicted, the coefficients for Disclosure Index, Legal Enforcement, and Minority Investor Rights are negative and support the hypothesis that AEM is less prevalent when these variables increase. Analysts Following failed to show significance when tested collectively. This finding may be due to a reduction in the degrees of freedom resulting in an error term. As theory suggests, the number of analysts following should curtail EM, we continue to include this variable in further tests. Similar to the results from Table 3, the Societal Trust coefficient is positive and statistically significant, indicating it is not instrumental in constraining AEM activity. The statistical significance of the coefficients in the regression outputs with the AEM detection proxies points to the variables’ appropriateness for further analysis.
Results from additional tests
To cross-check initial findings, Equation 3.6 is reexamined using both quantile regression and Two-Stage Least Squares (2SLS). In the event of heterogeneity, then quantile regression will provide a more comprehensive view of the relationship between variables through the effects of independent variables across quantiles of the response distribution (Ma & Pohlman, 2008). Ma & Pohlman (2008) further suggest that if the distribution is not Gaussian but fat-tailed, quantile regression estimates will be more robust and efficient than the conditional mean estimates. The use of 2SLS follows Leuz, et al. (2003).
The authors note that institutional factors are often complementary, and thus, to control for the potential impact of other factors and disentanglement from investor protection’s direct effect is difficult. The application of 2SLS estimation addresses this concern.2 Table 5 presents the additional estimations and the original Pooled OLS regression for ease of comparison. 2SLS regression results are largely consistent with Pooled OLS regression. Analysts following, Disclosure Index. Legal Enforcement and Minority Investor Rights continue to show an inverse relationship with all three AEM detection methods.
A slight difference is noted in the Quantile regression method, where Analyst Following only shows significance under Model B and C. Preliminary results suggest that analysts influence accounting earnings and inhibit the practice of AEM. Previous studies suggest that EM practices increase during optimistic moments, yet firms monitored by analysts are more prone to restrain this behaviour.
Our findings aligns with Miranda, et al. (2018), Yu (2008), who also find greater analysts following to constrain EM activity yet is at odds with Enomoto, et al. (2015)’s mixed market study where a similarly significant relationship was not found. The positive relationship between Societal Trust and the three AEM detection proxies is contrary to expectations and Chen, et al. (2019) & Dong, et al. (2018)’s China-based studies. Of note, however, greater media coverage was instrumental in curbing corporate misconduct in their studies.
Further, Cui (2017) states that social trust’s effect depends on the institution level, which weakens with institutional strength. Research suggests that trade and institutional development have significantly transformed emerging countries’ essence (Bhattacharyya, 2012; Reddy et al., 2013). Cornett, et al., (2008) suggest that if institutional factors impact earnings and performance, then reported performance might be partially cosmetic, requiring the control for performance measures on the influence of managerial choice.
Accordingly, this study’s second cross-check reexamines Equation 3.6 with the addition of firm and country-level control variables. Kim & Yi (2006) state that the use of cross-country data may raise concerns over potential endogeneity. Country-wide, macroeconomic factors jointly influence the extent of AEM and institutional factors. Following Saona & Muro (2018), we posit that AEM cannot be adequately analyzed unless its internal and external determinants are considered.
| Table 4 Pooled OLS Regression Results of AEM, Institutional Settings, and Trust |
||||||
|---|---|---|---|---|---|---|
| Panel A-Model A | ||||||
| Constant | 57.4878*** | 3.6038 | 98.1515*** | 79.3471*** | 44.3968*** | 108.4712*** |
| (38.4411) | (0.8789) | (16.0532) | (12.0074) | (17.4969) | (11.7814) | |
| Analyst | -0.308 | -0.0753 | ||||
| (-2.152) | (-0.5474) | |||||
| Disclosure | - 7.7137*** | 9.7555** | ||||
| (-12.978) | (-16.0529) | |||||
| Enforcement | -9.3783** | -11.1189*** | ||||
| (-7.2708) | (-8.6184) | |||||
| Investor Rights | -4.3545*** | -13.4551*** | ||||
| (-3.8141) | (-11.364) | |||||
| Trust | .2945*** | .3196*** | ||||
| -4.5797 | -4.8845 | |||||
| N | 17,136 | 17,136 | 17,136 | 17,136 | 17,136 | 17,136 |
| R2/Adj-R2 | 0.0026 | 0.084 | 0.028 | 0.0079 | 0.0113 | 0.1825 |
| Table 5 Pooled OLS Regression Results of AEM, Institutional Settings, and Trust |
||||||
|---|---|---|---|---|---|---|
| Panel B-Model B | ||||||
| Constant | 57.2011*** | 5.8752 | 96.3802*** | 89.1008*** | 47.198*** | 118.3319*** |
| (46.8657) | (1.7765) | (19.3719) | (16.5167) | (22.7636) | (16.3301) | |
| Analyst | -.3786*** | -0.0617 | ||||
| (-3.1976) | (-.5676) | |||||
| Disclosure | - 7.3599*** | -9.7382*** | ||||
| (-15.2126) | (-20.416) | |||||
| Enforcement | -9.1133*** | -11.0163*** | ||||
| (-8.6823) | (-10.9826) | |||||
| Investor Rights | -6.1755*** | -14.8405*** | ||||
| (-6.612) | (-15.9982) | |||||
| Trust | .198*** | .248*** | ||||
| (3.7763) | (4.9479) | |||||
| N | 17,136 | 17,136 | 17,136 | 17,136 | 17,136 | 17,136 |
| R2/Adj-R2 | 0.0053 | 0.1046 | 0.0367 | 0.0216 | 0.0071 | 0.2526 |
| Table 6 Pooled OLS Regression Results of AEM, Institutional Settings, and Trust |
||||||
|---|---|---|---|---|---|---|
| Panel C-Model C | ||||||
| Constant | 57.3058*** | 4.3185 | 96.1639*** | 89.6948*** | 47.0118*** | 118.2039*** |
| (44.64) | (1.2397) | (18.3453) | (15.8017) | (21.5649) | (15.3851) | |
| Analyst | -.3605*** | -0.0825 | ||||
| (-2.8946) | (-.7157) | |||||
| Disclosure | - 7.6184*** |
-10.0412*** | ||||
| (-14.9504) | (-19.8546) | |||||
| Enforcement | -9.3783** | -11.0182*** | ||||
| (-7.2708) | (-10.3601) | |||||
| Investor Rights | -6.2564*** | -15.2311*** | ||||
| (-6.3662) | (-15.4859) | |||||
| Trust | .2072*** | .2615*** | ||||
| (3.76) | (4.9212) | |||||
| N | 17,136 | 17,136 | 17,136 | 17,136 | 17,136 | 17,136 |
| R2/Adj-R2 | 0.0044 | 0.1014 | 0.0326 | 0.02 | 0.0071 | 0.2398 |
Pooled OLS use is supported by the Hausman test for fixed vs. random effect, which finds a chi-square of 0.25 and a p-value of 0.9694. Breusch-Pagan Lagrangian multiplier test for random effects vs OLS finds a chi-square of 0.00 and a p-value of 1.0. These indicate Pooled OLS is efficient. T-statics are reported in parenthesis. Significance is identified at three levels: 0.05*, 0.01**, and 0.001***.
| Table 7 Pooled OLS, Quantile Regression, 2SLS Regression Results. Note: T-Statics Reported in Parenthesis. Significance is Identified at Three Levels: 0.05*, 0.01**, and 0.001***. |
|||||||||
|---|---|---|---|---|---|---|---|---|---|
| Pooled OLS Model | Quantile Regression Model | 2SLS Regression Model | |||||||
| Variable | Model A | Model B | Model C | Model A | Model B | Model C | Model A | Model B | Model C |
| Constant | 108.4712 *** | 118.3319 *** | 118.2039 *** | 31.945 *** | 34.383 *** | 34.671 *** | 89.296 *** | 100.592 *** | 101.043 *** |
| (11.781) | (16.3301 ) | (15.3851 ) | (8.32) | (9.92) | (10.00) | (27.37) | (32.67) | (32.79) | |
| Analyst | -0.0753 | -0.0617 | -0.0825 | -0.071 | - 0.124* | -0.123* | -0.035 | -0.007 | -0.006 |
| (-.5474) | (-.5676) | (-.7157) | (-1.11) | (-2.47) | (-2.46) | (-0.64) | (-0.17) | (-0.14) | |
| Disclosur e | - 9.7555** * | - 9.7382** * | - 10.0412* ** | - 7.252* ** | - 6.935* ** | - 6.934* ** | - 8.804* ** | - 8.830** * | - 8.834** * |
| (- 16.0529) | (-20.416) | (- 19.8546) | (- 29.23) | (- 30.80) | (- 30.78) | (- 41.76) | (-44.15) | (-44.13) | |
| Enforcem ent | - 11.1189* ** | - 11.0163* ** | - 11.0182* ** | - 4.191* ** | - 4.189* ** | - 4.239* ** | - 8.999* ** | - 9.920** * | - 9.953** * |
| ( - 8.6184) | (- 10.9826) | (- 10.3601) | (-7.65) | (-8.43) | (-8.53) | (- 19.32) | (-22.49) | (-22.54) | |
| Investor Rights | - 13.4551* ** | - 14.8405* ** | - 15.2311* ** | - 4.880* ** | - 4.848* ** | - 4.842* ** | - 11.339 *** | - 12.254* ** | - 12.310* ** |
| (-11.364) | (- 15.9982) | (- 15.4859) | (-9.87) | (- 10.76) | (- 10.74) | (- 26.99) | (-30.62) | (-30.73) | |
| Trust | .3196*** | 0.248*** | 0.2615** * | 0.286* ** | 0.237* ** | 0.236* ** | 0.425* ** | 0.369** * | 0.370** * |
| (4.8845) | (4.9479) | (4.9212) | (9.93) | (9.20) | (9.15) | (17.37) | (16.15) | (16.17) | |
| N | 17,136 | 17,136 | 17,136 | 15674 | 17336 | 17336 | 15674 | 17336 | 17336 |
| adj R2/Pseud oR2 | 0.1825 | 0.2526 | 0.2398 | 0.055 | 0.052 | 0.052 | 0.145 | 0.147 | 0.148 |
Enomoto, et al. (2018) suggests that managers’ opportunistic behaviour is lower under more developed financial systems due to an increased need for higher quality accounting information. Saona & Muro (2018) find that managers have less need for EM in less developed and less competitive markets.
As financial market development is higher in countries with higher GDP per capita (Deltuvaite? & Sinevic?iene?, 2014), positively associated with economic growth (Levine et al., 2000) and growth significantly impacted by trade liberalization (Hye et al., 2016), these are controlled for via GDP per capita, GDP growth, and Trade Openness. A dichotomous variable is also included for markets that have adopted International Financial Reporting Standards (IFRS) for it has been associated with increased earnings quality and decreased AEM (Capkun et al., 2016; Wijayana & Gray, 2019; Martens et al., 2020). Firm-level variables also exhibit linkages in emerging markets where owner-agency problems increase (Hoskisson et al., 2013). Chung & Zhang (2011) suggest that institutional shareholders can better analyze firm performance and detect financial misreporting, much like Big-4 auditors are more apt to spot internal control weaknesses (Kanagaretnam et al., 2016). We therefore include a dichotomous variable if the firm employs a Big-4 auditor. Capital structure and company growth opportunities are also items controlled for via firm leverage and book-to-market ratios. When firms maintain relatively low debt levels, managers engage in active opportunistic manipulation of financial statements, whereas relatively high debt constrains EM (Saona & Muro, 2018).
This paper also controls for firm size as size may affect corporate governance characteristics and financial performance (Shawtari et al., 2016). Time and industry dummies variables are also included to control for possible time and industry effects. The second robustness test highlights the relationship between Analysts Following and the Yoon and Kothari AEM proxies. Analyst Following now exhibits significance across all three regression methods, suggesting earlier results may have suffered from omitted variable bias due to negative cofounders or extreme outliers. The inverse relationship between AEM and Disclosure index and Legal Enforcement remains unchanged; however, Minority Investors Rights fails to show a relationship under quartile estimation. The level of Societal Trust also continues to remain positive and significant. Country-level control variables of GDP per capita, GDP growth show a significantly negative relationship with AEM activity, suggesting that managers in wealthier frontier countries and firms from countries with greater growth engage in less AEM activity. This finding aligns with Dimitras, et al., (2015), who note that AEM activity is not connected to GDP changes; Chen, et al., (2020) find that firms operating in areas where GDP is lower than adjacent areas engage in more EM.
Firm-level control variables show firm size is inversely related to AEM activity; smaller firms engage in more AEM activity than larger firms. This is consistent with Siregar & Utama (2008) & Dimitras, et al. (2015). Our Big-4 auditor finding is consistent with Krishnan (2003) & Alzoubi (2016), who suggest large auditors have greater capital, technology, human resources, and experiences from which higher audit quality flows and EM is constrained. The leverage coefficient was generally positive but not always significant, thus inconclusive. Leverage findings align with Anagnostopoulou & Tsekrekos (2017), who find leverage had no significant effect on income-increasing AEM.
| Table 8 OLS, Quantile Regression, 2SLS Regression with Control Variables. 1 T- Statics Reported in Parenthesis 2 Significance is Identified at Three Levels: 0.05*, 0.01**, and 0.001***. |
|||||||||
|---|---|---|---|---|---|---|---|---|---|
| Pooled OLS Model | Quantile Regression Model | 2SLS Regression Model | |||||||
| Variables | Model A | Model B | Model C | Model A | Model B | Model C | Model A | Model B | Model C |
| Constant | 47.700* | 72.748* | 75.733* | 113.379* | 93.995* | 87.331* | 92.724* | 65.091* | 60.618* |
| ** | ** | ** | ** | ** | ** | ** | ** | ||
| -2.49 | -9.79 | -10.23 | -10.91 | -9.1 | -8.88 | -11.63 | -8.04 | -7.43 | |
| Analyst | -0.106 | - 0.227** * | - 0.254** * | 0.008 | - 0.291** * | - 0.313** * | - 0.633** * | - 0.475** * | - 0.473** * |
| (-1.80) | (-4.35) | (-4.88) | -0.09 | (-3.49) | (-3.95) | (-7.91) | (-6.65) | (-6.56) | |
| Disclosur e | - 6.767** * | - 6.925** * | - 7.273** * | - 6.109*** | - 6.855** * | - 7.109** * | - 2.284** * | - 2.466** * | - 2.664** * |
| (-32.58) | (-34.81) | (-36.68) | (-18.70) | (-21.61) | (-23.53) | (-6.64) | (-7.54) | (-8.08) | |
| Enforcem ent | - 4.827** * | - 5.649** * | - 5.544** * | -4.354** | - 6.292** * | - 6.205** * | - 49.509* ** | - 53.212* ** | - 54.743* ** |
| (-4.70) | (-5.94) | (-5.85) | (-2.69) | (-4.15) | (-4.30) | (-15.56) | (-17.64) | (-18.01) | |
| Investor Rights | -1.052* | - 1.787** * | - 1.518** | -0.795 | -0.178 | -0.108 | - 16.110* ** | - 18.108* ** | - 18.387* ** |
| (-2.09) | (-3.64) | (-3.10) | (-1.00) | (-0.23) | (-0.15) | (-16.00) | (-17.68) | (-17.82) | |
| Trust | 0.179** * | 0.145** * | 0.131** * | 0.182*** | 0.161** * | 0.182** * | 0.973** * | 0.999** * | 1.014** * |
| -5.92 | -5.06 | -4.6 | -3.83 | -3.53 | -4.19 | -16.45 | -17.37 | -17.51 | |
| BigN | - 38.503* ** | - 28.546* ** | - 25.823* ** | - 36.558** * | - 31.194* ** | - 30.668* ** | 14.187* ** | 27.387* ** | 32.004* ** |
| (-15.39) | (-12.15) | (-11.03) | (-9.29) | (-8.33) | (-8.59) | -3.45 | -6.86 | -7.95 | |
| GDP per capita | - 9.409** * | - 8.794** * | - 8.986** * | 6.085*** | 5.384** * | 6.048** * | - 10.664* ** | - 12.535* ** | - 13.077* ** |
| (-12.42) | (-12.49) | (-12.81) | -5.11 | -4.8 | -5.66 | (-6.72) | (-8.38) | (-8.67) | |
| Trade openness | 0.155** * | 0.088** * | 0.060* | 0.091* | 0.046 | 0.025 | 1.001** * | 0.990** * | 0.994** * |
| -6.05 | -3.62 | -2.48 | -2.27 | -1.2 | -0.67 | -16.56 | -17.06 | -16.99 | |
| GDP Growth | - 0.797** * | - 0.718** * | - 0.771** * | -0.634** | - 0.752** * | - 0.703** | - 1.497** * | - 1.693** * | - 1.780** * |
| (-5.22) | (-5.02) | (-5.41) | (-2.64) | (-3.30) | (-3.24) | (-8.11) | (-9.40) | (-9.80) | |
| Book to Market | -0.006 | -0.011 | -0.013 | 0.005 | -0.002 | - 0.039** | -0.012 | -0.019 | -0.021 |
| (-0.58) | (-1.15) | (-1.34) | -0.32 | (-0.11) | (-2.60) | (-1.09) | (-1.62) | (-1.78) | |
| IFRS | 0 | 0 | 0 | 0 | 0 | 0 | 0 | 0 | 0 |
| 0 | 0 | 0 | 0 | 0 | 0 | 0 | 0 | 0 | |
| Leverage | 0.008 | 0.012* | 0.016** | 0.005 | 0.013 | 0.014 | 0.001 | 0.020** * | 0.025** * |
| -1.72 | -2.38 | -3.24 | -0.72 | -1.67 | -1.89 | -0.24 | -3.45 | -4.19 | |
| Size | - 2.781** * | - 1.444** * | - 0.699** | - 3.521*** | - 1.902** * | -0.780* | - 2.273** * | - 0.763** | -0.005 |
| (-12.52) | (-6.59) | (-3.20) | (-10.08) | (-5.44) | (-2.34) | (-8.79) | (-2.92) | (-0.02) | |
| Industry Dummy | yes | yes | yes | yes | yes | yes | yes | yes | yes |
| Year Dummy | yes | yes | yes | yes | yes | yes | yes | yes | yes |
| Observati ons | 7193 | 7944 | 7944 | 7193 | 7944 | 7944 | 7193 | 7944 | 7944 |
| Adjusted R-squared | 0.338 | 0.306 | 0.3 | 0.174 | 0.155 | 0.158 | 0.11 | 0.03 | 0.001 |
CONCLUSION AND IMPLICATIONS
The purpose of this study was to examine the ability of select institutional setting and cultural variables to curtail EM in emerging market countries. This study contributes to the literature by demonstrating minority investor rights, legal enforcement, disclosure requirements, and the number of analysts who follow a firm curtail EM activity. This finding aligns with developed market studies. Contrary to expectations and developed market studies, societal trust failed to show an ability to curtail EM. Additionally, while not part of the primary research objective, firm size and EM was also explored. Findings show that smaller firms have greater EM activity than large firms. Firms in countries experiencing economic growth, as measured by GDP growth, exhibit lower EM activity. Implications of the findings are as follows. First, the social norm theory, which posits that behaviour is impacted by what others believe and do, is less influential in reducing EM. This suggests formal institutions are more influential as control monitors in markets where governance is weaker and a consequence of EM is less severe. An alternative measure of social trust that controls for the impact of economic development, market development, education, and transportation may, however, produce different results.
Second, rising economic growth produces financial development and restricts EM activity. In stable economic periods, the incentive to exercise judgment in earnings is reduced is minimized. Third, firm size impacts EM activity. Larger firms are likely to possess stronger internal control systems and reputation concerns, suggesting smaller firms are disproportionately more likely to manage earnings. The scope of our study is limited to select emerging market countries. Distortions in EM practices from developed markets merit further segregated market research. While we used a variety of validated accruals EM detection methods, an examination of other EM techniques may provide additional insights into EM behaviour of emerging market firms.
| Table 9 Country and Firm Variable Description |
|
|---|---|
| Variable | Description |
| Firm-level | |
| Assets | (TA) Long-term assets and items of both current and non-current assets |
| Accruals | (ACC) Accruals, measured as the change in current assets minus the change in current liabilities minus depreciation expense as per Dechow et al. (1995) |
| Accounts Receivables | (AR) Gross receivables less allowance for doubtful accounts |
| Cash | Cash and cash equivalent |
| Cash flow from operations | (CFO) Cash From Operating Activities |
| Current assets | (CA) Total Current Assets, the sum of Cash and Short Term Investment, Total Receivables, Net Total Inventory, Prepaid Expenses, and Other Current Assets, |
| Current Liabilities | (CL) Total Current Liabilities, liabilities incurred from operating activities and expected to be due within one year. |
| Deprecation | (Dep) Depreciation and amortisation |
| Expense | (EXP) Selling/General/Administrative Expense, the operating costs of running a business other than the costs of readying products or services for sale |
| Pension | (PEN) Pension, all incomes and expenses associated with the company’s pension plan. |
| Property Plant & Equipment | (PPE) Property/Plant/Equipment, Total items assumed to be used for operations |
| Revenue | (REV) Revenues from the sale of merchandise goods, manufactured products and services, |
| Return on Assets | Measure of management’s effectiveness in using assets to generate earnings. Generally obtained using Ordinary Profit, divided by Total Assets |
| Short term debt | (STD) Short-Term Debt, short-term bank borrowings. It also represents notes payable that are issued to suppliers and other short-term interest-bearing liabilities |
| Trade Receivables | (REC) Trade Receivables, receivables from the sale of merchandise or services provided to affiliates or other related companies |
| Trade payables | (PAY) Trade Payable, payables for the receipt of merchandise or services provided to affiliates or other related companies |
| Taxes payable | (TP) Taxes Payable, represents changes in taxes payable during the period. |
| Firm Control Variable | |
| Analyst Following | Calculated as the natural log plus one of the number of analysts following a stock. Source: Thomson Reuters Datastream |
| Book to market | Calculated as the quotient of the book value of equity by the market value of equity |
| ratio | |
| Leverage | Calculated as the quotient of total assets by total liabilities |
| Size | Calculated as the natural logarithm of the market value of equity |
| Year Dummies | Year Dummy variables for each year in the study |
| Industry Dummies | Industry dummy variables for each industry in the study |
| Country-Level | |
| Legal Enforcement | Source: WDI’s Governance Indicators and Transparency International |
| Disclosure Requirements | Source: WDI’s Worldwide Extent of Business Disclosure Index. |
| Minority Investors Rights | Source: World Economic Forum Global Corruption Index on the Strength of Investor Protection |
| Societal Trust | Source: World Values Survey following Papanastasopoulos and Tsiritakis (2015), Trust scores are re-scaled from 0-10 in line with institutional variables. |
| Country Control Variables | |
| Big-4 | The percentage of firms that employ a Big4 auditing firm |
| IFRS adoption | A dichotomous variable of 1 if the country has adopted IFRS, 0 otherwise. Source: IFRS.org |
| GDP per Capita | Log of GDP per capita (constant 2005 US$). Source: WDI. |
| GDP growth rate | Rate of change in real GDP: Source |
| Trade openness | Trade openness 100(Exports+imports/GDP. Source: WDI |
| Earnings Management Variables | |
| Model A | Follows Leuz et al. (2003)'s |
| AEM1 | Follows Leuz et al. (2003)'s |
Follows Leuz et al., (2003)'s AEM is the ratio of the standard deviations of Operating income (OperInc) to cash flow from operations (CFO). Both variables scaled by total assets.  |
|
| AEM2 | AEM2 is the Spearman correlation between ACC and CFO. Lagged total assets scale both values. To calculate AEM2, accruals is first calculated as per below Accruals 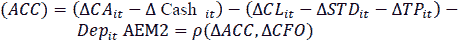 |
| AEM3 | AEM3 Is calculated as the ratio of the absolute accruals to absolute CFO. Larger AEM3 values signify greater levels of EM. 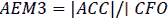 |
| Model B | Follows Yoon et al., (2006) is calculated as the ratio of the absolute accruals to absolute |
| Model C | Follows Kothari et al. (2005)'s performance-matched approach is calculated as the ratio of the absolute accruals to absoluteCFO. |
 |
|
References
- Ahmed, F., Ahmed, A., & Kanwal, S. (2018). Mergers and acquisitions in selected frontier markets of Asia. Signifikan: Jurnal Ilmu Ekonomi, 7, 123–136.
- Alareeni, B., & Aljuaidi, O. (2014). The modified jones and yoon models in detecting earnings management in palestine exchange (pex). International Journal of Innovation and Applied Studies, 9, 1472.
- Alfraih, M.M. (2016). Have financial statements lost their relevance? Empirical evidence from the frontier market of Kuwait. Journal of Advances in Management Research.
- Alzoubi, E.S.S. (2016). Audit quality and earnings management: Evidence from Jordan. Journal of Applied Accounting Research.
- Alzoubi, E.S.S. (2018). Audit quality, debt financing, and earnings management: Evidence from Jordan. Journal of International Accounting, Auditing and Taxation, 30, 69–84.
- An, Z., Li, D., & Yu, J. (2016). Earnings management, capital structure, and the role of institutional environments. Journal of Banking & Finance, 68, 131–152.
- Anagnostopoulou, S.C., & Tsekrekos, A.E. (2017). The effect of financial leverage on real and accrual-based earnings management. Accounting and Business Research, 47, 191–236.
- Atwi, L., Safieddine, A., & Titman, S. (2017). Investor protection and governance in the valuation of emerging markets investments. Journal of Applied Corporate Finance, 29, 89–100.
- Bao, B., & Bao, D. (2004). Income smoothing, earnings quality and firm valuation. Journal of Business Finance Accounting, 31, 1525–1557.
- Barber, B.M., & Odean, T. (2008). All that glitters: The effect of attention and news on the buying behavior of individual and institutional investors. The review of financial studies, 21, 785–818.
- Berglo F.E., & Claessens, S. (2006). Enforcement and good corporate governance in developing countries and transition economies. The World Bank Research Observer, 21, 123–150.
- Bhattacharyya, S. (2012). Trade liberalization and institutional development. Journal of Policy Modeling, 34, 253-269.
- Bozanic, Z., Chen, J., & Jung, M.J. (2019). Analyst contrarianism. Journal of Financial Reporting, 4, 61–88.
- Brandt, M.W., Brav, A., Graham, J.R., & Kumar, A. (2010). The idiosyncratic volatility puzzle: Time trend or speculative episodes? The Review of Financial Studies, 23, 863–899.
- Burgstahler, D., & Eames, M. (2006). Management of earnings and analysts’ forecasts to achieve zero and small positive earnings surprises. Journal of Business Finance & Accounting, 33, 633–652.
- Cai, G., Li, W., & Tang, Z. (2020). Religion and the method of earnings management: Evidence from China. Journal of Business Ethics, 161, 71–90.
- Callen, J.L., Morel, M., & Richardson, G. (2011). Do culture and religion mitigate earnings management? Evidence from a cross-country analysis. International Journal of Disclosure and Governance, 8, 103–121.
- Capkun, V., Collins, D., & Jeanjean, T. (2016). The effect of IAS/IFRS adoption on earnings management (smoothing): A closer look at competing explanations. Journal of Accounting and Public Policy, 35, 352–394.
- Chan, L.H., Chen, K.C., Chen, T.Y., & Yu, Y. (2014). Substitution between real and accruals-based earnings management after voluntary adoption of compensation clawback provisions. The Accounting Review, 90, 147–174.
- Chen, S., Cai, W., & Jebran, K. (2019). Does social trust mitigate earnings management? Evidence from China. Emerging Markets Finance and Trade, 1–22.
- Chen, X., Cheng, Q., Hao, Y., & Liu, Q. (2020). GDP growth incentives and earnings management: Evidence from china. Review of Accounting Studies, 1–38.
- Chui, A.C., Lloyd, A.E., & Kwok, C.C. (2002). The determination of capital structure: is national culture a missing piece to the puzzle? Journal of International Business Studies, 33, 99–127.
- Chung, K.H., & Zhang, H. (2011). Corporate governance and institutional ownership. Journal of financial and quantitative analysis, 46, 247–273.
- Coen, A., & Desfleurs, A. (2016). Another look at financial analysts’ forecasts accuracy: Recent evidence from eastern european frontier markets, in: Handbook of Frontier Markets. Elsevier, 171–189.
- Consoni, S., Colauto, R.D., & Lima, G.A.S.F.D. (2017). Voluntary disclosure and earnings management: Evidence from the Brazilian capital market. Revista Contabilidade & Financ, 28, 249–263.
- Cornett, M.M., Marcus, A.J., & Tehranian, H. (2008). Corporate governance and pay-for-performance: The impact of earnings management. Journal of financial economics, 87, 357–373.
- Cudia, C.P., & Dela, C.A.L.C. (2018). Determinants of earnings management choice among publicly listed industrial firms in the Philippines. DLSU Business & Economics Review, 27, 119–129.
- Cui, W. (2017). Social trust, institution, and economic growth: Evidence from china. Emerging Markets Finance and Trade, 53, 1243–1261.
- Dechow, P.M., Hutton, A.P., Kim, J.H., & Sloan, R.G. (2012). Detecting earnings management: A new approach. Journal of Accounting Review, 50, 275–334.
- Dechow, P.M., & Skinner, D.J. (2000). Earnings management: Reconciling the views of accounting academics, practitioners, and regulators. Accounting Horizons, 14, 235–250.
- Dechow, P.M., Sloan, R.G., & Sweeney, A.P. (1996). Causes and consequences of earnings manipulation: An analysis of firms subject to enforcement actions by the sec. Contemporary Accounting Review, 13, 1–36.
- Degeorge, F., Patel, J., & Zeckhauser, R. (1999). Earnings management to exceed thresholds. The Journal of Business, 72, 1–33.
- Deltuvaite?, V., & Sinevic?iene, L. (2014). Research on the relationship between the structure of financial system and economic development. Procedia- Social and Behavioral Sciences, 156, 533–537.
- Demirer, R. (2013). Can advanced markets help diversify risks in frontier stock markets? Evidence from gulf Arab stock markets. Research in International Business and Finance, 29, 77–98.
- Denlsetz, H., & Lehn, K. (1985). The structure of corporate ownership: Cause and consequence. Journal of Political, Economy, 93, 1155–1175.
- Dimitras, A.I., Kyriakou, M.I., & Iatridis, G. (2015). Financial crisis, GDP variation and earnings management in europe. Research in International Business and Finance, 34, 338–354.
- Dong, W., Han, H., Ke, Y., & Chan, K.C. (2018). Social trust and corporate misconduct: Evidence from China. Journal of Business Ethics, 151, 539–562.
- Doupnik, T.S., & Tsakumis, G.T. (2004). A critical review of tests of gray’s theory of cultural relevance and suggestions for future research. Journal of Accounting Literature, 23, 1.
- El-habashy, H.A. (2019). The effect of corporate governance attributes on accounting conservatism in Egypt. Academy of Accounting and Financial Studies Journal, 23, 1–18.
- El-Helaly, M., Shehata, N.F., & El-Sherif, R. (2018). National corporate governance, GMI ratings and earnings management. Asian Review of Accounting.
- Embong, Z., & Hosseini, L. (2018). Analyst forecast accuracy and earnings management. Asian Journal of Accounting and Governance, 10, 97–108.
- Enomoto, M., Kimura, F., & Yamaguchi, T. (2015). Accrual-based and real earnings management: An international comparison for investor protection. Journal of Contemporary Accounting & Economics, 11, 183-198.
- Enomoto, M., Kimura, F., & Yamaguchi, T. (2018). A cross-country study on the relationship between financial development and earnings management. Journal of International Financial Management & Accounting, 29, 166-194.
- Esty, B.C., & Megginson, W.L. (2003). Creditor rights, enforcement, and debt ownership structure: Evidence from the global syndicated loan market. Journal of Financial and Quantitative Analysis, 37–59.
- Fama, E.F., & Jensen, M.C. (1983). Agency problems and residual claims. The journal of law and Economics, 26, 327–349.
- Fan, J.P., Wei, K.J., & Xu, X. (2011). Corporate finance and governance in emerging markets: A selective review and an agenda for future research.
- Francis, J., LaFond, R., Olsson, P., & Schipper, K. (2005). The market pricing of accruals quality. Journal of accounting and economics, 39, 295–327.
- Graham, J.R., Harvey, C.R., Popadak, J., & Rajgopal, S. (2017). Corporate culture: Evidence from the field. Technical Report. National Bureau of Economic Research.
- Guan, Y., Lobo, G.J., Tsang, A., & Xin, X. (2020). Societal trust and management earnings forecasts. The Accounting Review, 0000-0000.
- Healy, P.M., & Wahlen, J.M. (1999). A review of the earnings management literature and its implications for standard setting. Accounting Horizons, 13, 365–383.
- Herdjiono, I., & Sari, I.M. (2017). The effect of corporate governance on the performance of a company. some empirical findings from indonesia. Journal of Management and Business Administration. Central Europe, 25, 33–52.
- Hill, C.W., & Jones, T.M. (1992). Stakeholder-agency theory. Journal of management studies, 29, 131–154.
- Ho, K.C., Yen, H.P., Gu, Y., & Shi, L. (2020). Does societal trust make firms more trustworthy? Emerging Markets Review, 42, 100674.
- Hofstede, G., 1980. Motivation, leadership, and organization: Do American theories apply abroad? Organizational Dynamics, 9, 42–63.
- Hong, S. (2020). Emerging Market Business Cycles with Heterogeneous Agents. Technical Report.
- Hong, Y., Huseynov, F., & Zhang, W. (2014). Earnings management and analyst following: A simultaneous equations analysis. Financial Management, 43, 355–390.
- Hoskisson, R.E., Wright, M., Filatotchev, I., & Peng, M.W. (2013). Emerging multinationals from mid-range economies: The influence of institutions and factor markets. Journal of Management Studies, 50, 1295–1321.
- Hye, Q.M.A., Wizarat, S., & Lau, W.Y. (2016). The impact of trade openness on economic growth in China: An empirical analysis. The Journal of Asian Finance, Economics, and Business, 3, 27–37.
- Ippoliti, R., Melcarne, A., & Ramello, G.B. (2015). The impact of judicial efficiency on entrepreneurial action: A european perspective. Economic Notes: Review of Banking, Finance and Monetary Economics, 44, 57–74.
- Islam, M.A., Ali, R., & Ahmad, Z. (2011). Is modified jones model effective in detecting earnings management? evidence from a developing economy. International Journal of Economics and Finance, 3, 116.
- Jensen, M.C. (1986). Agency costs of free cash flow, corporate finance, and takeovers. The American economic review, 76, 323–329.
- Jensen, M.C., & Meckling, W.H. (1976). Theory of the firm: Managerial behavior, agency costs and ownership structure. Journal of Financial Economics, 3, 305–360.
- Kanagaretnam, K., Lobo, G.J., Ma, C., & Zhou, J. (2016). National culture and internal control material weaknesses around the world. Journal of Accounting, Auditing & Finance, 31, 28–50.
- Kazemian, S., & Sanusi, Z.M. (2015). Earnings management and ownership structure. Procedia Economics and Finance, 31, 618–624.
- Kim, J., Kim, Y., & Zhou, J. (2017). Languages and earnings management. Journal of Accounting and Economics, 63, 288–306.
- Kim, J.B., & Yi, C.H. (2006). Ownership structure, business group affiliation, listing status, and earnings management: Evidence from Korea. Contemporary accounting research, 23, 427–464.
- Kothari, S.P., Leone, A.J., & Wasley, C.E. (2005). Performance matched discretionary accrual measures. Journal of Accounting and Economics, 39, 163–197.
- Krishnan, G.V. (2003). Audit quality and the pricing of discretionary accruals. Auditing: A journal of practice & theory, 22, 109-126.
- Kwok, C.C., & Tadesse, S. (2006). National culture and financial systems. Journal of International Business Studies, 37, 227–247.
- La Porta, R., Lopez-deSilanes, F., Shleifer, A., & Vishny, R. (2002). Investor protection and corporate valuation. The Journal of Finance, 57, 1147–1170.
- Lee, H.L., & Lee, H. (2015). Effect of information disclosure and transparency ranking system on mispricing of accruals of taiwanese firms. Review of Quantitative Finance and Accounting, 44, 445–471.
- Lemma, T.T., Lulseged, A., Mlilo, M., & Negash, M. (2019). Political stability, political rights and earnings management: Some international evidence. Accounting Research Journal.
- Leuz, C., Nanda, D., & Wysocki, P.D. (2003). Earnings management and investor protection: an international comparison. Journal of Financial Economics, 69, 505–527.
- Levine, R., Loayza, N., Beck, T. (2000). Financial intermediation and growth: Causality and causes. Journal of monetary Economics, 46, 31–77.
- Li, S., Ho Park, S., & Shuji Bao, R. (2014). How much can we trust the financial report? Earnings management in emerging economies. International Journal of Emerging Markets, 9, 33–53.
- Lin, F., Lin, S.W., & Fang, W.C. (2020). How CEO narcissism affects earnings management behaviors. The North American Journal of Economics and Finance, 51, 101080.
- Lin, F., & Wu, S.F. (2014). Comparison of cosmetic earnings management for the developed markets and emerging markets: Some empirical evidence from the United States and Taiwan. Economic Modelling, 36, 466-473.
- Liu, S., Lin, S., Sun, Z., & Yuan, L. (2021). Earnings management and firms’ investment behavior: The threshold effect of roe. Emerging Markets Review, 100797.
- Lobo, G.J., & Zhou, J. (2001). Disclosure quality and earnings management. Asia-Pacific Journal of Accounting & Economics, 8, 1–20.
- Ma, J., Pagan, J.A., & Chu, Y. (2009). Abnormal returns to mergers and acquisitions in ten Asian stock markets. International Journal of business, 14.
- Ma, L., & Pohlman, L. (2008). Return forecasts and optimal portfolio construction: A quartile regression approach. The European Journal of Finance, 14, 409–425.
- Martens, W., Yapa, P.W., & Safari, M. (2020). The impact of financial statement comparability on earnings management: Evidence from frontier markets. International Journal of Financial Studies, 8, 73.
- McNichols, M. (2002). Discussion of the quality of accruals and earnings: Multiples. Journal of Accounting Research, 40, 135–72.
- McShane, S., & Von Glinow, M.A. (2010). Organizational behaviour: Emerging knowledge and practice for the real world. McGraw-Hill: Irwin.
- Miranda, K.F., Machado, M.A., & Macedo, L.A. (2018). Investor sentiment and earnings management: Does analysts’ monitoring matter? RAM: Revista de Administrac¸a˜o Mackenzie, 19.
- Mostafa, W. (2017). The impact of earnings management on the value relevance of earnings: Empirical evidence from Egypt. Managerial Auditing Journal, 32, 50–74.
- Nofsinger, J.R., & Sias, R.W. (1999). Herding and feedback trading by institutional and individual investors. The Journal of finance, 54, 2263–2295.
- Oyebamiji, O.A. (2020). Audit quality and earnings management of selected listed consumer goods firms in Nigeria (2007-2016). Global Journal of Management and Business Research.
- Papanastasopoulos, G., & Tsiritakis, E. (2015). The accrual anomaly in Europe: The role of accounting distortions. International Review of Financial Analysis, 41, 176.
- Patel, S.A., Balic, A., & Bwakira, L. (2002). Measuring transparency and disclosure at firm-level in emerging markets. Emerging Markets Review, 3, 325–337.
- Pettit, R.R. (1972). Dividend announcements, security performance, and capital market efficiency. The Journal of Finance, 27, 993–1007.
- Pucheta-Mart´?nez, M.C., & Garc´?a-Meca, E. (2014). Institutional investors on boards and audit committees and their effects on financial reporting quality. Corporate Governance: An International Review, 22, 347–363.
- Rahman, M.M., Moniruzzaman, M., & Sharif, M.J. (2013). Techniques, motives and controls of earnings management. International Journal of Information Technology and Business Management, 11, 22–34.
- Reddy, K.S., Nangia, V.K., & Agrawal, R. (2013). Indian economic-policy reforms, bank mergers, and lawful proposals: The ex-ante and ex-post ‘lookup’. Journal of Policy Modeling, 35, 601–622.
- Roychowdhury, S. (2006). Earnings management through real activities manipulation. Journal of Accounting and Economics, 42, 335–370.
- Saona, P., & Muro, L. (2018). Firm-and country-level attributes as determinants of earnings management: An analysis for latin american firms. Emerging Markets Finance and Trade, 54, 2736–2764.
- Schein, E.H. (2010). Organizational culture and leadership. volume 2. John Wiley & Sons.
- Schipper, K. (1989). Commentary on earnings management. Accounting Horizons, 3, 91–102.
- Shankar, V., & Narang, U. (2019). Emerging market innovations: Unique and differential drivers, practitioner implications, and research agenda. Journal of the Academy of Marketing Science, 1-23.
- Shapiro, S.P. (2005). Agency theory. Annual review of sociology, 31.
- Shawtari, F.A., Salem, M.A., Hussain, H.I., Alaeddin, O., & Thabit, O.B. (2016). Corporate governance characteristics and valuation: Inferences from quartile regression. Journal of Economics, Finance and Administrative Science, 21, 81–88.
- Sheth, J.N. (2011). Impact of emerging markets on marketing: Rethinking existing perspectives and practices. Journal of marketing, 75, 166–182.
- Shleifer, A., & Vishny, R.W. (1997). A survey of corporate governance. The Journal of Finance, 52, 737–783.
- Siregar, S.V., & Utama, S. (2008). Type of earnings management and the effect of ownership structure, firm size, and corporate-governance practices: Evidence from Indonesia. The international journal of accounting, 43, 1–27.
- Sloan, R.G. (1996). Do stock prices fully reflect information in accruals and cash flows about future earnings? Accounting Review, 289–315.
- Stulz, R.M., & Williamson, R. (2003). Culture, openness, and finance. Journal of Financial Economics, 70, 313-349.
- Vo, X.V. (2017). How does the stock market value bank diversification? Evidence from Vietnam. Finance Research Letters, 22, 101–104.
- Wijayana, S., & Gray, S.J. (2019). Institutional factors and earnings management in the asia-pacific: Is ifrs adoption making a difference? Management International Review, 59, 307–334.
- Wu, Y., Duong, H.K., Libin, E., & Yao, H. (2021). The ownership effect on corporate investment distortion in the transitional economies: Mitigating or exacerbating? Review of Quantitative Finance and Accounting, 1–33.
- Xie, B., Davidson III, W.N., & DaDalt, P.J. (2003). Earnings management and corporate governance: The role of the board and the audit committee. Journal of Corporate Finance, 9, 295–316.
- Yoon, S.S., Miller, G., & Jiraporn, P. (2006). Earnings management vehicles for Korean firms. Journal of International Financial Management Accounting, 17, 85–109.
- Yu, F.F. (2008). Analyst coverage and earnings management. Journal of Financial Economics, 88, 245–271.
- Zhang, J.H. (2018). Accounting comparability, audit effort, and audit outcomes. Contemporary Accounting Research, 35, 245–276.
- Zhong, M., & Gao, L. (2017). Does corporate social responsibility disclosure improve firm investment efficiency? Review of Accounting and Finance.