Research Article: 2019 Vol: 23 Issue: 2
Reflection the Level of Disclosure on the Accounting Information Relevant Using Standards and Poor's Indicators
Sabeha Barazan Farhood, University of Baghdad
Abstract
The purpose of this study was to measure the commitment of companies to apply the standards of transparency in financial reporting and to determine the reflection of disclosure according to Standards & Poor's (S&P) on the relevant of accounting information, Was used the Bartov model to measure the relevant of accounting information through the regression equation. Was used A sample of five commercial banks from the banks listed in the Iraqi Stock Exchange was used for five years from 2012 to 2016. was used S&P indicators to measure the level of disclosure of the sample banks: (1) In the case of disclosure and zero in case of disclosure, (2) The most important results were that the four banks (the Iraqi Investment Bank, Al-Mansour Investment Bank, Middle East Bank, and Commercial Bank of Iraq) were the arithmetic mean for the disclosure of index indices less than 50% for all disclosure indices according to S&P. More than 50% disclosure of S&P. This study found that there are many factors that lead to the value of accounting information, including the market value of shares and book value, in addition to the application of international financial reporting standards, and the disclosure of banks according to the Standards and Poor's, they affect very little.
Keywords
Standards & Poor's Indicators, Bartov Model, Accounting Information Relevant, Disclosure, Transparency, Private Commercial Banks listed in the Iraqi Stock Exchange.
Introduction
The efficiency of transparency and accounting disclosure is based on a range of considerations, the most important of which are the specific characteristics of the accounting information, where the accounting information contained in it and the presentation of the reports and financial statements are reliable, relevant and understandable. The disclosure of these statements is useful and effective for its users. Or misrepresentation, and the lack of efficiency of this information affects the adequacy of disclosure, which is reflected negatively on its users, that is, the quality of disclosure of accounting information reflected in the characteristics of accounting information, and the current research attempt to find a mutual reflection between disclosure according to S&P indicators, and the adequacy of accounting information in a group of commercial banks listed on the Iraqi Stock Exchange. In the twenty-first century, Business Environment is becoming more complex, interdependent and dynamic (Abhishek, 2013). Companies in the contemporary business environment face many challenges which are the intensity of competition and the transparency of disclosure of accounting information is the main focus of the companies' continuity and long-term success, including factors economic result from wars and coups. Economic risks are often paired with political risks but can also arise from international money markets. Both risks are exacerbated by increased volatility and changes in laws (Carpenter & Dunung, 2013).
Accounting is heavily influenced by these structural factors and changes in the economy.
Accounting information affects all such changes and affects their relevant for decisionmaking purposes (Morley, 2011). The non-application of S&P International Standards for the disclosure of accounting information is a main factor affecting the relevant of accounting information, Chand et al. (2008).
The Theoerical Background Of The Study
Definition of Transparency
This term reflects that idea that a country needs to understand how a taxpayer is conducting its business, is structuring its operations, and is making investments in the country. To achieve this level of understanding, it may be necessary for the country to have a solid grasp of the taxpayer’s activities, transactions and business structure beyond the borders of that jurisdiction (Ring, 2014). Transparency refers to the principle of creating an environment where information on existing condition, decision and action are made accessible, visible, and understandable to all market participants (Lepadatu et al., 2009; Frank & Thomas, 2004; Robert, 2005).
Definition of Disclosure
Defined financial disclosure, as any deliberate release of financial (and non-financial) information, whether numerical or qualitative, required or voluntary, or via formal or informal channels. (Gibbins et al., 1990) Transparency and accountability: transparency refers to the principle of creating an environment where access to information on existing condition, decision and action, impressions, and the concept of all market participants and disclosure refers to a systematic process and provide information to support the decisions of the market by publishing financial statements on time and opening up to the outside environment and attract investment (Gheorghe & Pirnau, 2009).
Literature Review
Literature Review of Transparency and Disclosure
Both (Gheorghe et al., 2009) that transparency and accountability are important topics in determining economic policy over the past decade. With regard to policy, the market has become accustomed to secrecy. And the secret is regarded as essential to the exercise of power, with the added advantage of hiding the inefficiency of market policies. However, the policy also prevents the secret from getting their desired effects. The changing global economy and financial flows, which brought internationalization and increasing interdependence, have put the issue of openness in economic policy making process introduction
There is increasing recognition that national Governments including central banks, that transparency will improve predictability and thus the efficiency of policy decision and study paper concluded that the current adjustment of international financial reporting standards by Member States Must be complete in order to provide a common pattern for financial goals, as well as to international financial reporting standards geared more towards the needs of investors, emphasizing that the international financial reporting standards may constitute a database for calculating .While delivering (Fung, 2014) that the demand and need for adequate transparency and disclosure of financial information are appropriate for companies is essential for investors to enable them to how to make better decisions in a timely. Increased volatility in the current capital market pushes towards more demand for sound corporate governance practices and the demand for financial reporting and wider levels of transparency to reduce the fear and uncertainty among investors.
Financial markets have become throughout the world more conscious of their roles as self-organizing institutions and explore the possibility of using the listing requirements as a tool to upgrade corporate governance. High levels of disclosure and transparency, and the responsibilities of the Board of Directors, etc., will make the company attractive to investors and a greater chance of achieving good performance. Corporate governance principles confirm the existence of an effective Board, prudent and transparent internal control for its shareholders. To high standards of corporate governance practices and procedures manual is essential for effective management to enhance shareholder value. Both (Edeigba & Amenkhienan, 2017), the adequacy of accounting information is one of the factors that lead to transparency and is a financial reporting requirement on companies to provide data to help users make decisions. Sullivan (2005) in his study a series of disclosures that determined how to apply international financial reporting standards on the financial statements of the Reserve Bank of New Zealand in 2003, in addition to disclosures that covered accounting issues related to central banks as a result of the application of the application of the international accounting standard 39 financial instruments: Recognition and Shows and IAS21 effects of Changes in foreign exchange rates. The NZD financial statements may also be presented in a transparent manner to serve the decision-making parties.
While (Arsov et al., 2017), studied of the former socialist States concerning application of companies for corporate governance, the researchers tried to assess the level of transparency and to determine whether there are any factors that influence corporate behavior in this regard. Been using sample Consists of 145 companies of Croatia, Macedonia Slovenia and Serbia, with the application of the criteria for assessing the transparency and disclosure standards and study found that companies in these countries are in transparent level compared to their peers around the world, as shows d by a decade. Moreover, the same sample was used, the researchers applied regression analysis and found that the level of transparency is associated with a positive relationship with the size of the company and the need for external funding, and linked to a negative relationship between concentration of ownership and the researchers also noted a statistically significant relationship between transparency and profitability and to offer this result with that enjoyed by these companies in the stock market.
Drivdal (2015) is limited on Norwegian public companies reports relating to fiscal year 2014, reflecting information available to stakeholders in companies which reflected the available information used by stakeholders in the decision making process researcher measuring transparent disclosure of environmental performance, although a few companies included quantitative data on environmental performance, they have included all statements or disclosures relating to environmental impacts. Corporate annual reports included the least transparent about environmental issues only information on their environmental policies and standards for internal domestic reporting, while the researcher excluded metrics and performance results. In addition, some reports said that the company's activity has no effect on the environment.
Use the evaluation methodology, the verification of the importance of transparency and disclosure standard in sustainability reporting. Into highlighted these issues in conceptual framework and evaluation of shows standards according to these issues. And analysed evaluating results and in the end it was an interview with an expert from standard policy transparency to clarify remaining issues and though improvement and evolution of disclosure and transparency on sustainability in companies and business sectors has improved dramatically since its launch in 2004.
Kythreotis (2014) highlighted the conflict between current ways to shows relevant and reliability and honest representation, as specified in the conceptual framework. Relevant and reliability are shows d using four alternative regression models. This study sample consisted of companies listed on the stock exchange, which comprises 15 European countries had adopted international financial reporting standards of the counter, made up time period adopted by the researcher is 10 years from the year 2000 to the year 2009. Specifically, the selected period (2000-2004) as the period prior to the adoption of international accounting standards, while the period between (2005-2009) for being the period after adopting international accounting standards, the study found to increase the quality of financial statements of companies that adopt international accounting standards and are summarized as follows: first, increasing relevancy with regard to the financial statements for the period after adoption. This increased through the use of alternative shows meant and suggests an increase in the quality of financial statements. Secondly, there was an increase in the reliability of the financial statements, without being statistically significant. These findings indicate that the reliability of the financial statements has not changed by adopting IAS sample countries.
While (Vijitha & Nimalathasan, 2014), to test the practical and applied relationship between stock prices and explanatory variables such as NAVPS, EPS, P/E, ROE, 2007-2011. The result revealed that accounting information such as EPS and NAVPS and ROE was correlated with the price of a positive relationship with stock prices by 1% moral level, and also has a strong positive relationship. As the ratio of price to yield associated negatively with the stock price at the abstract level 5% of regression analysis, the study concluded that the value of accounting information's relationship has a great influence on the price of the stock by the 1% level.
At the same time EPS and NAVPS also have significant impact on the share price by 1% and 10% respectively than the ROE ratio P/E., and finally, the study found that the importance of accounting information to influence the stock prices and the value of accounting information provided by dramatically and Its stock prices both Khanna et al. (2004) analyse corporate disclosure practices as a function of their interaction with the United States markets to a group of companies consisting of 794 companies from 24 countries in Asia and the Pacific and Europe. And used with transparency and disclosure results analysis that was developed recently by Standard & Poor's, Score disclosure of companies from all over the world using American disclosure applications as standard implied, The results showed a positive correlation between the degree of disclosure and a variety of market interaction procedures, including a list of the United States, and American investment flows, export to the United States and operations in the United States. Trade with the United States, however, has little relationship among them. The analysis used to judge and analyze previously documented relationship between them and company size and performance and the country's legislation. Hunton et al. (2006) founded that the most transparent financial reports are those reports that make accounting information users have the ability to extract information easily and conveniently.
While (Hassan & Marston, 2010), assess the reliability and validity of shows and representation of the disclosure. (Lin & Scott, 2013), tested the commitment effect provided by mandatory disclosure and the information effect of voluntary disclosure on market illiquidity by exploring a regulatory change that allows smaller reporting companies to reduce the disclosure of certain information in their SEC filings. This regime change allows us to separate the commitment effect provided by mandatory disclosure from the information effect of voluntary disclosure.
(Bucevska & Arsov, 2017) tested the degree of transparency and disclosure, in addition to the regression results clearly indicated that countries with closer ties with the West have reached higher levels of corporate transparency. Obviously the level of economic development and E.U. membership affects positively on the patterns of corporate transparency and disclosure. This has been linked to the adoption of European Union guidance and support the implementation of these rules as a step towards the improvement of corporate governance practices as a whole. Differences between countries also finds that companies operating in the largest and most sophisticated markets feel stronger incentives to be more transparent than those in smaller economies could be additional impetus to intensify the process of integration of financial markets in a joint trading platform, which would endanger Companies more directly to a larger audience.
Literature Review of Accounting Information Relevant
The relevant is defined as the ability of financial statement information to capture and summaries firm value. Beisland (2010) and Brimble (2003) contributed in assessing the risk of banks through appropriate accounting information through, update and expand study in risk assessment, Incorporate accounting variables with additional metrics to systemic risk, provide proof of appropriate risk and predictive capabilities for Australian business environment accounting variables, and provide initial evidence regarding the importance of the organic industry in risk assessment, it is other essential contribution to study in a number of ways to further study including the development of forecasting models and the effects of industry membership and suggested that an relevant value accounting information, however only relationship became the functional model is more complex and requires the versions of highprofile study design, moreover, that the alternative trends to assess the role of accounting information, otherwise, the traditional income revenue model as useful in risk assessment and forecasting, resulting in a lot of understanding of how accounting information is used by investors and parties involved in the market, and this understanding will help develop future accounting procedures.
While Zulu et al. (2017) tested relevant of accounting information in case of preparation of interim financial reports and annual, that change over time, and aimed to show that the paper suitable for the interim financial statements are higher than the annual financial statements, and in the end researchers found the relevant value in both cases either prepare financial statements or interim financial statements prepared annually, and increasingly.
(Kouseidis et al., 2010) studied the effects of the international financial reporting standards reduced the content of the additional information to the book values of equity to stock prices. However, the additional information content of earnings in the period after application of international financial reporting standards .They tested the effect of adoption of international financial reporting standards on accounting information value in Nigeria. The study was based on interpretation of available funding theories on the value and timing of information. Showed the role of International Financial reporting standards with greater disclosure of economic events in addition to the fair assessment of economic events under international financial reporting standards. Getting the views of a number of financial analysts through the questionnaire by email.
(Prihatni et al., 2018) tried to test of accounting information relevant among manufacturing companies and financial services companies through international financial reporting period of 2008 until the year 2014 and was comparing the results of both groups of sectors. They explained the reason researchers compared to my collection is to have different characteristics, thus providing a variety of financial statements, and have different rules, some companies have applied within international financial reporting standards, as both sectors included in the GDP contribution Overall, this study used value of accounting profit and cash flow and book value on behalf of accounting information value. I used a quantitative approach, study paper. Sample General Company used industry and provide financial services in Indonesia stock exchange. The dependent variable for this search is to use the share price and the independent variable used in this study are EPS, book value per share and the total cash flow per share by analyzing study data using linear regression, search results showed that accounting information such as earnings And book value and cash flow have fluctuation in value, for the adoption and application of international financial reporting standards, while the importance of value is increased profits and book value and cash flow at the stage of applying the international financial reporting standards. Compared with the early adoption phase of international financial reporting standards, and thus of profit value higher than the book value of equity, and cash flows for both sets of manufacturing and financial services.
While Widyatama & Wirama (2018) studied the effect relevant accounting information value. And the researchers used quantitative methodology, study sample consisted of (111) listed company in the stock market in Indonesia, was viewed over (11), total (1221). Watch, the researchers used data analysis method used to test the hypothesis of the study, using test (ANOVA). Hypothesis test result showed that the study hypothesis was rejected that (the appropriate value of accounting information to companies that have more conservative accounting practices higher than companies with less conservative accounting practices.) And concluded that the appropriate value of dividends and book value is not affected by the application of accounting. This is seen through the slight difference appropriate accounting information value among a group of companies that have implemented an accounting reservation were low, moderate, high, and by checking the data obtained, the hypothesis was rejected due to the delays in publishing the financial statements and the low level of improvement.
Investors use the information. Analysed the relationship between accounting information value of relevant financial statements consolidated and individual financial statements of companies listed in India securities market according to S&P BSE-500 for fiscal year 2006 to fiscal year 2010, and the changes in them over time. The results were presented sufficient evidence that appropriate accounting information of listed companies, with total value of accounting information represented in earnings per share and book value per share while there were minor changes in the appropriate value for consolidated accounting information is consistent with expectations, and found evidence of falling prices on the appropriateness of accounting information value for both EPS and corporate study sample BVPS (1205) watch for fiscal year 2006 to fiscal year 2010 for listed companies in developing markets. The total agreed price regression results with the results obtained from the listed companies in developed financial markets.
In addition, when comparing the results with those of previous studies in emerging markets, as well as India, it seems that EPS and BVPS of companies listed on the BSE market more valuable. There was a significant decrease in the total value of the accounting information relevant during the sample. MP is the key variable while EPS and BVPS are conflated for independent accounts used in the study. The study can be extended by including more independent variables such as cash flow, profit distributions, variance analysis in stock prices or by multi-analysis.
Camodeca et al. (2014) verify accounting information relevant value using different markets as a sample search: United Kingdom and Italy. Starting from Edward, Bill and Olson, applying different models of regression analysis for three years (2011-2013) on a sample of 100 companies listed in the Milan Stock Exchange and the London Stock Exchange and classified by market capital, the study concluded: first, the evidence shows the importance of appropriate accounting information in Italy to a greater degree than in the United Kingdom, even if this result must be interpreted according to the characteristics of the sample. Secondly: the study confirmed that the accounting data value with a convenient high in Italy, refers to profits, while in the United Kingdom mainly focus on cash flows. The main differences between the above from the stock markets, the focus can be evaluated on the following factors: the legal system, capital markets and the role of the accounting profession.
While the objective of the paper by Enofe et al. (2014), to examine the importance of appropriate accounting data value in the Nigerian stock market. The aim of the study was to determine whether there is a correlation between accounting ks and stock prices in the Nigerian stock market appropriate have been shows d value accounting data, by calculating the correlation coefficient between stock prices and some accounting figures. In trying to estimate form, linear regression is used, the results showed that accounting information has the ability to get information that affect shareholder value and summarized, and the paper found a relationship between accounting figures and stock prices in the stock market.
Practical Side
Measurement of Variables
Measuring the commitment of commercial banks to S&P indicators
To measure the application of banks to S&P indicators, for five years (2012-2016), the researcher use the linear equation in multiple linear regressions is: (model shown in Appendix 1), Thus, for the remaining variables they were obtained through the SPSS program and included in Excel.
To determine the disclosure ratios: In the case of disclosure and zero in case of nondisclosure, the researcher used the arithmetic mean and the regression coefficient to measure the disclosure reflection on the value of the accounting information. S&P provided a measure of transparency of disclosure. Will present the information contained in this measure. The researcher applied this measure in two stages. In the first stage, transparency was measured at the level of each bank separately and for each year, Which was achieved by banks from the paragraphs of the scale for the period from 2012 to 2016, was took the average for each bank and five years, and the level of disclosure was measured at the level of the bank through the application of paragraphs for each axis of measurement, given one point as a weight for disclosure, For lack of disclosure, as the first axis included disclosure and transparency of the information (35) indicators, While the second axis was related to the transparency of the information related to the work of the Board of Directors and the management structure which consists of 35 indicators (Khanna et al., 2004). The second axis was to measure the ownership structure and investors' rights, The objective of this is to indicate the level of transparency at the level of each of the commercial banks, the sample of the (98) index, Financial Transparency and Disclosure (Financial) consists of 35 questions that try to assess whether information provided by the company will enable stakeholders to evaluate the financial condition and future viability of the company.
These include information on the quality of accounting standards used in the preparation of financial statements (e.g. U.S. GAAP or IAS), frequency of publication of financial statements (e.g. quarterly or annual), extent to which aggregated and disaggregated disclosures are provided (e.g. consolidated financial statements, segment data, information on affiliates in the firm owns minority stake, related party transactions), key accounting policies (e.g. asset valuation and depreciation), disclosure on auditors (e.g.: identity, audit fees, and non-audit fees), disclosure on business (e.g. nature of business, physical statistics, corporate strategy), and management analysis and forecasts (e.g. specific performance ratios, investment plans, earnings forecasts, industry trends). 10 Board and Management Structure and Processes (Governance) consists of 35 questions.
These range from board composition (e.g. number of directors, names and background information on directors, whether or not the directors are independent), board committees (e.g. information on audit, compensation and nominating committees), board compensation (e.g. directors’ salaries), top management board (e.g. names, background), top management compensation (e.g. salary levels, specifics of performance based compensation plans), and top management shareholdings. Ownership Structure and Investor Rights category (Ownership) consists of 28 questions regarding the composition of shareholdings in a company (e.g. number and identify of shareholders who own 5% or more shares each, identity of top 10 shareholders, percentage of cross-ownership), description of the equity claims against the company (e.g. description of share classes), details of shareholder rights (e.g. procedure for putting proposals at shareholder meeting and the way shareholders nominate directors to the board. Summarized the measurement level of disclosure of the total axes of each bank and five years, and can be indicated in the Appendix (1).
Measuring the relevant of accounting information: Was relied on the correlation between market information and accounting Information. The relationship between the market price of the share and the book value of the stock was examined (Bartov et al., 2005). In an attempt to identify the changes that have affected the accounting information resulting from the application of sample banks' study to IFRS. The model developed by using the Progression Ratio equity within SPSS package, a hexagonal matrix of factors (a) in the market share price equation at time t+6 months was constructed based on the variables of each company such as Book value of equity per share And (residuals), which were considered as coefficients of value: (a) in the matrix by intersection of 6 equations to evaluate 5 unknown values of regression coefficients (a) By applying the above equation in the SPSS system, The data shown in Appendix 2.
Research Methodology
The Problem of the Study
The Iraqi commercial banks in the selected sample did not measure the degree of compliance with the S&P indices in light of the application of international financial reporting standards and how this transparency and disclosure reflects the value of accounting information due to the lack of workers in accounting and financial entities, to achieve the degree of relevant of accounting information for decision making as the problem of study in the absence of a way to measure the degree of disclosure and transparency in Iraqi commercial banks in a way that affects the relevant of accounting information for its users, and here The following questions:
1. Do banks disclose the sample of data on their activities transparently according to the S&P indicators?
2. Is the lack of disclosure reflected in the achievement of the relevant of accounting information for decision makers and stakeholders with the bank?
The Important of Study
The importance of current study to make accounting information useful to its users through transparency in the disclosure of all data related to the activities of companies to the indicators of S&P, which leads to the achievement of the accounting information relevant to the needs of its users which is needed by the economy and meet the requirements of economic development, through Attract foreign investment. This study examined the relationship between the level of disclosure transparency in commercial banks and the degree of accounting information relevant by using standards and poor's indicators and Bartov model to measure the degree of relevant of the accounting information in the Iraqi commercial banks that were selected as a sample of the research, because the disclosure of accounting affects the quality of accounting information (Abdullah, 2013).
The Objectives of Study
There are three key objectives of this study were:
1. know the level of financial transparency and disclosure of ownership and equity structure information, transparency of financial and non-financial information, and disclosure of transparency of information relating to the Board of Directors in the annual financial statements of listed companies in the Iraqi Stock Exchange.
2. Understand the concept of transparency in disclosure according to Standard & Poor's Financial Services indicators. And the most important indicators that measure the extent of companies' commitment to disclosure according to Standard & Poor's.
3. To establish the relationship between the companies' commitment to the study sample to transparently disclose according to the S&P scale and to verify the appropriateness of the accounting information.
The Variables of the Study
Figure 1 illustrates the study variables and their relationship as follows:
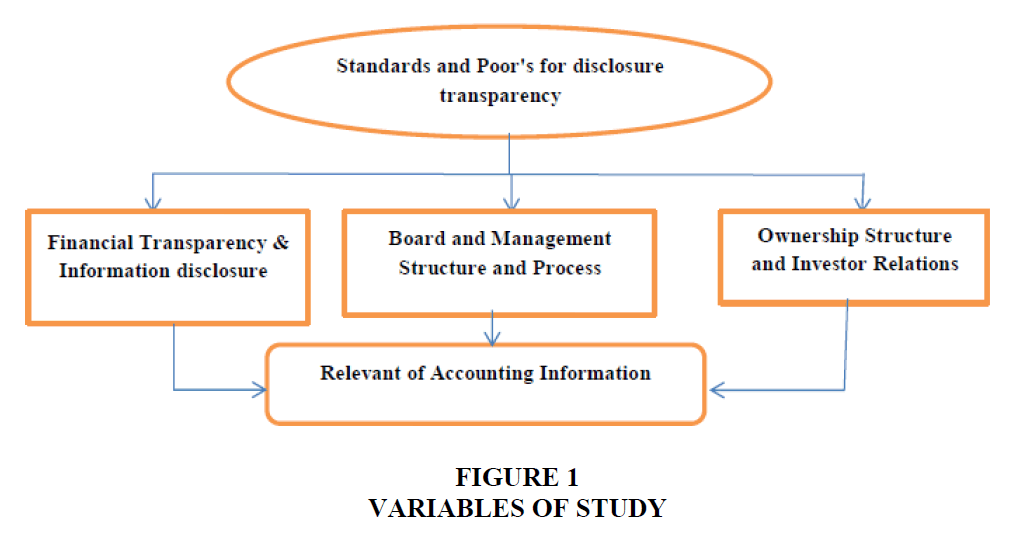
Figure 1: Variables Of Study
The Hypotheses of Study
In order to achieve the objectives of the study was developed hypotheses study and to carry out the practical side of the article, the researcher developed two main hypotheses:
H1 companies verify the sample acceptable degree of compliance with the scale of S&P transparency.
H2: is that there is a relationship between the degree of S&P companies' compliance with transparency and the appropriateness of accounting information.
Sample Selection:
The sample selected from a group of commercial banks listed in the Iraqi Stock Exchange is as follows:
1. Middle East Bank.
2. Iraqi Credit Bank.
3. Investment Bank of Iraq.
4. Commercial Bank of Iraq.
5. AL-Mansour Bank for Investment.
Limits of Study
31/12/2012, 31/12/2013, 31/12/2014, 31/12/2015, and 31/12/2016
Variables measurement techniques: The researcher used the following techniques to measure the search variables:
1. Measuring the commitment of commercial banks to S&P indicators: To measure the degree of commitment of banks to indicators of transparency and disclosure on the basis of S&P indicators, for five years (2012-2016), the researcher use the linear equation in multiple linear regressions is (model shown in Appendix 1).
Y=a+a1 X1+a2 X2+.........+e
Where, Y=The dependent variable.
a=Fixed constant or intercept value.
a1=Gradient slope y on the first independent variable.
a2=Slope y on the second independent variable.
1X=The first independent variable.
2X=The second independent variable.
They were obtained through the SPSS program and included in Excel, to measure the average for each bank was extracted by applying the following equation:
Average=(a+ a1+ a2+…+ an)/ n
2. Measuring the relevant of accounting information: To measure the appropriateness of accounting information, the researcher used the Bartov model (Bartov et al., 2005). The model developed as:
Pit+6=a0+a1 Post+a2 Bvpsit+a3 Eps(1)it+a4 Post*Bvpsit+a5 Post*Epsit+Uit+6
Pit+6=Market share price at time t+6 months.
Bvpsit=Book value of equity per share.
Eps (1)it=Income (before extraordinary items) per share.
Post=Dummy-variable equals to (1) for the period after the adoption of IFRS and to (0) for the period prior.
Uit+6=residuals.
3. Analysis techniques: The researcher depends on the analysis of the search variables on the results of the equations used in the measurement, as well as the use of deductive method in the analysis.
Results
Analysis of Results
Tables 1-11 below explain the research model for measuring banks' compliance with disclosure and transparency S&P indicators as follows.
| Table 1: Measuring The Level Of Transparency Of Middle East Bank At Years 2012-2016 | ||||||
| Financial transparency & information disclosure | ||||||
| Years | 2012 | 2013 | 2014 | 2015 | 2016 | |
| Disclosure rate | 34% | 34% | 34% | 54% | 54% | |
| Non-disclosure rate | 66% | 66% | 66% | 46% | 46% | |
| Board and management structure and process | ||||||
| Disclosure rate | 49% | 49% | 49% | 51% | 51% | |
| Non-disclosure rate | 51% | 51% | 51% | 49% | 49% | |
| Ownership structure and investor relations | ||||||
| Disclosure rate | 39% | 39% | 39% | 39% | 39% | |
| Non-disclosure rate | 61% | 61% | 61% | 61% | 61% | |
| Wanted average to total items | ||||||
| Disclosure rate | 41% | 41% | 41% | 49% | 49% | |
| Non-disclosure rate | 59% | 59% | 59% | 51% | 51% | |
| Table 2: Measuring the level of transparency of iraqi credit bank at years 2012-2016 |
|||||
| Financial transparency & information disclosure | |||||
| Years | 2012 | 2013 | 2014 | 2015 | 2016 |
| Disclosure rate | 46% | 46% | 49% | 74% | 74% |
| Non-disclosure rate | 54% | 54% | 51% | 26% | 26% |
| Board and management structure and process | |||||
| Disclosure rate | 60% | 60% | 60% | 69% | 69% |
| Non-disclosure rate | 40% | 40% | 40% | 31% | 31% |
| Ownership structure and investor relations | |||||
| Disclosure rate | 50% | 50% | 57% | 57% | 57% |
| Non-disclosure rate | 50% | 50% | 43% | 43% | 43% |
| Wanted average to total items | |||||
| Disclosure rate | 52% | 52% | 55% | 67% | 67% |
| Non-disclosure rate | 48% | 48% | 45% | 33% | 33% |
| Table 3: Measuring The Level Of Transparency For Iraqi Investment Bank At Period 2012- 2016 | ||||||
| Financial transparency & information disclosure | ||||||
| Years | 2012 | 2013 | 2014 | 2015 | 2016 | |
| Disclosure rate | 34% | 34% | 40% | 57% | 57% | |
| Non-disclosure rate | 66% | 66% | 60% | 43% | 43% | |
| Board and management structure and process | ||||||
| Disclosure rate | 49% | 49% | 51% | 57% | 60% | |
| Non-disclosure rate | 51% | 51% | 49% | 43% | 40% | |
| Ownership structure and investor relations | ||||||
| Disclosure rate | 43% | 43% | 43% | 43% | 43% | |
| Non-disclosure rate | 57% | 57% | 57% | 57% | 57% | |
| Wanted average to total items | ||||||
| Disclosure rate | 42% | 42% | 45% | 53% | 54% | |
| Non-disclosure rate | 58% | 58% | 55% | 49% | 46% | |
| Table 4: Measuring the level of transparency for the commercial bank of Iraq at period 2012-2016 |
|||||
| Financial transparency & information disclosure | |||||
| Years | 2012 | 2013 | 2014 | 2015 | 2016 |
| Disclosure rate | 34% | 34% | 34% | 54% | 54% |
| Non-disclosure rate | 66% | 66% | 66% | 46% | 46% |
| Board and management structure and process | |||||
| Disclosure rate | 49% | 49% | 49% | 51% | 51% |
| Non-disclosure rate | 51% | 51% | 51% | 49% | 49% |
| Ownership structure and investor relations | |||||
| Disclosure rate | 39% | 39% | 39% | 39% | 39% |
| Non-disclosure rate | 61% | 61% | 61% | 61% | 61% |
| Wanted average to total items | |||||
| Disclosure rate | 41% | 41% | 41% | 49% | 49% |
| Non-disclosure rate | 59% | 59% | 59% | 51% | 51% |
| Table 5: Measuring the level of transparency for al-mansor investment Bank at period 2012-2016 | |||||
| Financial transparency & information disclosure | |||||
| Years | 2012 | 2013 | 2014 | 2015 | 2016 |
| Disclosure rate | 46% | 46% | 49% | 69% | 69% |
| Non-disclosure rate | 54% | 54% | 51% | 31% | 31% |
| Board and management structure and process | |||||
| Disclosure rate | 49% | 49% | 49% | 51% | 51% |
| Non-disclosure rate | 51% | 51% | 51% | 49% | 49% |
| Ownership structure and investor relations | |||||
| Disclosure rate | 39% | 39% | 39% | 39% | 39% |
| Non-disclosure rate | 61% | 61% | 61% | 61% | 61% |
| Wanted average to total items | |||||
| Disclosure rate | 45% | 45% | 46% | 54% | 54% |
| Non-disclosure rate | 55% | 55% | 54% | 46% | 46% |
| Table 6: Calculate of average banks, commitment to transparency Accordibng to s&p indicators |
|||
| No | Name of Bank | Arithmetic Mean | Rate |
| 1 | Middle East Bank | 44.08 | 45% |
| 2 | Iraqi Credit Bank | 58.78 | 60% |
| 3 | Investment Bank of Iraq | 47.14 | 48% |
| 4 | Commercial Bank Of Iraq | 44.08 | 45% |
| 5 | AL-Mansour Bank for Investment | 48.78 | 50% |
| Table 7: Regression Confficien For Each Index For Middle East Bank | |||
| Years | Financial Transparency And Information Disclosure% | Board And Management Structure and Process% | Ownership Structure And Investor Relation s% |
| 2012 | 34 | 49 | 39 |
| 2013 | 34 | 49 | 39 |
| 2014 | 34 | 49 | 39 |
| 2015 | 54 | 51 | 39 |
| 2016 | 54 | 51 | 39 |
| Average | 42 | 49.8 | 39 |
| Regression value | 6 | 0.6 | 0.6 |
| Table 8: Regression Confficien For Each Index For Iraqi Credit Bank | |||
| Years | Financial Transparency And Information Disclosure % | Board and Management Structure and Process % | Ownership Structure And Investor Relations % |
| 2012 | 46 | 60 | 50 |
| 2013 | 46 | 60 | 50 |
| 2014 | 49 | 60 | 57 |
| 2015 | 74 | 69 | 57 |
| 2016 | 74 | 69 | 57 |
| Average | 57.8 | 63.6 | 54.2 |
| Regression value | 8.4 | 2.7 | 2.1 |
| Table 9: Regression Confficien For Each Index For Investment Bank Of Iraq | |||
| Years | Financial Transparency And Information Disclosure % | Board and Management Structure And Process % | Ownership Structure And Investor Relations % |
| 2012 | 34 | 49 | 43 |
| 2013 | 34 | 49 | 43 |
| 2014 | 40 | 51 | 43 |
| 2015 | 57 | 57 | 43 |
| 2016 | 57 | 60 | 43 |
| Average | 44.4 | 53.2 | 43 |
| Table 10: Regression Confficien For Each Index For Commercial Bank Of Iraq | |||
| Years | Financial Transparency And Information Disclosure % | Board And Management Structure and Process % | Ownership Structure And Investor Relations % |
| 2012 | 34 | 49 | 39 |
| 2013 | 34 | 49 | 39 |
| 2014 | 34 | 49 | 39 |
| 2015 | 54 | 51 | 39 |
| 2016 | 54 | 51 | 39 |
| Average | 42 | 49.8 | 39 |
| Regression value | 6 | 0.6 | 0.6 |
| Table 11: Regression confficien for each index for al-mansor bank for Investment | |||
| Years | Financial Transparency And Information Disclosure % | Board And Management Structure And Process % | Ownership Structure And Investor Relations % |
| 2012 | 49 | 39 | 46 |
| 2013 | 49 | 39 | 46 |
| 2014 | 49 | 39 | 46 |
| 2015 | 51 | 39 | 54 |
| 2016 | 51 | 39 | 54 |
| Average | 49.8 | 39 | 48.8 |
| Regression value | 0.6 | 0.6 | 2.70 |
Table 1 shows the low level of disclosure by the Middle East Bank for S&P indicators for the three years (2012-2013-2014) and the rise in the disclosure index for the years 2015-2016 for the banks' compliance with the International Financial Reporting Standards (IFRS).
Table 2, shown the level of disclosure in Iraqi credit bank at years (2012-2016), in the first three years was low and less than 50%, whereas in the years 2016, the level of disclosure in the first three years was low and less than 50%, The level of disclosure in all S&P axes has increased because the Bank has committed to apply IFRS in the preparation of financial reports.
Table 3 shows that the level of disclosure in the Iraqi Investment Bank for the first axis was very weak in 2012 and 2013 despite the slight increase in 2014, it continued to decline until IFRS was applied in the preparation of financial reports For the years 2015 and 2016, rising to a level of disclosure to 57%. As for the second and third axes, the level of disclosure for the three years (2012, 2013 and 2014) decreased in 2015 and 2016 due to the application of IFRS in the preparation of financial reports. This affects the total disclosure rate for all axes.
Table 4 Shows the level of disclosure in the Commercial Bank of Iraq for the first axis was very weak in the years 2013, 2012 and 2014, until the implementation of the International Financial Reporting Standards IFRS in the preparation of financial reports for the years 2015 and 2016 rose to the level of disclosure To 57%. On the second axis, the five-year decline continued, while the third axis decreased the level of disclosure for the three years (2012, 2013 and 2014) and increased in 2015 and 2016 due to the application of IFRS in the preparation of financial reports. This has an effect on the total disclosure ratio of all the bank's axes.
Table 5 shows that the level of disclosure in Al-Mansour Investment Bank in the first axis was low in 2012 and 2013, despite the slight increase in 2014, but it continued to decline, until the application of the International Financial Reporting Standards IFRS in the preparation of financial reports For the years 2015 and 2016, rising to a level of disclosure to 69%. As for the second pillar, the level of disclosure for the three years (2012, 2013 and 2014) decreased in 2015 and 2016 due to the application of IFRS in the preparation of financial statements. On the third axis, the five-year decline continued. This affects the total disclosure rate for all axes.
The Table 6 shows average of disclosure according to the indicators of the Middle East Investment Bank, the Iraqi Investment Bank, the Commercial Bank of Iraq, and the Al- Mansour Investment Bank were less than the average of the total points. This means that the average of the disclosure commitment for each bank is as follows: These banks did not commit to disclosing financial and non-financial information according to S&P indices, except for the Iraqi credit bank, as the disclosure ratio was higher than the rest of the banks and higher than the average of the total points with average disclosure points 58.78 and 60%.
After measuring the banks commitment in S&P indicators, were found that four banks (Investment Bank of Iraq, Mansur Investment Bank Middle East Bank, commercial bank of Iraq) the arithmetic mean of the disclosure shows indicators less than 50% of all disclosure indicators according to S&P, while the Iraqi only bank credit Bank got the 50% more disclosure of disclosure for S&P. So the hypothesis of the three banks refused to accept Iraqi bank credit. By calculate the regression coefficient for each of the indicators the S&P. Each bank for each year and the five-year rate of decline in amount recognition rates of disclosure according to the S&P scale of data Table 5 take the ratio of total disclosure for each of the three indicators :
1. Financial transparency & information disclosure.
2. Board and management structure and process.
3. Ownership structure and investor relations.
Table 7 regression coefficient for each indicator for Middle East Bank through observe that your average disclosure rate low but positive, gradient 6, pointed Fluke high rate disclosure, up to 54% after they were 34% and is a positive indicator that the Bank committed itself to applying international financial reporting standards IFRSs for fiscal years 2015 and 2016, which was based on the Iraqi Central Bank instructions and guidance on the application of these standards. As well as the obligation to disclose the second vertebrae as she was positive but low disclosure rate and the value of 49.8 and regression value were positive 0.6 to increase disclosure by a low rate in the years 2015 and 2016. The third indicator only characterized by the steady rate of disclosure for five years and unchanged a few regression value was positive, and not affected by the disclosure paragraphs third indicator, execution of Central Bank of Iraq instructions IFRSs.
Table 8 the regression coefficient for each Iraqi bank Credit Bank the regression coefficient for each Iraqi bank Credit Bank through the Table 9 Observed that your average share index had risen five years reveal the paragraphs on disclosure of financial information and has been positive, and gradient 8.4, note the high percentage of disclosure, Rose to 74% after it was 46% in 2012 and 2013, and rose slightly in the year 2014, 2015 and 2016 years total vertebrae disclosed and is a positive indicator that the bank committed itself to applying international financial reporting standards IFRSs for fiscal years 2015 and 2016, which was based on you CBI instructions in applying these standards.
As well as the obligation to disclose the second paragraphs if disclosure rate is positive and 63.6%, value gradient was 2.7 to increase the proportion of high-rate disclosure rate in the years 2015 and 2016. The third indicator only the average percentage of disclosure of equity structure indicators to 54.2% in five years, the value of 2.1 regression, that very little dispersion value the level of disclosure in the years that international financial reporting standards applied IFRS this agree with (Adwan, 2016) , paragraphs on disclosure of financial information and has been positive, and gradient 8.4, note the high percentage of disclosure, Rose to 74% after it was 46% in 2012 and 2013, and rose slightly in the year 2014, 2015 and 2016 years total vertebrae disclosed and is a positive indicator that the Bank committed itself to applying international financial reporting standards IFRSs for fiscal years 2015 and 2016, which was based on commercial Bank of Iraq guidance in applying these standards. As well as the obligation to disclose the second paragraphs if disclosure rate is positive and 63.6%, value gradient was 2.7 to increase the proportion of high-rate disclosure rate in the years 2015 and 2016. The third indicator only the average percentage of disclosure of equity structure indicators to 54.2% in five years, the value of 2.1 regression, that very little dispersion value the level of disclosure in the years that international financial reporting standards applied IFRS.
The average ratio was calculated to disclose the entire regression coefficient index, each bank for a period of five years as in the Tables below:
Table 9 Show regression coefficient for each indicator for Investment Bank of Iraq. Observed that the average percentage of disclosure of financial information in the first shows, was down by 44.4% in the Investment Bank of Iraq, and gradient 69%, a high value represents the factors led to reduced disclosure in cents Win 2012 and 2013 and 2014 year 40% disclosure rate became, and any note the high proportion of disclosure in the years 2015 and 2016 as a result of the application of international financial reporting standards, rose to 57% after it was 40% and is a positive indicator that the Bank is committed to applying the international financial reporting standards IFRSs to 2015 and 2016, which was based on the Iraqi Central Bank instructions and guidance on the application of these standards and is which explains the increased value regression.
With regard to the disclosure of the second vertebra were positive but low disclosure rate and the value of 53.2, regression value were few 3, due to increased disclosure rate low rate in the years 2015 and 2016. The third indicator only characterized by the steady rate of disclosure for five years and unchanged a few regression values was positive, and not affected by the disclosure paragraphs third indicator execution of Central Bank of Iraq instructions IFRSs.
Table 10 regression coefficient for each indicator for Commercial Bank Of Iraq Observed that your average disclosure low but positive, gradient 6, Observed the high rate of disclosure, up to 54% after they were 34% and is a positive indicator that, the Bank committed to applying international financial reporting standards IFRSs for fiscal years 2015 and 2016, which was based on the Iraqi Central Bank instructions and guidance on the application of these standards.
As well as the obligation to disclose the second vertebrae as she was positive but low disclosure rate and the value of 49.8, positive slope value 0.6 to increase disclosure by a low rate in the years 2015 and 2016. The third indicator only describe by the steady rate of disclosure for five years and unchanged 0.6 decline was positive, not affected by the disclosure paragraphs third indicator Central Bank of Iraq instructions apply IFRSs for the years 2015 and 2016.
Table 11 regression coefficient for each indicator for AL-Mansour Bank for Investment, observe that your average disclosure positive and positive gradient 0.6, note the high percentage of disclosure, up to 51% after it was 49% in the three years (2012, 2013 and 2014).
It is a positive indicator that the Bank is committed to applying the international financial reporting standards IFRSs for fiscal years 2015 and 2016, which was based on the Iraqi Central Bank instructions and guidance on the application of these standards.
As well as the obligation to disclose the second item, remained stable over the years and was a low rate of disclosure , the value of 39, and the regression value were positive 0.6, the third indicator only characterized by steady rate of disclosure for the first three years and disclosure rate change for the years 2015 and 2016 were 54 While a positive slope value was 2.7 and the proportion of the disclosure paragraphs third indicator as a result of the Bank's commitment to the Iraqi Central Bank directives apply IFRSs.
In Tables 12 and 13, the researcher used the Bartov model to measure the appropriateness of accounting information by using information ability of earnings and book value of equity to interpret and analyze transactions for regression equation, Tables 12 & 13 stock prices will be determined by Use the form above, the higher the capacity, the more appropriate accounting data, because users are able to make better investment decisions, In addition, the change in the relevant of financial statements prepared on International Financial Reporting Standards (IFRS), the period after application of the International Financial Reporting Standards (2015-2016), is disclosed by the dummy variable.
| Table 12: Regression Equation For The Five Banks | ||||||
| Name of Company | A0 | A1 | A2 | A3 | A4 | A5 |
| Iraqi Middle East investment bank | 3.01 | 0.02 | 0.28 | 6.53 | 5.23 | 5.88 |
| Credit Bank of Iraq | -189.59 | -500.84 | 2330.48 | -256.51 | 2331.45 | -1293.98 |
| Investment Bank of Iraq | 2.38 | 21.42 | 2.94 | 1.41 | -16.23 | -7.41 |
| Commercial Bank Of Iraq | 2.16 | 5.38 | 1.44 | -9.25 | 11.06 | 0.91 |
| AL-Mansour Bank for Investment | 5.97 | 24.2 | 1.97 | 0.94 | -3.23 | -1.14 |
Specifically, for the post-adoption period, the book value of equity transactions (a2) and (a4) profit transactions (a3) and (a5) thus, if transactions a4 and a5 are positive (negative) and statistically significant, it means that the importance of the book value of shares and profits, respectively, the largest in the period after adoption. The researcher notes that the book value of transactions of Middle East Bank was a2, a4 is positive while profit transactions value a3, a5 were positive, and this is caused by the application of IFRS in the Bank for the years 2015 and 2016.
While the book value of equity transactions credit Bank of Iraq of a2, a4 which was increased, while the value of each of the a3, a5 negative profit transactions to lower net profits for the years search sample. While the book value of equity transactions, Investment Bank of Iraq of a2, a4 a2 was positive, while negative a4 value, while the value of transactions, which the a5 and a3 profit negative for lower net profits for the years search sample. This agree with, (Jahmani et al., 2017) .
Could be due the book value of the stock Commercial bank of Iraq of a2, a4 were positive, while the value of a3, a5 value negative, negative and low net profits to search sample years. Book value of transactions were shares of investment bank Mansur a2 were positive and negative a4 value, while the value of transactions whereby the a3 and a5 value profit is negative for low net profits to search sample years.
Testing of Hypotheses
After measuring the sample banks study commitment S&P indicators, you can test Was found that four banks (Investment Bank of Iraq, Mansur Investment Bank Middle East Bank, commercial bank of Iraq) the arithmetic mean of the disclosure shows indicators less than 50% of all disclosure indicators according to S&P, while the Iraqi only bank credit Bank got More than 50% of disclosure level, so rejects the hypothesis of the three banks and accept the bank Iraqi bank credit.
By measuring the degree of disclosure in banks for five years, it was noted that the degree of disclosure is not reflected in the relevant of accounting information, but other factors that effect of accounting information relevant, such as book value, market value of shares and profits achieved.
Discussion
When measuring banks 'compliance with Standards and Poor's' standards to disclose all information related to S&P indicators, the researcher found that most banks did not comply adequately with these indicators, especially in the first three years (2012, 2013 and 2014) (2015 and 2016) improved slightly in the disclosure due to the application of International Financial Reporting Standards (IFRSs), this agree with Adwan, 2016, and when measuring the relevant of the value of the accounting information for the same banks for the same period, the researcher found that the relevant was not affected by the level of disclosure according to S&P indicators; This is Conflicts with opinion Pervan & Bartulovi? (2012), and agree with Hung et al. (2018). Accounting information is the market price The value of the shares, the book value of the shares, the level of profits realized. On the basis of which decisions are made by investors and other parties that deal with companies, which is consistent with the study (Olugbenga & Adewale, 2014), Bookings per share, dividends per share, show a significant impact on stock price fluctuations. However, dividend per share shows the most sensitive variables with stock price volatility for manufacturing companies in Nigeria. Which affects the relevant of the value of accounting information? As well as the study (Sutopo et al., 2018) , which indicated that earnings per share is very important EPS, which shows that the importance of the book value of the BVPS share of the selected companies has a significant impact on the quality and relevance of accounting information for decision making.
This agrees with, (UNCTAD, 2017), which focus on the importance of disclosing accounting information in risk assessment and providing it to enhance corporate governance and decision making principles (Kengen, 2016) , assessed the quality of disclosure and its impact on the quality of accounting information and excluded other factors such as the market value of shares or The profits achieved affect the relevant of accounting information in decision making. This agrees with (Park, 2015) , the market value of shares plays a significant role in the appropriateness of accounting information. The current study findings, this agree with Hellman et al., 2018, agreed that the application of financial reporting standards and accounting standards should play a role in enhancing the quality of disclosure and its requirements. This agrees with, (Irsath et al., 2015), agrees with in his study that there is an effect on the value of stocks in the appropriateness of accounting information than any other factor.
Market value is the most important and fundamental factor for making investment decisions. While (Ahmadpour & Amin, 2015) found a negative relationship between the changes in the appropriateness of the accounting information and the size of the company and the positive relationship between the changes in the value of accounting information and the company's growth which is consistent with the results of the current study. . It is consistent with the findings of the current article. As many factors affect the value of relevance accounting information such as stock distributions, market capitalization As well as the application of international financial reporting standards, Which is consistent with the studies. (Khanagha & Omokhudu, 2011), and (Okoeguale, 2015).
Conclusion
Was reached that she committed banks with Standards and Poor's' standards to disclose all information related to S&P indicators, was found that most banks Not fully disclosed with these indicators, especially in the first three years (2012, 2013 and 2014) (2015 and 2016) improved slightly in the disclosure due to the application of International Financial Reporting Standards (IFRSs), and when measuring the relevant of accounting information for the same banks and same period.
Recommendations
In the light of the findings of the research, All listed companies in the Iraqi Stock Exchange must apply S&P's disclosure criteria in a transparent manner for all information related to financial performance as it is reflected on the quality of accounting information and enhancing the relevant of decision making. Because it leads to increased investments and increased market share of companies.
As well as preparing the researches and studies that lead to the development of the ability of accountants to apply S&P disclosure indicators because of their impact on the quality of accounting information and increase their ability to provide appropriate information for decision making by existing and potential investors
Appendix
| Appendix 1 : Standards And Poor’s Ratings For Transparency And Disclosure | |
| 1. Financial transparency & information disclosure | |
| No | Items |
| 1 | Its accounting policy. |
| 2 | The accounting standards it uses for its accounts? |
| 3 | Accounts according to the local accounting standards. |
| 4 | Accounts according to an internationally recognized accounting standard (IAS/U.S.GAAP)? |
| 5 | Its balance sheet according to international accounting standard (IAS/U.S. GAAP)? |
| 6 | Its income statement according to international accounting standard (IAS/U.S. GAAP)? |
| 7 | Its cash flow statement according to international accounting standard (IAS/U.S.GAAP)? |
| 8 | A basic earnings forecast of any kind. |
| 9 | A detailed earnings forecast. |
| 10 | Financial information on a quarterly basis. |
| 11 | A segment analysis (broken down by business line)? |
| 12 | The name of its auditing firm. |
| 13 | A reproduction of the auditors' report? |
| 14 | How much it pays in audit fees to the auditor. |
| 15 | Any non-audit fees paid to auditor. |
| 16 | Consolidated financial statements (or only the parent/holding co)? |
| 17 | Methods of asset valuation? |
| 18 | Information on method of fixed assets depreciation. |
| 19 | A list of affiliates in which it holds a minority stake. |
| 20 | A reconciliation of its domestic accounting standards to IAS/U.S. GAAP |
| 21 | The ownership structure of affiliates. |
| 22 | Details of the kind of business it is in. |
| 23 | Details of the products or services produced/provided |
| 24 | Output in physical terms? (number of users etc. |
| 25 | Characteristics of assets employed? |
| 26 | Efficiency indicators (ROA ROE etc.). |
| 27 | Any industry-specific ratios. |
| 28 | A discussion of corporate strategy. |
| 29 | Any plans for investment in the coming year(s)? |
| 30 | Detailed information about investment plans in the coming year(s)? |
| 31 | An output forecast of any kind? |
| 32 | An overview of trends in its industry? |
| 33 | Its market share for any or all of its businesses. |
| 34 | A list/register of related party transactions. |
| 35 | A list/register of group transactions. |
| 2. Board and management structure and process | |
| 1 | A list of board members (names)? |
| 2 | Details about directors (other than name/title)? |
| 3 | Details about current employment/position of directors provided? |
| 4 | Details about previous employment/positions provided? |
| 5 | When each of the directors joined the board? |
| 6 | Classification of directors as an executive or an outside director. |
| 7 | A named chairman listed. |
| 8 | Detail about the chairman (other than name/title)? |
| 9 | Details about role of the board of directors at the company? |
| 10 | A list of matters reserved for the board. |
| 11 | A list of board committees. |
| 12 | The existence of an audit committee. |
| 13 | The names on the audit committee. |
| 14 | The existence of a remuneration/compensation committee? |
| 15 | The names on the remuneration/compensation committee)? |
| 16 | Existence of a nomination committee? |
| 17 | The names on the nomination committee? |
| 18 | The existence of other internal audit functions besides the Audit Committee. |
| 19 | The existence of a strategy/investment/finance committee? |
| 20 | The number of shares in the company held by directors? |
| 21 | A review of the last board meeting? (e.g. minutes). |
| 22 | Whether they provide director training? |
| 23 | The decision-making process of directors' pay? |
| 24 | The specifics of directors' pay (e.g. the salary levels etc.)? |
| 25 | The form of directors' salaries (e.g. cash, shares, etc.)? |
| 26 | The specifics on performance-related pay for directors? |
| 27 | The decision-making of managers' (not Board) pay? |
| 28 | The specifics of managers' (not on Board) pay (e.g. salary levels etc.)? |
| 29 | The form of managers' (not on Board) pays? |
| 30 | The specifics on performance-related pay for managers? |
| 31 | The list of the senior managers (not on the Board of Directors)? |
| 32 | The backgrounds of senior managers disclosed? |
| 33 | The details of the CEO's contract disclosed? |
| 34 | The number of shares held by the senior managers disclosed |
| 35 | The number of shares held in other affiliated companies by managers? |
|
|
| 1 | Number of issued and outstanding ordinary shares disclosed. |
| 2 | Number of issued and outstanding other shares disclosed (preferred, non-voting). |
| 3 | Par value of each ordinary share disclosed. |
| 4 | Par value of each other shares disclosed (preferred, non-voting). |
| 5 | Number of authorized but unissued & outstanding ordinary shares disclosed. |
| 6 | Number of authorized but unissued & outstanding other shares disclosed. |
| 7 | Par value of authorized but unissued & outstanding ordinary Shares disclosed. |
| 8 | Par value of authorized but unissued & outstanding other shares disclosed. |
| 9 | Top 1 shareholder. |
| 10 | Top 1 shareholder. |
| 11 | Top 5 shareholders. |
| 12 | Top 10 shareholders. |
| 13 | Description of share classes provided. |
| 14 | Review of shareholders by type. |
| 15 | Number and identity of shareholders holding more than 3%. |
| 16 | Number and identity of shareholders holding more than 5%. |
| 17 | Number and identity of shareholders holding more than 10%. |
| 18 | Percentage of cross-ownership? |
| 19 | Existence of a corporate governance charter or code of best practice. |
| 20 | Corporate Governance Charter/Code of Best Practice itself. |
| 21 | Details about its articles of association (e.g. changes). |
| 22 | Voting rights for each voting or non-voting share? |
| 23 | Way those shareholders nominate directors to board. |
| 24 | Way shareholders convene an EGM? |
| 25 | Procedure for putting inquiry rights to the board. |
| 26 | Procedure for putting proposals at shareholders meetings. |
| 27 | Review of last shareholders meeting (e.g. minutes). |
| 28 | Calendar of important shareholders dates. |
| Appendix 2 : Data Of Regression Equation | ||||||||
| No | Name of company |
Pit+6=Market share price at time |
Bvpsit Book value of equity per share | Eps Income (before Extraordinary items) per share |
Post=Dummy-variable equals to 1 for the period after the adoption of IAS and | |||
| 1 | Iraqi Middle East investment bank | |||||||
| Year 1 ( 2012) | 5.927 | 1.252 | 0.774 | 0 | ||||
| Year 2 ( 2013) | 2.531 | 1.352 | 0.258 | 0 | ||||
| Year 3 ( 2014) | 5.818 | 1.228 | 0.166 | 0 | ||||
| Year 4 ( 2015) | 6.268 | 1.108 | 0.325 | 1 | ||||
| Year 5 ( 2016) | 1.520 | 1.108 | 0.166 | 1 | ||||
| 2 | Credit Bank of Iraq | |||||||
| Year 1 ( 2012) | 134.88 | 1.755 | 14.510 | 0 | ||||
| Year 2 ( 2013) | 265.255 | 1.314 | 10.086 | 0 | ||||
| Year 3 ( 2014) | 14.795 | 1.161 | 0.903 | 0 | ||||
| Year 4 ( 2015) | 24.216 | 1.207 | 2.284 | 1 | ||||
| Year 5 ( 2016) | 16.305 | 1.227 | 0.55 | 1 | ||||
| 3 | Investment Bank of Iraq | |||||||
| Year 1 ( 2012) | 1.982 | 1.196 | 0.067 | 0 | ||||
| Year 2 ( 2013) | 2.762 | 1.202 | 0.492 | 0 | ||||
| Year 3 ( 2014) | 13.601 | 1.135 | 1.763 | 0 | ||||
| Year 4 ( 2015) | 15.565 | 1.125 | 1.910 | 1 | ||||
| Year 5 ( 2016) | 13.464 | 1.159 | 1.08 | 1 | ||||
| 4 | Commercial Bank Of Iraq | |||||||
| Year 1 ( 2012) | 10.363 | 1.432 | 1.078 | 0 | ||||
| Year 2 ( 2013) | 8.870 | 1.311 | 0.571 | 0 | ||||
| Year 3 ( 2014) | 16.965 | 1.138 | 1.076 | 0 | ||||
| Year 4 ( 2015) | 5.352 | 1.098 | 0.430 | 1 | ||||
| Year 5 ( 2016) | 3.066 | 1.128 | 0.217 | 1 | ||||
| 5 | AL-Mansour Bank for Investment | |||||||
| Year 1 ( 2012) | 28 | 1.061 | 1.34 | 0 | ||||
| Year 2 ( 2013) | 31 | 1.120 | 2.12 | 0 | ||||
| Year 3 ( 2014) | 18 | 1.127 | 1.74 | 0 | ||||
| Year 4 ( 2015) | 34 | 1.155 | 3.78 | 1 | ||||
| Year 5 ( 2016) | 19 | 1.150 | 1.31 | 1 | ||||
References
- Abdallah, A.A. (2013). The impact of using accounting information system on the quality of financial statements submitted to the income and sales tax department in Jordan. European Scientific Journal, 1, 1857-7431.
- Abhishek, G. (2013). International business environment: Challenges and changes. Research Journal of Management Sciences, 2(11), 34-38.
- Adwan, S. (2016). Value relevance of IFRS and the effect of the financial crisis: Evidence from European financial firms. Phd Thesis.
- Ahmadpour, A., & Amin, H.S. (2015). Changes in the value relevance of accounting information and identifying the factors affecting the value relevance. The Iranian Accounting and Auditing Review, 22(1).
- Arsov, S., & Bucevska, V. (2017). Determinants of transparency and disclosure evidence from post-transition economies, Economic Research-Ekonomska Istra?ivanja, 30(1), 745-760.
- Bartov, E., Goldberg, S.R., & Kim, M.S. (2005). Comparative value relevance among German, U.S., and international accounting standards: A German stock market perspective. Journal of Accounting, Auditing and Finance, 20(2), 95-119.
- Beisland, L.A. (2010). Is the value relevance of accounting information consistently underestimated? The Open Business Journal, 3.
- Brimble, M.A. (2003). The relevance of accounting information for valuation and risk. PhD Thesis.
- Bushman, R.M., Piotroski, J.D., & Smith, A.J. (2004). What determines corporate transparency? Journal of Accounting Research, 42(2).
- Camodeca, R., Almici, A., & Brivio, A.R. (2014). The value relevance of accounting information in the Italian and UK stock markets. Problems and Perspectives in Management, 12(4-2), 512-519
- Carpenter, M.A., & Dunung, S.P. (2013). Challenges and opportunities in international business. Andy Schmitz, 1, 794-795.
- Chand, P., Patel, C., & Day, R. (2008). Factors causing differences in the reporting practices in selected south pacific countries in the post-convergence period. Asian Academy of Management Journal, 13(2), 111-129.
- Cheng, L., & Liao, S. (2013). The commitment effect versus information effect of disclosure: Evidence from smaller reporting companies. The Accounting review American Accounting Association, 88(4), 1239-1263.
- Drivdal, B. (2015). Transparency and the sustainability reporting practice of Norwegian Companies. Master Thesis.
- Edeigba, J., & Amenkhienan, F. (2017). The influence of IFRS adoption on corporate transparency and accountability: Evidence from New Zealand. Australasian Accounting, Business and Finance Journal, 11(3).
- Enofe, A.O., Asiriuwa, O., & Ashafoke, T.O. (2014). Value relevance of accounting information in the banking subsector of the Nigeria stock exchange (NSE). British Journal of Accounting, Auditing and Finance Research, 1(1), 42-55.
- Frank, B.G., & Thomas, H. (2004). On the value of transparency in agencies with renegotiation. Journal of Accounting Research, 42(5), 871.
- Fung, B. (2014). The demand and need for transparency and disclosure in corporate governance. Universal Journal of Management, 2(2), 72-80.
- Gibbins, M., Richardson, A., & Waterhouse, J. (1990). The management of corporate financial disclosure: opportunism, ritualism, policies, and processes. Journal of Accounting Research, 28(1), 121-143.
- Hassan, O., & Marston, C. (2010). Disclosure measurement in the empirical accounting literature a review article. Working Paper.
- Hellman, N., Carenys, J., & Gutierrez, S.M. (2018). Introducing more IFRS principles of disclosures: Will the poor disclosers improve? Version: November. Journal Accounting in Europa, 15(2), 242-321.
- Hung, D.N., Vietha, H.T., & Binh, D.T. (2018). Impact of accounting information on financial statements to the stock price of the energy enterprises listed on Vietnam’s stock market. International Journal of Energy Economics and Policy, 8(2), 1-6.
- Irsath, Y.M., Haleem, A., & Ahamed, S.T. (2015). Value relevance of accounting information and stock price reaction of listed companies empirical evidence from the Colombo stock exchange. 32 serilanka, 5th International Symposium -Int Sym.
- Jahmani, Y., Choi, H.Y., Park, Y., & Wu, G.J. (2017). The value relevance of author comprehensive invoice and its components. Accounting & Taxation, 9(1), 1-11.
- Kengen, B.A. (2016). The significance of the transparency benchmark on sustainability reporting in the Netherlands. MSc Thesis..
- Khanagha, J.B. (2011). Value relevance of accounting information in the United Arab Emirates. International Journal of Economics and Financial Issues, 1(2), 33-45.
- Khanna, T., Palepu, K.G., & Srinivasan, S. (2004). Disclosure practices of foreign companies interacting with U.S. Markets. Journal of Accounting Research, 42(2), 475-508.
- Klinsukhon, S. (2016). Accounting information transparency and decision making effectiveness: Evidence from financial businesses in Thailand, The Business and Management Review, 7(5), 112-120.
- Kousenidis, D.V., Ladas, A.C., & Negakis, C.I. (2010). Value relevance of accounting information in the Pre- and Post-IFRS accounting periods. European Research Studies Journal, European Research Studies Journal, 1, 143-152.
- Kythreotis, A. (2014). Measurement of financial reporting, quality based on IFRS conceptual framework's fundamental qualitative characteristics. European Journal of Accounting, Finance, and Business, 2(3).
- lepadatu, G.V., & Pirnau, M. (2009). Transparency in financial statements (IAS/IFRS). European Research Studies, 12(1).
- Morley, J. (2011). Sequences of change in financial reporting: The influence of financial economics. PhD Thesis.
- Olugbenga. A.A., & Adewale, O. (2014). Value relevance of financial accounting information of quoted companies in Nigeria: A trend analysis. Research Journal of Finance and Accounting, 5(8), 86-94.
- Omokhudu, O., & Okoeguale, I.P. (2015). The value relevance of accounting information: Evidence from Nigeria. Accounting and Finance Research, 4(3), 20-30.
- Park, C. (2015). The stock price relevance of accounting information according to business cycle and industries, scientific cooperation's. International Journal of Finance, Business, Economics, Marketing and Information Systems, 1(1), 23-24.
- Pervan, I., & Bartulovi?, M. (2012). Impact of transparency level on the value relevance of accounting information: empirical analysis for SEE countries. International Journal of Mathematical Models and Methods in Applied Sciences, 6(8), 955-962.
- Prihatni, R., Subroto, B., Saraswati, E., & Purnomosidi, B. (2018). Comparative value relevance of accounting information in the IFRS period between manufacturing company and financial services go public in Indonesia stock exchange. Academy of Accounting and Financial Studies Journal, 22(3).
- Ring, D. (2014). Transparency and Disclosure. Papers on Selected Topics in Protecting the Tax Base of Developing Countries.
- Ryan, J. (2012). The negative impact of credit rating agencies and proposals for better regulations. Working Paper.
- Sullivanl, K. (2005). Transparency in Central Bank financial statement disclosures. International Monetary Fund.
- Sutopo, B., Sebastian, K., Adiati, A.K., & Ardila. L.N. (2018). Sustainability reporting and value relevance of financial statements. Sustainability, 10(3), 1-24.
- Taouab, O. (2016). Comparative value relevance among domestic accounting standards and IFRS: A Moroccan stock market perspective. Journal of Accounting and Auditing: Research & Practice, 1-10.
- UNCTADS. (2017). Trade and development board investment, enterprise and development commission. Intergovernmental Working Group of Experts on International Standards of Accounting and Reporting Thirty, Geneva.
- Vijitha, P., & Nimalathasan, B. (2014). Value relevance of accounting information and share price: A study of listed manufacturing companies in SriLanka. Merit Research Journal of Business and Management, 2(1), 001-006.
- Wina, W.I., & Wirama, D.G. (2018). The effect of accounting conservation on the value relevance of accounting information: Evidence from Indonesia. European Journal of Business and Social Sciences, 6(12), 34-46.
- Zulu, M., Oberholster, J.G., & Klerk, M.D. (2017). A comparison of the value relevance of interim and annual financial statements. South African Journal of Economic and Management Sciences, 20(1).