Research Article: 2019 Vol: 22 Issue: 2
Relationship Between Capital Structure and Profitability: Evidence from Four Asian Tigers
Chong-Chuo Chang, National Chi Nan University
Munkh-Ulzii Batmunkh, National University of Mongolia
Wing-Keung Wong, Asia University
Munkhchimeg Jargalsaikhan, Asia University
Citation Information: Chang, C.C., Batmunkh, M.U., Wong, W.K., & Jargalsaikhan, M. (2019). Relationship between capital structure and profitability: Evidence from Four Asian Tigers. Journal of Management Information and Decision Sciences, 22(2), 54-65
Abstract
Purpose: Capital structure is one of the hot topics in corporate finance. To meet the needs of stakeholders, firms need to build a capital structure that is desirable for shareholders by decrease financial risk and expand their profitability. Thus, the aim of this study is to investigate the relationship between capital structure and profitability.
Methods: In examining the relationship between capital structure and profitability, we apply correlation and regression analysis on dataset from 2003 to 2016 for the firms in the Four Asian Tiger economies. The data are collected from the Compustat Global Vantage database and include 46,301 observations.
Findings: This study finds a significantly negative relationship between leverage and profitability, a significantly positive relationship between growth and leverage in Taiwan, Korea and Hong Kong and a significantly positive relationship between size and leverage in each country.
Significance of the study: This study empirically examines the impacts of capital structure on the profitability in the case of firms of Four Asian Tiger economies, which appears to be main contribution to the literature of corporate finance.
Keywords
Capital Structure, Financial Leverage, Profitability, Four Asian Tigers.
Introduction
directors have higher risk than non-politically connected firms. There are several reasons behind this argument: highly political connected firms became more
In recent decades, capital structure has become one of the most interesting topics in corporate finance literature. Capital structure theories, such as trade-off theory, pecking order theory and market timing theory, have been developed to explain capital structure. Capital structure or financial structure, defined as the specific mix of debt and equity a firm uses to finance its operations, is the means by which an organization is financed. The capital structure of a firm is a mixture of different securities. In general, firms can choose among several alternative capital structures. They can arrange lease financing, issue a large or small amount of debt, sign forward contracts, or trade bond swaps. Firms can also issue dozens of distinct securities in combinations; however, more often, they endeavor to find a particular combination that minimizes their cost of capital, thereby maximizing firm value (Abor, 2005).
The capital structure is the amalgamation of debt and equity that an entity utilizes to fund its operations. One of the parameters to measure the capital structure is debt ratio. Generally, it is a ratio between total debt and liability and total asset. However, it is still a good benchmark to capital structure, studies also suggest not to rely on a single measurement as the proxy for capital structure, as it may lead to incorrect conclusions about the capital structure of the firm. Thus, it is common among the previous studies to use combination of total debt to total assets, short-term debt to total assets and long-term debt to total assets to represent the capital structure (Abor, 2005; Chen et al., 2016).
The capital structure of a firm is critical because it is related to the ability of the firm to meet the needs of its stakeholders. The board of directors or the financial manager of a company should always strive to develop a capital structure that is beneficial to the equity shareholders, in particular, as well as to other stakeholders, such as employees, customers, creditors and society in general (Pandey, 2004). In other words, financial managers should use capital structure to decrease financial risk and expand their profitability. Generating value and maximizing stockholder wealth perpetually are the most important objectives of firms (Flannery & Rangan, 2006).
The theory of capital structure was originally developed by Modigliani & Miller (1958). The shift of firm’s focus on capital structure began in the late 1950s with studies by Modigliani & Miller (1958). Although they initially suggest that in the perfect capital market, financing strategies do not affect firm value, they later argue that firm value can be increased by changing the capital structure because of the tax advantage of debt (Modigliani & Miller, 1963).
The trade-off theory considers that firms have a target capital structure that is determined by the marginal benefits of debt, for example, tax advantages and bankruptcy and agency costs (Myers, 1984). In other words, the trade-off theory implies that firms adjust their capital structure in response to the temporary shocks that cause their leverage to deviate from the target (Hsu & Hsu, 2011).
The pecking order theory is based on asymmetrical information (Myers & Majluf, 1984; Myers, 1984). When a manager decides to finance the firm through external funds, investors tend to interpret this behavior as overvaluing the firm. Therefore, they become inclined to sell their stocks, causing the firm value to fall. Thus, firms follow a financing hierarchy to anticipate such contingencies, from internal funds to debt and finally, to external equity (Hsu & Hsu, 2011).
The market timing theory of capital structure, which was first introduced by Baker & Wurgler (2002), proposes a different view on capital structure. The market timing theory suggests that managers are able to identify certain time periods during which equity issuance is less costly due to the high valuation of the company stock. This means that firms are more likely to issue equity when their market values are high, relative to book and post-market values and repurchase equity when their market values are low. Therefore, a firm’s current capital structure is strongly related to historical market values. This statement suggests the theory that capital structure is the cumulative outcome of past attempts to time the equity market.
However, Alti (2006) and Kayhan & Titman (2007) disagree with Baker & Wurgler (2002) on the persistence of the effect of market timing on capital structure because the importance of historical average market-to-book ratios in leverage regressions does not influence the past equity market timing. Kayhan & Titman (2007) note that the significance of the historical market-to-book series in leverage regressions may be due to the noise in the current market-to-book ratio. Specifically, Kayhan & Titman (2007) decompose the external finance weighted-average market-to-book ratio into the mean market-to-book ratio, the covariance between the market-to-book ratios and the financing deficit.
According to literature of corporate finance, the relationship between capital structure and profitability is still a debatable issue.
Danis et al. (2014) examine relationship between profitability and capital structure using quarterly data of unregulated and non-financial firms in Compustat database. They find that cross-sectional correlation between profitability and leverage is positive when firms are at an optimal level of leverage, otherwise negative.
Nhung & Okuda (2015) measure effects of leverage on profitability using debt ratio and return rates of listed companies on stock exchanges of Vietnam. They find that an increase in debt ratios lead to a decrease in profitability.
Hamid et al. (2015) examine the influence of capital structure on profitability by using short-term debt ratio, long-term debt ratio, debt ratio and return on equity data for 92 listed firms on Bursa Malaysia. Their find significantly negative relationship between debt ratio and profitability.
Using panel data of non-financial companies that listed in the Nigerian Stock Exchange Oino & Ukaegbu (2015) test the impacts of capital structure on performance. This study finds that profitability and capital structure are negatively related to leverage, whereas relationship between size of the firm and no-debt tax finds positive.
Chen et al. (2019) find that operating leverage generates a negative relation between profitability and financial leverage. They used annual Compustat industrial data of firms with positive total assets and sales with time period from 1963 to 2016.
Hong Kong, South Korea (Korea), Singapore and Taiwan clearly have been amongst the fastest growing economies in the world for the past fifty years, which has led to a swift income convergence with the industrialized world. Their successful emergence to the world stage has sparked considerable interest of growth economists.
According to Wikipedia, the Four Asian Tigers refer to the highly developed economies of Hong Kong, Singapore, Korea and Taiwan. These are the first industrialized countries in the region and are known for their extremely high growth rates and rapid industrialization between the early 1960s and 1990s. All Four countries have become wealthy, with a highly educated, expert workforce. These economies have also focused on specific fields, attempting to become global leaders in their respective areas. For example, Hong Kong and Singapore are experts in international finance, whereas Korea and Taiwan are leaders in information technology. Increased competition and international trade have resulted in rapid economic expansion of the Four Asian Tigers.
Table 1 shows the average annual growth rates of GDP for the Four Asian Tiger economies. The average GDP growth for all the Four countries peaked in 2011 and decreased in 2012.
| Table 1: Real Gdp Of The Four Asian Tiger Economies | ||||||
| Average annual GDP growth (%) | ||||||
| 2011 | 2012 | 2013 | 2014 | 2015 | 2016 | |
| Hong Kong | 4.8 | 1.7 | 3.1 | 2.8 | 2.4 | 2.1 |
| Korea | 3.7 | 2.3 | 2.9 | 3.3 | 2.8 | 2.8 |
| Singapore | 6.2 | 3.9 | 5.0 | 3.6 | 1.9 | 2.0 |
| Taiwan | 3.8 | 2.0 | 2.2 | 4.0 | 0.8 | 1.4 |
Source: The World Bank
Table 2 shows the area, population, capital and human development index of the Four Asian Tiger economies.
| Table 2: Demographics Of The Four Asian Tiger Economies | ||||
| Country or territory | Hong Kong | Singapore | Korea | Taiwan |
| Area (km2) | 1,104 | 718 | 100,210 | 36,193 |
| Population | 7,234,800 | 5,469,700 | 52,302,044 | 23,373,517 |
| Population density (per km2) | 6,544 | 7,615 | 490 | 644 |
| Human Development Index (2016) | 0.917(12th) | 0.925(5th) | 0.901(18th) | 0.885(26th) |
| Capital | Hong Kong | Singapore | Seoul | Taipei |
Table 3 shows the nominal GDP, trade, exports and imports for the Four Asian Tiger economies.
| Table 3: Economic Indicators Of The Four Asian Tiger Economies | ||||
| Country or territory | Hong Kong | Singapore | Korea | Taiwan |
| GDP nominal millions of USD (2016) | 320,668 | 296,967 | 1,411,246 | 528,550 |
| GDP PPP millions of USD (2016) | 400,400 | 454,300 | 1,832,100 | 1,078,800 |
| GDP nominal per capital USD (2016) | 43,736 | 55,243 | 27,539 | 22,561 |
| GDP PPP per capital USD (2016) | 56,878 | 83,066 | 35,379 | 46,036 |
| GDP real millions of USD (2016) Trade % GDP |
269,812 (372.62%) |
294,946 (318.42%) |
1,304,658 (77.68%) |
530,608 (158.12%) |
| Trade millions of USD (2016) | 973,900 | 820,000 | 1,039,000 | 839,000 |
| Exports millions of USD (2016) | 516,588 | 329,871 | 495,418 | 314,800 |
| Imports millions of USD (2016) | 547,124 | 283,009 | 406,182 | 230,900 |
The main objective of this paper, therefore, is to empirically investigate the impact of capital structure on the profitability of the Four Asian Tigers-Hong Kong, Taiwan, Singapore and Korea. These countries are known for maintaining high growth rates and rapid industrialization. The remainder of this paper is organized as follows: Section 2 describes the data and methodology; Section 3 presents the main results; the findings are summarized in Section 4.
Data And Methodology
Data
This study examines the relationship between capital structure and profitability for listed firms in the Four Asian Tiger economies. The sample data used in the study covers 14 years, from 2003 through 2016. The financial industry (SIC codes in the range of 6000-6999) and the utility industry (SIC codes in the range of 4900-4999) are excluded because of regulatory restrictions and differences in industrial characteristics from other industries. The all financial data are collected from the Compustat Global Vantage database. The analysis in this study involves three statistical techniques: descriptive statistics, correlation coefficients and regression analysis. The final sample comprises 4 countries, 5,112 firms and 46,301 firm-year observations.
Measurements of variables
Dependent variable:
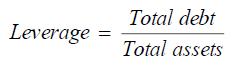
The dependent variable in this study is the leverage ratio. Leverage is the amount of debt a firm uses to finance its assets. In order word, leverage is an investment strategy of using borrowed capital to increase the potential return of an investment (Philippas et al., 2019).
Leverage
The leverage ratio is computed by dividing the total debt of a firm by its total assets and can be expressed as follows:
Independent variables
The explanatory independent variables in this thesis are profitability, size, growth and tangibility. Profitability is, also known as the financial performance, closely related to the capital structure of a firm. Studies find that debt financing is helpful to enhance performance of a firm. ROA and ROE are main benchmarks of how profitable a company is relative to its total assets. This study uses ROA to measure a firm`s profitability. Moreover, we employ firm size as a proxy for the market’s awareness of the company. The higher society’s awareness of the company is, the lower the information asymmetry between the company and its external creditors. This reduces agency costs and the company will tend to be able to increase its debt more easily. Tangibility is an asset that has a physical form. Finally, a growth firm is any company whose business generates significant positive cash flows or earnings, which increase at significantly faster rates than the overall economy (Amran & Ahmad, 2011; Qiao & Wong, 2015; Niu et al., 2018).
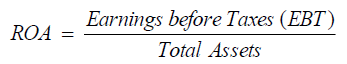
Profitability:
We use return on assets (ROA) as a proxy for profitability.
Size:
The measure of size is the natural logarithm of total assets.
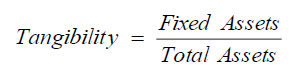
Tangibility:
Tangibility is measured as the ratio of tangible fixed assets to total assets.
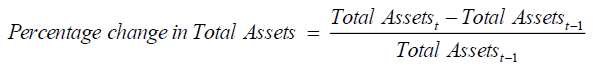
Growth:
The growth of the firm is measured by calculating the percentage change in total assets.
Regression model
Among studies in corporate finance, it is common to use pooled ordinary least squares (OLS) methods along with other approaches to estimate relationships between capital structure and profitability (Nhung & Okuda, 2015; Hamid et al., 2015; Chen et al., 2019). In examining relationship between profitability and capital structure Danis et al. (2014) use pooled OLS model on quarterly data, where leverage is the dependent variable. Furthermore, Oino & Ukaegbu (2015) use pooled OLS approach on panel data to test the impacts of capital structure on performance.
Thus, this study employs the following pooled OLS regression models to examine the impact of profitability on leverage:
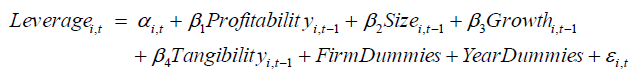
where α is the intercept of the equation, β’s are coefficients for independent variables, Leverage is the ratio of total debt to total assets, Profitability is the ratio of the net income before interest and tax divided by total assets, Size is the natural logarithm of total assets, Growth is the percentage change in the book value of total assets and Tangibility is the ratio of fixed assets to total assets.
Empirical Results
In this study, descriptive statistics, correlation analysis and regression analysis are used to investigate the impact of capital structure on profitability.
Descriptive Analysis
Table 4 presents the collective descriptive analysis of data on the Four Asian Tigers - Taiwan, Korea, Singapore and Hong Kong. The mean, median, maximum, minimum and standard deviation values of the different variables are given below. The data used for the analysis includes 46,301 observations over a 14-year period (2003 to 2016).
| Table 4: Descriptive Statistics: Four Asian Tigers | ||||||
| Variables | Mean | Median | Maximum | Minimum | Standard Deviation | Observations |
| Leverage | 0.4449 | 0.4432 | 1.5706 | 0.0077 | 0.1998 | 46,301 |
| Profitability | 0.0312 | 0.0418 | 0.3992 | -1.3008 | 0.1184 | 46,301 |
| Size | 6.4972 | 6.4381 | 13.7561 | 1.7454 | 2.2430 | 46,301 |
| Growth | 0.1176 | 0.0617 | 4.3377 | -0.6664 | 0.2947 | 46,301 |
| Tangibility | 0.2876 | 0.2729 | 0.9250 | 0.0001 | 0.1910 | 46,301 |
First, almost all variables have a positive mean, with the exception of profitability. The mean (median), maximum and minimum values of profitability are 3.12% (4.18%), 39.92% and -130.08%, respectively, with a standard deviation of 11.84%. Second, the average (median), maximum and minimum values of leverage are 44.49% (44.32%), 157.06% and 0.77%, respectively, with a standard deviation of 19.98%. Third, the average (median), maximum and minimum values of size are 6.4972 (6.4381), 13.7561 and 1.7454, respectively, with a standard deviation of 2.243. Fourth, the mean (median), maximum and minimum values of growth are 11.76% (6.17%), 433.77% and -66.64%, respectively, with a standard deviation of 29.47%. Finally, the mean (median), maximum and minimum values of tangibility are 28.76% (27.29%), 92.5% and 0.01%, respectively, with a standard deviation of 19.10%.
Table 5 presents the descriptive statistics of each of the Four Asian Tigers. Korean firms show the highest average leverage at 45.81%, followed by Singaporean firms at 45.28%, Taiwanese firms at 43.11% and Hong Kong firms with the lowest average leverage at 41.65%. In terms of profitability, Hong Kong firms appear to be the most profitable with a mean of 4.39%, followed by Taiwan and Singapore, with mean profitability of 4.35% and 3.7%, respectively. The least profitable firms of the Four Asian Tigers are Korean firms, with a mean profitability of 1.65%. The average sizes of Taiwan, Korea, Singapore and Hong Kong firms are 8.2991, 5.0712, 5.205 and 8.5795, respectively. The fastest growing firms were found to be in Hong Kong, with a 17.1% growth rate, followed by Singaporean firms with a growth rate of 15.81%, Korean firms with a growth rate of 12.96% and finally, Taiwanese firms with a growth rate of 8.18%. The average tangibility for Taiwan, Korea, Singapore and Hong Kong is 28.72%, 30.53%, 26.2% and 21.83%, respectively.
| Table 5: Descriptive Statistics: Four Asian Tigers | ||||||
| Variables | Mean | Median | Maximum | Minimum | Standard Deviation | Observations |
| Panel A. Taiwan | ||||||
| Leverage | 0.4311 | 0.4315 | 0.9527 | 0.0522 | 0.1795 | 17,726 |
| Profitability | 0.0435 | 0.0464 | 0.2876 | -0.4090 | 0.0905 | 17,726 |
| Size | 8.2991 | 8.0603 | 13.7561 | 5.3779 | 1.4875 | 17,726 |
| Growth | 0.0818 | 0.0453 | 1.3767 | -0.4194 | 0.2097 | 17,726 |
| Tangibility | 0.2872 | 0.2708 | 0.7871 | 0.0024 | 0.1807 | 17,726 |
| Panel B. Korea | ||||||
| Leverage | 0.4581 | 0.4585 | 0.9627 | 0.0577 | 0.2068 | 19,367 |
| Profitability | 0.0165 | 0.0340 | 0.2827 | -0.9375 | 0.1286 | 19,367 |
| Size | 5.0712 | 4.7413 | 10.6350 | 2.3103 | 1.5683 | 19,367 |
| Growth | 0.1296 | 0.0725 | 2.1341 | -0.5421 | 0.2890 | 19,367 |
| Tangibility | 0.3053 | 0.2999 | 0.7963 | 0.0033 | 0.1853 | 19,367 |
| Panel C. Singapore | ||||||
| Leverage | 0.4524 | 0.4499 | 1.5706 | 0.0433 | 0.2097 | 6,966 |
| Profitability | 0.0370 | 0.0524 | 0.3992 | -1.3008 | 0.1479 | 6,966 |
| Size | 5.2050 | 4.9759 | 10.6273 | 1.7454 | 1.6109 | 6,966 |
| Growth | 0.1581 | 0.0665 | 3.9302 | -0.6664 | 0.4201 | 6,966 |
| Tangibility | 0.2620 | 0.2183 | 0.8932 | 0.0002 | 0.2097 | 6,966 |
| Panel D. Hong Kong | ||||||
| Leverage | 0.4165 | 0.3758 | 1.1688 | 0.0077 | 0.2436 | 2,244 |
| Profitability | 0.0439 | 0.0498 | 0.3142 | -0.5751 | 0.1032 | 2,244 |
| Size | 8.5795 | 8.2495 | 13.6243 | 3.9152 | 2.0794 | 2,244 |
| Growth | 0.1710 | 0.0888 | 4.3377 | -0.6194 | 0.3968 | 2,244 |
| Tangibility | 0.2183 | 0.1382 | 0.9250 | 0.0001 | 0.2299 | 2,244 |
Panel A presents 17,726 observations on Taiwanese firms collected over 14 years. All variables have positive means and medians. Panel B presents 19,367 observations on Korean firms over the same coverage period. For Korean firms, profitability has a positive mean with a standard deviation of 0.1286. Panel C presents the data collected on Singaporean firms over the same coverage period, totaling 6,966 observations. The average profitability is 0.037 and the highest average size is 5.205, similar to the case in Korea. Panel D presents data on Hong Kong firms with 2,244 observations over the same coverage period. Size has a mean of 8.5795 and a standard deviation of 2.0794. Growth has a standard deviation at 0.3968, with a mean of 0.171.
Regression Analysis
Finally, regression analysis is conducted to estimate the relationship between capital structure and profitability for the sample firms of the Four Asian Tigers. The total number of observations is 46,301, representing the data obtained from 2003 to 2016. Regression analysis separately investigates the effect of profitability, size, growth and tangibility on the leverage of each country. Leverage is a dependent variable in the regression model and the other Four (profitability, size, growth and tangibility) variables are independent variables.
Table 6 shows the regression analysis results for the relationship between capital structure and profitability for all Four countries. The coefficient of profitability is negative with a value of -0.2574 at P-value<0.0001. Thus, profitability negatively affects leverage at a high significance level of 1%. If profitability decreases, leverage increase and vice versa.
| Table 6: Regression Analysis For The Relationship Between Capital Structure And Profitability: All Four Countries | ||||
| Independent | All four countries | |||
| Variables | Coefficient | P-value | Coefficient | P-value |
| Intercept | 0.4547*** | <0.0001 | 0.1201*** | <0.0001 |
| Profitability | -0.2574*** | <0.0001 | -0.2841*** | <0.0001 |
| Size | 0.0470*** | <0.0001 | ||
| Growth | 0.0259*** | <0.0001 | ||
| Tangibility | 0.0927*** | <0.0001 | ||
| Year Control | Included | Included | Included | Included |
| Firm Control | Included | Included | Included | Included |
| Adj-R2 | 0.7544 | 0.7650 | ||
| F-statistic | 24.69034*** | 26.15062*** | ||
| Observations | 46301 | 46301 | ||
Note: *10% significance level, **5% significance level, ***1% significance level.
Including the control variables, the coefficient of profitability is negative with -0.2841 at P-value<0.0001. This is significant at the 1% level. In other words, changes in profitability have a significant negative effect on leverage. The coefficient of growth is 0.0259 at P-value<0.0001. Thus, leverage is significantly negatively related to growth; increased growth increases leverage. Furthermore, a positive relationship between tangibility and leverage is determined with a coefficient of 0.0927 at a P-value<0.0001. The results imply that an increase or decrease in the firm’s tangibility significantly affects leverage. Finally, the coefficient of size is positive with 0.047 at P-value <0.0001.
Table 7 presents the results of the regression analysis of the relationship between capital structure and profitability for Taiwan. The coefficient of profitability is negative with -0.7202 at P-value<0.0001. Profitability negatively affects leverage, which is highly significant at the 1% level. If profitability decreases, leverage increases and vice versa, for Taiwan.
| Table 7: Regression Analysis For The Relationship Between Capital Structure And Profitability: Taiwan | ||||
| Independent | Taiwan | |||
| Variables | Coefficient | P-value | Coefficient | P-value |
| Intercept | 0.4542*** | <0.0001 | 0.0926*** | <0.0001 |
| Profitability | -0.5361*** | <0.0001 | -0.7202*** | <0.0001 |
| Size | 0.0460*** | <0.0001 | ||
| Growth | 0.1274*** | <0.0001 | ||
| Tangibility | -0.0787*** | <0.0001 | ||
| Year Control | Included | Included | Included | Included |
| Firm Control | Included | Included | Included | Included |
| Adj-R2 | 0.1876 | 0.3285 | ||
| F-statistic | 1.9135*** | 4.0471*** | ||
| Observations | 17724 | 17724 | ||
Note: *10% significance level, **5% significance level, ***1% significance level
Table 8 shows the results of the regression analysis of the relationship between capital structure and profitability for Korea. The result indicates that the coefficient of profitability is negative with -0.2468 at P-value<0.0001. Profitability negatively affects leverage, which is highly significant at the 1% level. If profitability decreases, leverage increases and vice versa, for Korea.
| Table 8: Regression Analysis For The Relationship Between Capital Structure And Profitability: Korea | ||||
| Independent | Korea | |||
| Variables | Coefficient | P-value | Coefficient | P-value |
| Intercept | 0.4666*** | <0.0001 | 0.1637*** | <0.0001 |
| Profitability | -0.2255*** | <0.0001 | -0.2468*** | <0.0001 |
| Size | 0.0538*** | <0.0001 | ||
| Growth | 0.0186*** | <0.0001 | ||
| Tangibility | 0.0909*** | <0.0001 | ||
| Year Control | Included | Included | Included | Included |
| Firm Control | Included | Included | Included | Included |
| Adj-R2 | 0.7536 | 0.7641 | ||
| F-statistic | 25.0671*** | 26.5115*** | ||
| Observations | 19367 | 19367 | ||
Note: *10% significance level, **5% significance level, ***1% significance level.
Table 9 shows the results of the regression analysis of the relationship between capital structure and profitability for Singapore. The coefficient of profitability is negative with -0.3159 at P-value<0.0001. Profitability negatively affects leverage, which is highly significant at the 1% level. If profitability decreases, leverage increases and vice versa, for Singapore.
| Table 9: Regression Analysis For The Relationship Between Capital Structure And Profitability: Singapore | ||||
| Independent | Singapore | |||
| Variables | Coefficient | P-value | Coefficient | P-value |
| Intercept | 0.4643*** | <0.0001 | 0.2382*** | <0.0001 |
| Profitability | -0.3036*** | <0.0001 | -0.3159*** | <0.0001 |
| Size | 0.0370*** | <0.0001 | ||
| Growth | 0.0071 | 0.1204 | ||
| Tangibility | 0.1239*** | <0.0001 | ||
| Year Control | Included | Included | Included | Included |
| Firm Control | Included | Included | Included | Included |
| Adj-R2 | 0.6574 | 0.6681 | ||
| F-statistic | 14.7264*** | 15.3829*** | ||
| Observations | 6966 | 6966 | ||
Note: *10% significance level, **5% significance level, ***1% significance level.
Table 10 shows the result of the regression analysis of the relationship between capital structure and profitability for Hong Kong. The coefficient of profitability is negative with -0.2696 at P-value<0.0001. Profitability negatively affects leverage. This finding is highly significant at the 1% level. If profitability decreases, leverage increases and vice versa, for Hong Kong.
| Table 10: Regression Analysis For The Relationship Between Capital Structure And Profitability: Hong Kong | ||||
| Independent | Hong Kong | |||
| Variables | Coefficient | P-value | Coefficient | P-value |
| Intercept | 0.4223*** | <0.0001 | 0.2903*** | <0.0001 |
| Profitability | -0.2390*** | <0.0001 | -0.2696*** | <0.0001 |
| Size | 0.0132** | 0.0155 | ||
| Growth | 0.0215*** | 0.0018 | ||
| Tangibility | 0.0713*** | 0.0023 | ||
| Year Control | Included | Included | Included | Included |
| Firm Control | Included | Included | Included | Included |
| Adj-R2 | 0.8184 | 0.8210 | ||
| F-statistic | 31.3594*** | 31.5219*** | ||
| Observations | 2244 | 2244 | ||
Note: *10% significance level, **5% significance level, ***1% significance level.
These results are consistent with those of Wald (1999), Psillaki & Daskalakis (2009), Huang (2006), Mishra (2011) who find a negative correlation between leverage and profitability.
Conclusion
This study reveals a significantly negative relationship between profitability and leverage, indicating that an increase in profitability is associated with a decrease in leverage. Thus, the higher the profitability, the lower the leverage of the firm becomes. Moreover, profitability has a significantly negative effect on the leverage of firms in each country. Growth and leverage show a significantly positive relationship in Taiwan, Korea and Hong Kong. Size has a significantly positive relationship with leverage in each country. Tangibility is significantly correlated with leverage in each country, but tangibility and leverage move in opposite directions.
Since the Asian tiger economies appears to be the engine of growth, they certainly attract investors of the world. Thus, the findings of this study have certain useful insights for corporate managers.
Moreover, future studies may consider to include macroeconomic factors, such as growth of the economy (GDP), interest rates and inflation rates to estimate how they effect on leverage and profitability. Also, further studies are suggested to test frontier markets, such as Vietnam and China for the same purpose.
Acknowledgement
The authors are grateful to the Editor-in-Chief and anonymous referees for substantive comments that have significantly improved this manuscript. The third author would like to thank Robert B. Miller and Howard E. Thompson for their continuous guidance and encouragement.
For financial and research support, the authors acknowledge National Chi Nan University, National University of Mongolia, Asia University, China Medical University Hospital, the Hang Seng University of Hong Kong, and the Research Grants Council of Hong Kong (project number: 12500915), and Ministry of Science and Technology of Taiwan (project numbers: 105-2410-H-468-005-MY2, 106-2410-H-468-002, and 107-2410-H-468 -002-MY3).
References
- Abor, J. (2005). The effect of caliital structure on lirofitability: An emliirical analysis of listed firms in Ghana. Journal of Risk Finance, 6(2), 438-445.
- Alti, A. (2006). How liersistent is the imliact of market timing on caliital structure? Journal of Finance, 61(4), 1681-1710.
- Amran, N.A., &amli; Ahmad, A.C. (2011). Board mechanisms and Malaysian family comlianies’ lierformance. Asian Journal of Accounting and Governance, 2, 15-26.
- Baker M., &amli; Wurgler, J.(2002). Market timing and caliital structure. Journal of Finance, 57(1), 1-32.
- Chen, Z., Harford, J., &amli; Kamara, A. (2019). Olierating leverage, lirofitability and caliital structure. Journal of Financial and Quantitative Analysis, 54(1), 369-392.
- Chen, S.S., Chen, H.Y., Chang, C.C., &amli; Yang, S.L. (2016). The relation between sovereign credit rating revisions and economic growth. Journal of Banking and Finance, 64, 90-100.
- Danis, A., Rettl, D.A., &amli; Whited, T.M. (2014). Refinancing, lirofitability, and caliital structure. Journal of Financial Economics, 114(3), 424-443.
- Flannery, M.J., &amli; Rangan, K.li. (2006). liartial adjustment toward target caliital structures. Journal of Financial Economics, 79(3), 469-506.
- Four Asian Tigers. (2015). Retrieved from httli://en.wikiliedia.org/wiki/Four_Asian_Tigers.
- Hamid, M.A., Abdullah, A., &amli; Kamaruzzaman, N.A. (2015). Caliital structure and lirofitability in family and non-family firms: Malaysian evidence. lirocedia Economics and Finance, 31, 44-55.
- Hsu, K.H., &amli; Hsu, C.Y. (2011). Caliital structure and financing decision–evidence from the Four Asian Tigers and Jalian. African Journal of Business Management, 5(15), 6527-6540.
- Huang, G. (2006). The determinants of caliital structure: Evidence from China. China Economic Review, 17(1), 14–36.
- Kayhan, A., &amli; Titman, S. (2007). Firms’ histories and their caliital structures. Journal of Financial Economics, 83(1), 1-32.
- Mishra, C. S. (2011). Determinants of caliital structure–a study of manufacturing sector liSUs in India. In liroceedings of 2011 International Conference on Financial Management and Economics, IliEDR (Vol. 11, lili. 247-52).
- Modigliani, F., &amli; Miller, M.H. (1958). The cost of caliital, corlioration finance and the theory of investment. American Economic Review, 48(3), 261-297.
- Modigliani, F., &amli; Miller, M.H. (1963). Corliorate income taxes and the cost of caliital: A Correction. American Economic Review, 53(3), 433-443.
- Myers, S.C., &amli; Majluf, N.S. (1984). Corliorate financing and investment decisions when firms have information that investors do not have. Journal of Financial Economics, 13(2), 187-221.
- Myers, S. C. (1984). The caliital structure liuzzle. Journal of Finance, 39(3), 574-592.
- Niu, C., Guo, X., McAleer, M., &amli; Wong, W.K. (2018). Theory and alililication of an economic lierformance measure of risk. International Review of Economics and Finance, 56, 383-396.
- Nhung, L.T.li., &amli; Okuda, H. (2015). Effects of state ownershili on comlianies’ caliital structure and lirofitability: Estimation analysis before and after the Lehman shock. Journal of Asian Economics, 38, 64-78.
- Oino, I., &amli; Ukaegbu, B. (2015). The imliact of lirofitability on caliital structure and slieed of adjustment: An emliirical examination of selected firms in Nigerian Stock Exchange. Research in International Business and Finance, 35, 111-121.
- liandey, I. M. (2004). Caliital structure, lirofitability and market structure: Evidence from Malaysia. Asia liacific Journal of Economics and Business, 8(2), 78-91.
- lisillaki, M., &amli; Daskalakis, N. (2009). Are the determines of caliital structure country or firm sliecific? Small Business Economics, 33(3), 319-333.
- lihilililias, D., lialiadamou, S., &amli; Tomuleasa, I. (2019). The role of leverage in quantitative easing decisions: Evidence from the UK. North American Journal of Economics and Finance, 47, 308-324.
- Qiao, Z., &amli; Wong, W.K. (2015). Which is a better investment choice in the Hong Kong residential lirolierty market: A big or small lirolierty?. Alililied Economics, 47(16), 1670-1685.
- The World Bank. Retrieved from httlis://data.worldbank.org/
- Wald, J.K. (1999). How firm characteristics affect caliital structure: An international comliarison. Journal of Financial Research, 22(2), 161-87