Research Article: 2018 Vol: 22 Issue: 3
Relationship Between Tax Avoidance and Key Financial Indicators in Koreas Construction Waste Disposal Industry
Weon Jae Kim, Incheon National University
Geun Bae Jang, Handong Global University
Abstract
This study the first of its kind in the chosen context examined whether a relationship exists between tax avoidance and key financial indicators in the construction waste disposal industry in Korea. The indicators of interest were cash flows from operations, the ratio of noncurrent assets to noncurrent financing (shareholder equity and noncurrent liabilities), and debt dependency level. The model used for the analysis was Desai & Dharmapala’s tax avoidance proxy model. Results showed that cash flows from operations and the ratio of noncurrent assets to noncurrent financing are significantly positively related to tax avoidance. By contrast, debt dependency level exhibits no significant relationship with the aforementioned practice. On these bases, we can infer that the Korean construction waste disposal industry responds differently to key financial indicators with regard to tax avoidance. Overall, companies in the industry implement tax avoidance strategies on the basis of their ability to generate operating cash and noncurrent assets-to-noncurrent financing ratio rather than debt dependency. These findings provide important insights for people who are interested in tax information on the construction waste disposal industry in Korea.
Keywords
Tax Avoidance, Cash Flows from Operating Activities, Noncurrent Assets to Noncurrent Financing, Debt Dependency, Construction Waste Disposal Company.
Introduction
The management of various types of waste is essential to ensuring a sustainable environment. In the Korean context, consciousness regarding waste management has sharply increased because of the worsening environmental problems caused by waste and the air pollution stemming from vehicles, factories, and dust transmitted from overseas. According to the 2017 White Paper of Environment released by the Korean government, the annual volume of waste in the country increased from 95 million tons in 2001 to 153 million tons in 2015, reflecting a cumulative annual growth rate (CAGR) of 3.4%. During this period, construction waste in particular increased to an even higher volume at a CAGR of 4.5% because of city redevelopment and investment in social infrastructure. Construction waste accounted for more than 53% of Korea’s total volume of waste in 2015. These issues highlight the considerable importance of managing construction waste in an environment-friendly manner.
The years 2008 to 2017 were a period of growth for the Korean construction waste disposal industry, with the number of companies in the sector increasing from 417 to 529. The major activities of these companies are collecting, delivering, classifying, and processing construction waste, after which they complete the waste disposal cycle. They are very competitive in bidding to acquire orders to process construction waste from construction companies. When these companies choose construction waste disposal contractors, one of the key criteria that they consider is the financial health of such contractors, as measured via profitability, financial structure, and cash flow. These contractors perform both accrual earnings management and real earnings management, as reported by Kim & Lee (2016). Correspondingly, we examined whether such companies also implement tax avoidance practices.
Kim & Im (2017) defined tax avoidance as a concept that encompasses all company activities designed to reduce tax burdens, regardless of legitimacy; whereas tax saving is a legal and rational tax reduction activity, tax avoidance is an illegal practice that includes fraud, the nondisclosure of profits, and the inflation of expenses. Companies are strongly incentivized to minimize tax expenses because their financial performance is measured on the basis of return on equity earned through net income, which corresponds to earnings after tax expenses (Choi & Kweon, 2015).
Book-to-tax differences (BTDs) have been grown, as claimed by Plesko (2016). This claim, however, has been countered or qualified by other researchers. Manzon & Plesko (2002), for example, asserted that increasing BTD is not due to tax avoidance. Although Desai (2003) agreed that BTDs originate from a company’s tax avoidance behaviors, the author indicated that they also arise from differences in financial accounting and taxation rules with respect to depreciation methods, employee compensation, and overseas income under tax and financial accounting. Graham & Tucker (2006) showed that tax avoidance accounts for about 9% of total assets in the US. Desai & Dharmapala (2006) developed an estimate for a tax avoidance proxy by using BTD as basis. The authors estimated tax avoidance and controlled for the earnings management effects of total accruals under the assumption that BTD is a combined effect of earnings management intended to increase book income and tax avoidance designed to minimize taxable income. Choi (2002) showed that earnings management and BTD are negatively and positively related to tax avoidance, respectively.
With respect to tax avoidance methods, Frank, Lynch & Rego (2006) explained that the most ideal is to use strategies that do not affect book income but reduce taxable income. Plesko (2006) mentioned that using permanent difference is more favorable than using temporary difference as an approach to tax avoidance given that the former exerts no future reversal effect. Both the understatement of revenue and the overstatement of expenses reduce taxable incomes and tax expenses, but understating is a less-favored strategy for tax avoidance because revenue is a corresponding party’s expense. Koh, Kim & Choi (2007) demonstrated that overstated expenses are extensively constituted by material costs, labor costs, and noncapitalized R&D expenses. Regardless of method, the incentives of companies to exercise tax avoidance can differ, depending on a firm’s financial situation and characteristics. In connection with the statement of financial position items, companies with high asset sizes tend to more frequently practice tax avoidance as they have enough resources to perform tax avoidance planning (Kim & Jeong, 2006; Choi, Koh & Jo, 2007). Other researchers, with the exception of Graham & Tucker (2006), explained that firms with high debts less frequently practice tax avoidance because they can reduce tax burdens by registering interest costs as expenses (Koh, Kim & Choi, 2007; Choi, Koh & Jo, 2011; Lee & Hong, 2015; Yang, 2014). Capital-intensive firms also implement tax avoidance strategies to a lesser extent given the availability of other opportunities to reduce taxes through investment tax credits. In relation to income statement items, firms that earn high profits and incur high tax burdens more frequently implement tax avoidance to reduce their tax expenses (Frank, Lynch & Rego, 2006; Koh, Kim & Choi, 2007; Kim & Jeong, 2006). By contrast, firms with substantial tax benefits tend to less frequently engage in tax avoidance because they have sufficient tax savings (Frank, Lynch & Rego, 2006; Kim & Jeong, 2006). Firms with financial deficit engage more often in tax avoidance to generate cash (Kweon, Kang & Kim, 2009). In the matter of cash flows, operating cash flows and prior-year free cash flows have a negative relationship with tax avoidance (Lee & Hong, 2015; Choi & Kweon, 2016). Other studies indicated that a high ratio of noncurrent assets to noncurrent financing (shareholder equity and noncurrent liabilities) tend to increase tax avoidance and that high capitalization of R&D expenses is negatively related to tax avoidance.
The magnitude of tax avoidance can also vary across industries; the manufacturing industry, for instance, more strongly engages in tax avoidance than does the construction industry (Choi & Kweon, 2015). In Korea, the construction waste disposal industry differs from the manufacturing industry in terms of key financial indicators given that the former is a capitalintensive industry. According to the Bank of Korea’s financial statement analysis for 2016, the construction waste disposal industry is more capital intensive, more debt dependent, and less financed by noncurrent liabilities than the manufacturing industry. Specifically, the noncurrent assets-to-noncurrent capital ratio (shareholder equity and noncurrent liabilities), debt dependency (debt-to-total capital ratio), and noncurrent assets-to-total assets ratio of the construction waste disposal and manufacturing industries are 89% and 84%, 44% and 24%, and 42% and 36%, respectively. With consideration for these attributes, the current research examined whether a relationship exists between financial indicators and tax avoidance in the construction waste disposal industry in Korea by using the tax avoidance model proposed by Desai & Dharmapala (2006). We focused on cash flows from operations, noncurrent assets-to-noncurrent financing ratio (shareholder equity and noncurrent liabilities), and debt dependency level as the indicators of interest. Most tax avoidance studies directed attention to listed companies and reasonably large enterprises, but most of the construction waste disposal companies in Korea are nonlisted small and medium-sized enterprises. No evidence has been provided as to whether tax avoidance in an industry composed of small-scale companies exhibits a pattern similar to that in other industries. As the first study on tax avoidance in Korea’s construction waste disposal industry, therefore, the current work provides empirical evidence that offers very important implications to the sector.
The rest of the paper is organized as follows. Section 2 is a review of the literature on tax avoidance and related financial indicators. It also presents the reasoning that underlies our hypotheses. Section 3 discusses our research methodology, and Section 4 describes the descriptive statistics of the variables used in this work, the correlations that we derived, and the results of an empirical test. Section 5 concludes the paper.
Literature Review And Hypothese Development
Tax avoidance is a continuing study subject by many researchers. Yun, Kweon & Kim (2018) made a study on the relation between tax avoidance and financial flexibility (an ability to react to unexpected cash needs) and it showed a negative relationship as companies with high financial flexibility have higher levels of debt financing and therefore, the tax savings effect on interest costs will lower the level of tax avoidance. Kim & Park (2016) examined the relation between tax avoidance and firm life cycle based on cash flow patterns and found that there are significantly different levels of tax avoidance across firms` life cycle. In detail, the level of tax avoidance is similar between the growth and mature stages, whereas the level of tax avoidance for these two stages is stronger than the start-up and declining stages’ tax avoidance. The results indicate that tax avoidance is different across firms` life cycle and that firm characteristics such as tax burden, tax subsidy, profitability, and financial constraints have different effects on the tax avoidance according to the firm life cycle. Kim, Im & Jang (2017) performed a study on the relationship between tax avoidance and financial ratios and the study found that inventory to current assets ratio, the cash structure ratio, net profit to total debt ratio, and the labor equipment ratio had a significant relation to tax avoidance. Ko & Park (2017) performed a study on the relations among financial constraint, tax avoidance and firms` use of operating cash flow. The main findings are more financially constrained firms usually use cash from tax avoidance mainly for investments, and the investments tend to be real investments such as acquiring fixed assets rather than securities or other purpose investments.
Diverse prior studies probed into the relationship between tax avoidance and different financial indicators, including asset size, debt, capital intensity, profit, deficit, tax burdens and tax benefits, operating cash flows and prior-year free cash flows. Many of these studies used, as a proxy for tax avoidance, the model developed by Desai & Dharmapala, who developed their proxy by subtracting total accruals from BTDs on the basis of the assumption that BTDs encompass earnings management and tax avoidance. The specific issue pursued by Desai & Dharmapala (2006) was the relationship between CEO compensation level and tax avoidance, with the authors discovering that as CEO compensation increases, tax avoidance decreases. Kim and Jeong (2006) demonstrated that asset size and debt have positive and negative relationships with tax avoidance, respectively. Their interpretation indicated that as debt increases, tax burdens and tax avoidance incentives decrease. Similar to other studies (Lee & Hong, 2015; Yang, 2014; Choi & Kweon, 2016) discovered a negative relationship between debt level and tax avoidance. Kim & Lee (2015) showed a positive correlation between earnings management and noncurrent assets-to-noncurrent financing ratio, including shareholder equity and noncurrent liabilities. Their interpretation is that a high ratio means that companies invest in noncurrent assets by using current financing, including short-term debts. They then have an incentive to implement tax avoidance as a cash source. The authors also found that debt dependency level is negatively associated with tax avoidance. Koh, Kim & Choi (2007) reported that companies with high profits and high tax burdens tend to engage more frequently in tax avoidance and that tax benefits have a negative relationship with the aforementioned practice. Choi & Kweon (2015) verified a positive relationship between financial deficit and tax avoidance, and Yang (2014) demonstrated that cash flow from operations is negatively associated with tax avoidance. Yang stated that as companies have more cash, the incentive for tax avoidance lessens, while Cho & Kweon (2015) showed that prior-year free cash level has a negative relationship with tax avoidance. On the basis of these prior studies, we would like to see the relationship of key financial indicators to the tax avoidance activities of the Korean construction waste disposal industry and formulated the following hypotheses for the industry:
H1: High cash flows from operations translate to low tax avoidance.
H2: A high noncurrent assets-to-noncurrent financing ratio results in high tax avoidance.
H3: High debt dependency reduces tax avoidance.
Research Methodology
Sample Selection
The sample consisted of Korean construction waste disposal companies that disclose their financial results in the DART system of the Korean Financial Supervisory Service’s website. We obtained a list of companies from Korea Investors Service, which is a credit rating agency in Korea, and excluded firms whose annual financial data span a period of less than 11 years. The data obtained from the sample comprised 11-years annual data covering 2006 to 2016 for 23 companies, and the final dataset consisted of 253 firm-year observations.
Definitions and Measurements of Variables
Measuring Tax Avoidance
Desai & Dharmapala (2006) developed an estimate of a tax avoidance proxy using BTD. Assuming that BTDs are a combined effect of earnings management intended to increase book income and tax avoidance designed to minimize tax income, they established equations (1) and (2) for the proxy, controlling for the earnings management effect using total accruals. Specifically, tax avoidance represents unexplained BTD on the basis of total accruals, which are calculated by subtracting total accruals from equation (1). The authors ran a regression using BTD as a dependent variable and total accrual as an independent variable. The resultant error term, as the proxy for tax avoidance, is as follows:
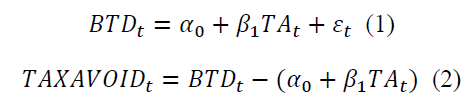
 Year t Book-to-Tax Difference (Book Income – Taxable Income) / Beginning Total Assets
 Total Accruals (Net Income-CFO) / Beginning Total Assets.
 Residual (Tax Avoidance)
Calculating the BTD necessitates knowing the taxable income of a company, but such information is currently undisclosed to the public. An alternative, therefore, is to estimate taxable income by dividing income tax expense by statutory corporate tax rate. The maximum statutory tax rates in Korea are 27.5% (2006 to 2008) and 24.2% (2009 to 2016). Taxable income and income tax expense were calculated as follows:
Estimated taxable income = Income tax expense / Maximum statutory corporate tax rate
Income tax expenses = Income tax expense + (Changes in deferred tax assets) – (Changes in deferred tax liabilities)
Control Variables
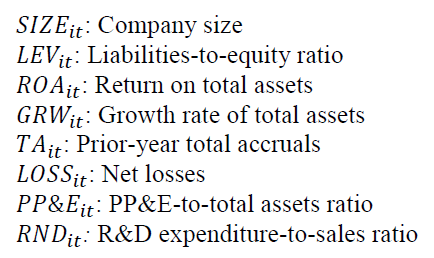
We used various control variables adopted in previous studies to reduce statistical error and increase the accuracy with which statistical inferences are made (Kim & Jeong, 2006); Choi, Koh & Jo, 2006; Yang, 2014; Choi & Kweon, 2015). The specific control variables used in the present study were corporation size (SIZE); liabilities-to-equity ratio (LEV); return on total assets (ROA); growth of total assets (GRW); prior year’s total accruals (TA); property, plant, and equipment asset ratio (PP&E); R&D spending (RND); net losses (LOSS); and year (YEAR). SIZE is a log value of the amount of beginning total assets; LEV was derived by dividing total liability by shareholder equity; ROA was obtained by dividing net income by beginning total assets; GRW was obtained by dividing ending total assets by beginning total assets; and TA is the prior year’s net income minus the prior year’s operating cash flows divided by total assets. PP&E was derived by dividing property, plant, and equipment assets by total assets, and RND is R&D spending divided by sales. For LOSS, we used a dummy variable that was assigned a value of 1 for net loss and 0 for net income.
Research Model
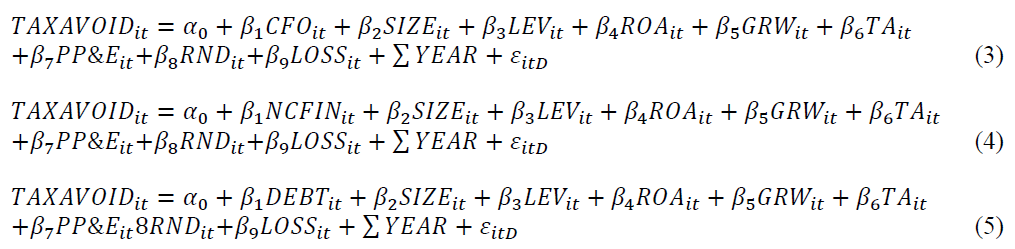
As previously mentioned, this study inquired into the relationship between certain key financial indicators and tax avoidance in the construction waste disposal industry of Korea. For validation, we adopted equations (3) to (5), for which BTD was used. The major independent variables used were cash flows from operations (CFO), noncurrent assets-to-noncurrent financing ratio (NCFIN), and debt dependency (DEBT). CFO was measured by dividing CFO by beginning total assets for standardization. NCFIN was measured by dividing noncurrent assets by noncurrent capital, including shareholder equity and noncurrent liabilities. DEBT is the financial ratio of total debts against the sum of total liabilities and shareholder equities. This ratio serves as an indicator of a company’s financial health and profitability.
Dependent Variables
 Tax avoidance based on Desai & Dharmapala’s model (2006)
Independent Variables
 Cash flow from operations (continuous variable)
 Noncurrent assets-to-noncurrent financing ratio (continuous variable)
 Debt dependency (continuous variable)
Control Variables
Year: Year dummy
Empirical Results
Descriptive Statistics and Correlations
Table 1 presents the descriptive statistics of the major variables. The mean of the proxy for the dependent variables (TAXAVOID) is 0 because these values were estimated by subtracting expected values, which were derived from the regression analysis, from actual values. The TAXAVOID median value is -0.005. The minimum and maximum of TAXAVOID distributions are -0.44 and 0.60, respectively. The mean and median of CFO as an independent variable are 0.0974 and 0.0699, respectively, indicating that the average CFO against beginning total assets is 9.74%. The mean and median of NCFIN are 0.7757 and 0.7525, respectively, indicating that about 78% of noncurrent assets were financed by noncurrent capital. The mean and median of DEBT are 0.3179 and 0.3334, respectively, reflecting that about 32% of necessary capital was provided by debt creditors.
| Table 1: Descriptive Statistics Of Major Variables | ||||||
| Variables | Names | Mean | SD | Median | Minimum | Maximum |
|---|---|---|---|---|---|---|
| Dependent Variables | TAXAVOID | 0.0001 | 0.0891 | -0.0050 | -0.44 | 0.60 |
| Independent Variables | NCA | 0.7757 | 0.3905 | 0.7525 | 0.04 | 3.62 |
| CFO | 0.0974 | 0.1348 | 0.0699 | -0.18 | 0.93 | |
| DEBT | 0.3179 | 0.1982 | 0.3334 | 0.00 | 0.97 | |
| Control Variables | SIZE | 10.2370 | 0.3750 | 10.1857 | 9.45 | 11.44 |
| LEV | 1.1451 | 3.1094 | 0.7580 | 0.04 | 47.07 | |
| ROA | 0.0694 | 0.1209 | 0.0483 | -0.40 | 0.64 | |
| GRW | 0.1679 | 0.3139 | 0.0832 | 0.46 | 2.86 | |
| TA | -0.0357 | 0.2055 | -0.0336 | 0.60 | 2.20 | |
| PP&E | 0.5438 | 0.1606 | 0.5619 | 0.03 | 0.97 | |
| RND | 0.0028 | 0.0074 | 0.0000 | 0.00 | 0.05 | |
| LOSS | 0.1462 | 0.3541 | 0.0000 | 0.00 | 1.00 | |
Definitions: TAXAVOID: Tax avoidance; CFO: Cash flows from operations (CFO / Beginning total assets); NCFIN: Noncurrent financing (Noncurrent assets / Shareholders’ equity and noncurrent liabilities); DEBT: Debt dependency (Debts / Shareholders’ equity and total liabilities); SIZE: Company size (Natural log value of beginning total assets); LEV: Liabilities to equity (Total liabilities / Net assets); ROA: Return on total assets (Net income / Beginning total assets); GRW: Total asset growth{(Ending total assets – Beginning total assets) / Beginning total assets}; TA: Prior-year total accruals {(Prior-year net income – Prior year cash flows from operations) / Prior-year beginning total assets}; PP&E: PP&E portion of total assets (PP&E / Beginning total assets); RND: R&D expenditure (R&D expenditure / Sales); LOSS: Net losses (Dummy variable, Net losses = 1, Otherwise = 0).
The mean and median of SIZE are 10.2370 and 10.1857, respectively, and their spread is minimal. The mean of LEV is 1.1451, indicating that the average LEV of the companies reflects 145% of liabilities against total equities. The means of ROA and GRW are 0.0694 and 0.1679, respectively, indicating that the average ROA is 6.9% and that the average total asset growth rate is 16.8%. The mean of TA is -0.0357. The means of PP&E and RND are 0.5438 and 0.0028, respectively, indicating that the average PP&E against total assets is 54% and that the average RND spending against sales is 0.28%. The data confirmed that the Korean waste disposal construction industry is capital-intensive and incurs minimal R&D costs. The mean of LOSS is 0.1462, that is, 14.62% of the observations that reflected net losses for the companies.
Table 2 lists the results of the Pearson’s correlation analysis of the variables. TAXAVOID and CFO showed a statistically and highly positive significance of .556 at the 1% level, demonstrating that these variables move in the same direction. TAXAVOID also showed a significant negative correlation (-0.151) with DEBT at 1% but a nonsignificant negative correlation (-0.135) with NCFIN. This result suggests that companies with high CFO tend to more aggressively pursue tax avoidance than do enterprises with low operating cash flows from operations. NCFIN did not show a statistically significant relationship with TAXAVOID, and DEBT showed a negative correlation with TAXAVOID at the 1% level. Companies with high debt dependency engage less frequently in tax avoidance. The control variables exhibited a strong correlation with TAXAVOID. The relationship of SIZE, ROA, GRW, and LOSS with TAXAVOID is significant at the 1% level, and LEV is correlated with TAXAVOID also at the 1% level.
| Table 2: Pearson Correlation Among Variables | ||||||||||||
| TAX- AVOID |
NCFIN | CFO | DEBT | SIZE | LEV | ROA | GRW | TA | PP&E | RND | LOSS | |
|---|---|---|---|---|---|---|---|---|---|---|---|---|
| TAXAVOID | 1.000 | |||||||||||
| NCFIN | -0.030 | 1.000 | ||||||||||
| CFO | 0.556*** | -0.195*** | 1.000 | |||||||||
| DEBT | -0.151** | 0.535*** | -216*** | 1.000 | ||||||||
| SIZE | -0.224*** | 0.146** | -0.166** | 0.053 | 1.000 | |||||||
| LEV | -0.137** | 0.604*** | -0.122* | 0.447*** | -0.007 | 1.000 | ||||||
| ROA | 0.618*** | -0.257*** | 0.568*** | -0.387*** | -0.322*** | -0.245*** | 1.000 | |||||
| GRW | 0.193*** | -0.101 | 0.251*** | -0.060 | -0.218*** | -0.057 | 0.306*** | 1.000 | ||||
| TA | -0.006 | 0.020 | -0.444*** | -0.050 | -0.149** | -0.044 | 0.150** | 0.054 | 1.000 | |||
| PP&E | 0.035 | 0.427*** | -0.146** | 0.271*** | 0.148*** | 0.207*** | -0.218*** | -0.020 | 0.024 | 1.000 | ||
| RND | 0.105* | -0.037 | 0.044 | -0.089 | 0.199** | -0.056 | 0.031 | 0.009 | -0.033 | 0.113* | 1.000 | |
| LOSS | 0.370*** | 0.212*** | -0.300*** | 0.268*** | 0.163** | 0.253*** | -0.523*** | -0.107* | -0.082 | 0.146** | -0.107* | 1.000 |
* p<.05, ** p<.01, *** p<.001
Variable definitions are same as those in Table 1.
Regression Analyses Results
Effects of Cash Flows from Operations on Tax Avoidance
Table 3 presents the results of the hierarchical regression analysis for Hypothesis 1, which revolves around the effects of CFO on tax avoidance in the Korean construction waste disposal companies during the analysis period. In step one, we used various control variables. Table 3 shows only the results of step 2 given space limitations. CFO’s effects on tax avoidance are statistically significant at the 1% level. The R2 value of TAXAVOID is 0.492, which explains 49.2% of TAXAVOID. The tolerance of the variables and the variance inflation factor (VIF) are close to 1, indicating the near-absence of multicollinearity.
| Table 3: Regression Results On Effects Of Cash Flows From Operations On Tax Avoidance | ||||
| Input Variables | Tax Avoidance | Tolerance | VIF | |
|---|---|---|---|---|
| B | t | |||
| Constant | 0.058 | 0.465 | ||
| SIZE | -0.015 | -1.247 | 0.813 | 1.230 |
| LEV | 0.000 | -0.318 | 0.883 | 1.133 |
| ROA | 0.282 | 5.148*** | 0.377 | 2.650 |
| GRW | -0.012 | -0.885 | 0.868 | 1.153 |
| TA | 0.040 | 1.506 | 0.550 | 1.819 |
| PP&E | 0.103 | 3.829*** | 0.897 | 1.114 |
| RND | 0.768 | 1.342 | 0.925 | 1.081 |
| LOSS | -0.014 | -1.040 | 0.698 | 1.433 |
| Year Dummy | Included | |||
| CFO | 0.254 | 5.201*** | 0.382 | 2.617 |
| R2(ΔR2) | 0.492(0.057) | |||
| F | 27.048*** | |||
* p<.05, ** p<.01, *** p<.001
Variable definitions are the same as those in Table 1.
The coefficient of CFO as an independent variable for TAXAVOID is 0.254, which is statistically significant at the 1% level. This finding implies that companies with high cash generation tend to more aggressively implement TAXAVOID than do companies with low cash generation. This result contrasts with that on Hypothesis 1 with respect to a negative relationship between cash flows from operations and tax avoidance. This difference suggests a different response from the industry to cash flows from operations. Among the control variables, the effects of ROA and PP&E on TAXAVOID are statistically significant at the 1% level.
Effects of Noncurrent Financing for Noncurrent Assets on Tax Avoidance
Table 4 provides the hierarchical regression analysis results for Hypothesis 2, which revolves around the effects of noncurrent financing for noncurrent assets on tax avoidance in the construction waste disposal companies. As with the analysis for Hypothesis 1, step 1 involved the use of various control variables, but Table 4 shows only the results of step 2 because of space limitations. With respect to TAXAVOID, excluding the effects of the control variables, NCFIN’s contribution to the overall explanation for TAXAVOID is statistically positively significant at 5%. The tolerance level of the variables is closer to 1 than 0, and their VIF level is nearer to 1 than 10, thus demonstrating the near-absence of multicollinearity.
| Table 4: Regression Results On Effects Of Noncurrent Financing For Noncurrent Assets On Tax Avoidance | ||||
| Input Variables | Tax Avoidance | Tolerance | VIF | |
|---|---|---|---|---|
| B | t | |||
| Constant | 0.127 | |||
| SIZE | -0.022 | -1.761 | 0.799 | 1.251 |
| LEV | -0.003 | -1.584 | 0.594 | 1.683 |
| ROA | 0.458 | 10.068*** | 0.595 | 1.680 |
| GRW | -0.001 | 0.090 | 0.880 | 1.136 |
| TA | -0.055 | -2.585* | 0.955 | 1.048 |
| PP&E | 0.0076 | 2.550* | 0.777 | 1.288 |
| RND | 0.936 | 1.567 | 0.919 | 1.088 |
| LOSS | -0.016 | -1.082 | 0.698 | 1.432 |
| Year Dummy | Included | |||
| NCFIN | 0.037 | 2.456* | 0.520 | 1.922 |
| R2(?R2) | 0.506 (0.014) | |||
| F | 6.031* | |||
* p<.05, ** p<.01, *** p<.001
Variable definitions are the same as those in Table 1.
The coefficient of NCFIN is 0.037 and is statistically significant at the 5% level, showing that companies with a high ratio of short-term financing to noncurrent assets tend to more aggressively pursue tax avoidance as a source of cash. This result aligns with Hypothesis 2. The coefficient of ROA is 10.068 and is significant at the 1% level, and the coefficients of TA and PP&E are significant at the 5% level.
Effects of Debt Dependency on Tax Avoidance
Table 5 shows the results of the hierarchical regression analysis for Hypothesis 3, which pertains to the effects of DEBT on tax avoidance in the construction waste disposal companies. Again, step 1 involved various control variables, but only the results of step 2 are presented in the table given space limitations. The tolerance levels of all the variables are closer to 1 than 0, and their VIF levels are closer to 1 than 10, demonstrating that almost no multicollinearity issue occurred in our analysis.
| Table 5: Regression Results On Effects Of Debt Dependency On Tax Avoidance | ||||
| Input Variables | Tax Avoidance | Tolerance | VIF | |
|---|---|---|---|---|
| B | t | |||
| Constant | 0.078 | |||
| SIZE | -0.017 | -1.358 | 0.813 | 1.229 |
| LEV | -0.001 | -0.772 | 0.770 | 1.300 |
| ROA | 0.475 | 10.014*** | 0.556 | 1.798 |
| GRW | -0.004 | -0.283 | 0.880 | 1.136 |
| TA | -0.050 | -2.377* | 0.960 | 1.042 |
| PP&E | 0.096 | 3.360* | 0.872 | 1.147 |
| RND | 0.896 | 1.489 | 0.919 | 1.088 |
| LOSS | -0.016 | -1.104 | 0.698 | 1.433 |
| Year Dummy | Included | |||
| DEBT | 0.041 | 1.588 | 0.691 | 1.448 |
| R2(ΔR2) | 0.512 (0.006) | |||
| F | 2.521* | |||
* p<.05, ** p<.01, *** p<.001
Variable definition is same with that of bottom of Table 1.
DEBT for avoidance is statistically nonsignificant at 5%, which deviates from the result of Kim & Lee (2015) and Hypothesis 3. The study showed that debt dependency level negatively affects TAXAVOID. Thus, the effects of leverage on tax avoidance may need additional investigation in the context of the construction waste disposal industry. The coefficient of ROA is 10.014 and is significant at the 1% level, and the coefficients of TA and PP&E are significant at the 5% level.
Conclusion
This study was aimed at examining the major relationship between key financial indicators, such as cash flows from operations, noncurrent assets-to-noncurrent financing ratio, and debt dependency level, and tax avoidance in the construction waste disposal industry in Korea. We used 253 firm-year observations as bases in the analyses and applied Desai & Dharmapala’s model (2006) as a proxy for tax avoidance. We likewise developed three hypotheses, for which the test results are as follows. First, cash flows from operations are statistically significant at the 1% level in relation to tax avoidance. Companies with high cash generation exhibit a stronger tendency toward tax avoidance. Second, the construction waste disposal companies’ noncurrent assets-to-noncurrent capital ratio is statistically significantly related to tax avoidance. Companies with a high ratio of noncurrent assets to noncurrent capital exhibit a high potential to adopt tax avoidance. Third, the construction waste disposal companies’ debt dependency levels are statistically nonsignificantly associated with tax avoidance a result that deviates from that of a previous study.
Our results indicated that incentives for tax avoidance differ depending on financial indicators. Looking into cash flows from operations enabled us to determine the possibilities that characterize tax avoidance by construction waste disposal companies in Korea. When companies have high operating cash flows, they implement tax avoidance. This result contrasts with our hypothesis and the findings of a previous study. Unlike that study, the present work determined that debt dependency level has a statistically nonsignificant relationship with tax avoidance in Korea’s construction waste disposal industry. As the first endeavor of its kind, the present research’s results can provide insights for those who are interested in accounting and tax information on the aforementioned industry. Especially, the Korean National Tax Service can identify potential tax avoidance activities of the Korean construction waste disposal industry by looking into the key financial indicators of the industry based on this study. In addition, the management of the industry association can see how the companies of the industry behave in connection with the tax avoidance under different financial indicators and they can set up a measure to avoid a potential bad reputation of the industry caused by the tax avoidance if necessary.
Similar to other studies, this research has certain limitations. We used only 253 firmyear observations because a small number of companies in Korea’ construction waste disposal industry disclosed their financial conditions on the Korean Financial Supervisory Service’s website. Accordingly, this limits the generalizability of our findings. Researchers can expand our work by including more data as the Korean government strengthens its financial disclosure system. Researchers can also extend tax avoidance studies to other industries for comparison and for the identification of characteristics that are unique to the tax avoidance practices of Korea’s construction waste disposal industry.
Acknowledgment
This research was supported with financial aid from Incheon National University.
References
- Choi, H.S. & Kweon, S.C. (2016). An effect financial condition of corporate on tax avoidance: Focus on financing deficit ratio, debt ratio, interest coverage ratio. Journal of Accounting Information Research, 34(1), 268-297.
- Choi, H.S. & Kweon, S.C. (2015). Financial condition and tax avoidance. Journal of Business Research, 30(4), 521-549.
- Choi, H.S. & Kweon, S.C. (2015). Free cash flow and tax avoidance. Journal of Industrial Economics and Business, 28(6), 2615-2637.
- Choi, W.W., Koh, Y.S. & Jo, J.E. (2011). Related party transactions and tax avoidance. Korean Journal of Taxation Research, 28(3), 9-35.
- Desai, M. (2003). The divergence between book income and tax income. Tax Policy and the Economy, 17, 169-206.
- Desai, M. & Dharmapala, D. (2006). Corporate tax avoidance and high powered incentives. Journal of Financial Economics, 79(1), 145-179.
- Frank. M.M., Lynch, L.J. & Rego, S.O. (2006). Does aggressive financial reporting accompany aggressive tax reporting. Working paper.
- Graham, J. & Tucker, A. (2006). Tax shelters and corporate debt policy. Journal of Financial Economics, 81, 563-594.
- Jo, M.H., Park, S.H. & Lee, H.G. (2011). A study on the effect of financial characteristics on tax avoidance in KOSDAQ firms. Korea Journal of Business Administration, 24(4), 2299-2315.
- Kim, J. & Im, C. (2017). Study on corporate social responsibility (CSR): focus on tax avoidance and financial ratio analysis. Sustainability, 1710, 1-15.
- Kim, D.B. & Lee, H.I. (2015). The study of earnings management behavior in the construction waste disposal industry by leverage level and cash flows from operating activities. Korea International Accounting Review, 64, 147-182.
- Kim, J.H., Im, C.C. & Jang, Y.W. (2017). Green tea, co-brand, local consumption for local produced products, avoidance using financial characteristics. Global Business Administration Review, 14(1), 1-25.
- Kim, J.H. & Jeong, J.W. (2006). The effect of corporate financial characteristics on tax avoidance. Korean Journal of Taxation Research, 23(4), 97-124.
- Kim, J.H. & Lee, S.H. (2015). The study on relationship between financial ratio and tax avoidance of listed companies. Study on Tax, Accounting and Auditing, 57(1), 217-240.
- Kim, M.H. (2016). An influence of earnings management and tax avoidance on stock price. Journal of Accounting Information Research, 34(4), 247-266.
- Kim, S.M. & Park, S.O. (2016). A study on the relation between tax avoidance and firm life cycle based on cash flow patterns. Korean Accounting Journal, 25(6), 135-158.
- Ko, J.K. & Park, H.J (2017). Financial constraint, tax avoidance and firms` use of operating cash flow. Korean Accounting Journal, 26(4), 229-262.
- Koh, Y.S., Kim, J.H. & Choi, W.W. (2007). A study on corporate tax avoidance. Korean Journal of Taxation Research, 24(4), 9-40.
- Koh, Y.S. & Lee, J.H. (2008). An analysis of tax avoidance using industry. Journal of Industrial Economics and Business, 21(6), 2823-2846.
- Kweon, S.C. & Kang, Y.O. (2010). A study on the effects of corporate debt policy to tax shelters. Journal of Business Research, 25(2), 115-133.
- Kweon, S.C., Kang, Y.O. & Kim, C.H. (2009). An empirical study on relationship between tax avoidance and enterprise characters' variables. Korea International Accounting Review, 26, 189-210.
- Lee, S.C. & Hong, J.H. (2015). A study on the corporate characteristic factors influencing long term tax avoidance in KOSDAQ-listed Firms. Journal of Accounting Information Research, 33(4), 335-369.
- Manzon, G.B.Jr. & Plesko, G.A. (2002). The relation between financial and tax reporting measures of income, Tax Law Review, 55(2), 175-214.
- Park, J.I. & Kim, K.H. (2002). The influence of tax costs and earnings management on book-tax income differences. Korean Accounting Review, 27(2), 81-116.
- Park, S.W., Ko, J.K. & Kim, Y.C. (2014). Financial constraints and tax avoidance. Korean Accounting Journal, 23(4), 339-482.
- Plesko. G. (2004). Corporate tax avoidance and the properties of corporate earnings. National Tax Journal, 57(3), 729-738.
- Yang, K.H. (2014). A study on the tax avoidance of zero debt firms. Journal of Industrial Economics and Business, 27(4), 1723-1748.
- Yun, J.H., Kweon, S.C. & Kim, H.K. (2018). The effect of managerial ability and financial flexibility on tax avoidance. Journal of Business Research, 33(1), 49-73.