Research Article: 2018 Vol: 21 Issue: 2
Research of Human Capital and Its Potential Management on the Example of Regions of the Russian Federation
Elvir Munirovich Akhmetshin, Kazan Federal University, Elabuga Institute of KFU
Rustam Ilfarovich Sharafutdinov, Centre of Advanced Economic Research Academy of Sciences of the Republic of Tatarstan
Vladislav Olegovych Gerasimov, Kazan Federal University, Naberezhnye Chelny Institute of KFU
Irina Sergeevna Dmitrieva, Saint Petersburg State University of Aerospace Instrumentation (SUAI)
Aidar Sultangalievich Puryaev, Kazan Federal University, Naberezhnye Chelny Institute of KFU
Evgeny Andreevich Ivanov, Kazan Federal University, Naberezhnye Chelny Institute of KFU
Natalia Mikhailovna Miheeva, Saint-Petersburg State University, North-West Institute of Management (branch of RANEPA)
Abstract
The value of human capital, its potential, as well as the main components forming the human capital, are studied herein. A methodology for human capital assessment, contributing to the formation of various development programs for the regions of the Russian Federation aimed at improving the social and economic well-being, is proposed by the authors. The importance of human capital as a factor of economic growth, through the increase in labour performance, generation and implementation of new concepts and innovations, is revealed in this paper.
The dialectical and systemic approaches constitute the methodological basis of the study. The study is based on a wide use of analysis and synthesis methods, factor and statistical analyses.
As a result of the assessment conducted by the authors, a consolidated index of human capital management in the regions of the Russian Federation was formed and the programs for the development and enhancement of the intellectual and innovative potentials of human capital were developed.
The obtained results make it possible to supplement the existing research in the field of human capital formation, in particular, in the field of interaction with the intellectual and innovative potential. The practical significance of the research is to formulate the recommendations for improving human capital management in the regions and developing the conditions required to conduct the innovative and scientific activity.
Keywords
Human Capital of the Republic of Tatarstan, The Innovative Potential of the Region, The Intellectual Potential of the Region, The Labour Potential of the Region, The Composite Index of Human Capital, The Aggregate Intellectual and Innovative Potential.
Introduction
Nowadays, the competitive advantages of the economy and the possibilities for its modernization are largely determined by the accumulated and effectuated human capital, as well as the experience in various fields. Human capital is a diverse and highly complex productive factor that affects the development of the economy and society, including the labour force, the innovation system, high-performance accumulated knowledge, professional information systems, intellectual and organizational tools, the quality of life and the intellectual activity that ensure the efficient functioning of human capital (Nevretdinova, 2015).
Human capital is considered by modern economic growth theories as one of the key factors in the development of the economy, due to the fact that human capital contributes to economic growth, not only by increasing the labour productivity, but also through the generation and implementation of new concepts and innovations; moreover, it facilitates their perception and distribution (Becker, 2003; Davin et al., 2015). Therefore, the research in the field of human capital and increase in its potential is of great importance for the Russian Federation and its regions, by virtue of the fact that Russia is on the way to evolvement of the innovative development of the economy.
In order to achieve the above goals, the state and regional government bodies in the Russian Federation are increasingly trying to activate the innovative processes through the establishment of human capital institutions that could create conditions for a new stage in the economy development of the country (Chechina, 2013).
To date, innovations significantly influence the formation of sustainable growth and economic development of various economic systems. In the modern economy, innovations are the key drivers in value creation for goods and services, as well as the economic growth and employment.
However, the standard and traditional methods for managing human capital and its potential, required in the process of innovation development of the economic systems in the country and in its regions, begin to lose their potential and become increasingly constraining factors, resulting in a decrease in the efficiency of these constituent entities. As a result, the production structure of the country is not capable of adapting to modern, chaotically developing economic systems. For this reason, a need arises for development of an efficient system to manage the human capital and its potential, which will ensure the development of the aggregate intellectual and innovative potential of the human capital of the regions and of the country as a whole. The aggregate intellectual and innovative potential contributes to the staffing of the strategic fields oriented towards to socio-economic development, the release of new types of products, the emergence of new business areas, based on knowledge-based entrepreneurship and the commercialization of the scientific and technical concepts (Pozdnyakov, 2012). However, in order to build an efficient human capital management system, it is required to have a developed national methodology for human capital assessment, which is reflected, developed and tested herein by the example of the regions of the Russian Federation. Alongside the research on human capital and its further development, the measures for human capital development in the Republic of Tatarstan are proposed by the authors.
Literature Review
The concept of human capital was considered in one form or another in the scientific papers of A. Smith, D. Ricardo, A. Marshall, K. Marx, F. Engels, J. Mill, L. Walras, J.B. Clarke and other scientists (Brick & Goreltsev, 2014). Becker considered human capital as a set of skills, knowledge and experience of a person. According to his definition, "human capital is formed by investment in a person, including education, training in production, costs of health care, migration and search for information on prices and incomes" (Becker, 2003). According to Schulz, human capital is the valuable qualities acquired by a person that can be improved by appropriate investments (Schultz, 1961). However, Schulz and Becker paid more attention to the explanation and gaining the concept of an equitable distribution of material resources and the role of human capital in the gross national product development.
A lack of consensus on the definition and content of the concept of "human capital" can be observed in subsequent scientific papers. This fact can be explained by the complexity and versatility of this phenomenon. For example, economic dictionaries define human capital as the skills, abilities and experience of a person that enable a person to receive income (Bannock & Baxter, 2011).
Subsequently, this definition was expanded to include the non-material effects: Human capital is the knowledge, competence and properties embodied in the individuals, promoting a personal, social and economic well-being (Bannock & Baxter, 2011).
Human capital was understood by Dolan and Lindsay as capital, existing in the form of mental abilities, achieved either through formal training and education or through practical experience (Dolan & Lindsay, 1992).
Human capital consists of different parts. Depending on the main constituent parts, human capital can be imagined as the totality of certain elements (Mustafin & Ignateva, 2016). Such structural elements are proposed to be called the human capital potential, as they create a certain reserve of abilities suitable for application in activities (Kurgansky, 2011). Human capital is characterized herein, using the indicators for potential human capital (Markova & Smirnov, 2013).
Methods
Currently, three most common methods of human capital measurement are used: Cost-based–by the aggregate investments in human capital, discount–the calculations of the human capital value at a given rate of return on national wealth and the method for determination of the human capital integral values, based on the definition of a composite index by measuring its individual components by means of relevant indicators–the indicators, monitored by statistical bodies (Chizhova et al., 2013).
The most popular method in terms of comparison between the economic systems is the third approach, based on the definition of the composite index of human capital (Kucharpikova et al., 2015).
Based on the foregoing, it follows that the most appropriate method for assessing the regional human capital, taking into account the specifics of the database of the All-Russian Statistical Institution (Rosstat) and its regional structures, is the statistical approach, with a selection of certain indicators, based on which the composite index of the human capital of the region is be calculated. The statistical approach to human capital assessment implies two components–the indicators, characterizing the potential (conditions) and the results of the human capital functioning (Latyshev & Akhmetshin, 2015).
When assessing the level of human capital development in the Republic of Tatarstan, the following indicators are proposed as the regional human capital indicators (Table 1) (Zubarevich, 2014).
| Table-1 The Indicators Of The Components Of Human Capital Used In Assessing |
|
| Indicators | Value |
| Educational potential of the region | |
| The number of students in educational institutions for 10 thousand people. | Z1 |
| The share of the region's consolidated budget expenditures on education, to GRP | Z2 |
| Number of higher education institutions | Z3 |
| Number of daytime general education organizations, units. | Z4 |
| Number of students in general education organizations, thous. | Z5 |
| Regional health potential | |
| The share of the region's consolidated budget expenditures on health to GRP | Z6 |
| Life expectancy at birth | Z7 |
| Morbidity for 10,000 people | Z8 |
| Hospital facilities, pcs. | Z9 |
| Population | Z10 |
| Labour potential of the region | |
| Average salary | Z11 |
| Level of economic activity of the population | Z12 |
| The unemployment rate of the population | Z13 |
| Population | Z14 |
| Gross regional product | Z15 |
| Socio-cultural potential of the region | |
| The number of spectators of the theatres and the number of museum visits per 1000 people. The population | Z16 |
| The number of recorded crimes per 100 thousand people. the population | Z17 |
| Sale of alcoholic beverages in physical terms per capita | Z18 |
| Number of professional theatres, units | Z19 |
| Number of institutions of cultural-leisure type, units | Z20 |
| Intellectual potential of the region | |
| The share of high-tech and knowledge-intensive industries in GRP, % | Z21 |
| Share of domestic expenditure on research and development in GRP, % | Z22 |
| Number of patents per 10 thousand people | Z23 |
| The number of researchers holding a science degree, | Z24 |
| The number of personnel engaged in research and development, | Z25 |
| Innovation potential of the region | |
| Share of employed in high-tech and medium-technological activities in the total number of employed in the economy of the region, % | Z26 |
| Share of employed in high-tech and medium-technological activities in the total number of employed in the economy of the region, % | Z27 |
| Number of advanced manufacturing technologies created | Z28 |
| The share of innovative goods, works, services in the total volume of shipped goods, works performed, services | Z29 |
| Entrepreneurial potential | |
| Number of employees in the sphere of individual entrepreneurial activity, thousand people | Z30 |
| Share of proceeds of IP, to total GRP, % | Z31 |
| Number of small enterprises in the region | Z32 |
| Regional programs of entrepreneurship support in the region, pcs. | Z33 |
| Share of revenues by small enterprises to total GRP, % | Z34 |
To translate each indicator into an index, the value of which varies from 0 to 1, you need to use the formulas:
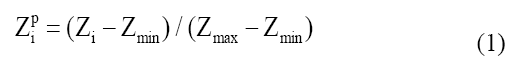
For indicators characterizing the negative impact:
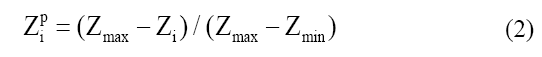
Where Zpi is the individual index of indicator i for the p-region;
Zi: The value of Z for the p-region;
Zmax ? Zmin: Maximum and minimum values of Z for the studied regions.
Further, it is required to determine the indices of the educational potential of the region, the labour potential of the region, the health potential, the socio-cultural potential, the intellectual potential for each territory, the entrepreneurial and innovation potential and to calculate the integrated human capital index of the region (IHCR) based on them. After the transfer of all regional indicators in the range of values from 0 to 1, the human capital potential indices can be determined. To simplify the methodology for human capital assessment, the relative importance of each individual and composite index can be considered equal to the formula 3-10 (Zabelina et al., 2013).
Index of educational potential: 
Health potential index: 
Labour force index: 
Index of socio-cultural potential: 
Intellectual potential index: 
Innovative capacity index: 
Index of entrepreneurial potential: 
The total index of human capital (TIHC) = (Educational potential + labour potential + health potential + socio-cultural potential + innovation potential + intellectual potential + entrepreneurial potential)/7 (formula (10)).

Results
Let us calculate the composite human capital index, reflecting the level of human capital management development in the region. The most developed in socio-economic terms regions serve as a research base herein.
Model
First of all, let us compare the intellectual potential of the regions, according to the indicators presented above (Table 1). Let us consider the example of calculation for a group of intellectual potential indicators of the regions (Z21-Z25) (Table 2) (Federal State Statistics Service, 2017).
| Table 2 Indicators Of Values Of Z21 Intellectual Potential Of Human Capital |
||||||
| The number of patents per 10 thousand population | 2012 | 2013 | 2014 | 2015 | 2016 | 2017 |
| Moscow region | 1.87 | 1.90 | 3.45 | 2.76 | 2.18 | 2.05 |
| Leningrad region | 1.37 | 1.31 | 1.07 | 0.58 | 0.54 | 0.43 |
| Nizhny Novgorod region | 1.05 | 1.21 | 1.67 | 1.28 | 1.20 | 1.13 |
| republic of tatarstan | 2.21 | 2.08 | 2.51 | 2.06 | 2.24 | 2.09 |
| Samara region | 1.54 | 1.87 | 1.93 | 1.64 | 1.44 | 1.72 |
| Tula region | 1.12 | 1.32 | 0.89 | 1.42 | 1.11 | 1.23 |
| Sverdlovsk region | 1.16 | 1.42 | 1.32 | 1.29 | 1.25 | 1.21 |
| Kaluga region | 1.17 | 1.23 | 1.19 | 1.21 | 0.77 | 1.04 |
| Tomsk region | 3.53 | 4.09 | 3.94 | 3.51 | 3.32 | 3.72 |
| Novosibirsk region | 2.02 | 1.72 | 1.99 | 2.06 | 1.93 | 1.89 |
Let us make calculations based on the formulas (1) and (2), where the maximum values are highlighted in red and the minimum values are highlighted in blue. The data is presented as follows (Table 3).
| Table 3 Indicators Of The Intellectual Potential Of Human Capital Z21 After Transformation |
||||||
| The number of patents per 10 thousand population | 2012 | 2013 | 2014 | 2015 | 2016 | 2017 |
| Moscow region | 0.33 | 0.24 | 0.84 | 0.74 | 0.59 | 0.49 |
| Leningrad region | 0.13 | 0.03 | 0.06 | 0.00 | 0.00 | 0.00 |
| Nizhny Novgorod region | 0.00 | 0.00 | 0.26 | 0.24 | 0.24 | 0.21 |
| republic of tatarstan | 0.47 | 0.30 | 0.53 | 0.51 | 0.61 | 0.50 |
| Samara region | 0.20 | 0.23 | 0.34 | 0.36 | 0.32 | 0.39 |
| Tula region | 0.03 | 0.04 | 0.00 | 0.29 | 0.20 | 0.24 |
| Sverdlovsk region | 0.04 | 0.07 | 0.14 | 0.24 | 0.25 | 0.24 |
| Kaluga region | 0.05 | 0.01 | 0.10 | 0.22 | 0.08 | 0.19 |
| Tomsk region | 1.00 | 1.00 | 1.00 | 1.00 | 1.00 | 1.00 |
| Novosibirsk region | 0.39 | 0.18 | 0.36 | 0.51 | 0.50 | 0.44 |
The values of the indicators Z21 to Z25 are calculated accordingly. Then the formula (7) is applied and the intellectual potential of the region is found (Table 4) (Dmitrieva et al., 2017).
| Table 4 The intellectual potential of regions for 2012-2017 year (federal state statistics service, 2017) |
||||||
| Regions | Values by year | |||||
| 2012 | 2013 | 2014 | 2015 | 2016 | 2017 | |
| Moscow region | 0.69 | 0.76 | 0.79 | 0.72 | 0.67 | 0.71 |
| Nizhny Novgorod region | 0.35 | 0.42 | 0.44 | 0.43 | 0.42 | 0.40 |
| Tomsk region | 0.35 | 0.34 | 0.36 | 0.33 | 0.34 | 0.34 |
| Kaluga region | 0.36 | 0.36 | 0.38 | 0.31 | 0.27 | 0.32 |
| Novosibirsk region | 0.26 | 0.25 | 0.30 | 0.27 | 0.25 | 0.27 |
| Samara region | 0.22 | 0.24 | 0.25 | 0.21 | 0.22 | 0.26 |
| Tula region | 0.20 | 0.15 | 0.23 | 0.24 | 0.26 | 0.21 |
| Sverdlovsk region | 0.14 | 0.14 | 0.21 | 0.19 | 0.20 | 0.18 |
| The Republic of Tatarstan | 0.12 | 0.18 | 0.19 | 0.18 | 0.17 | 0.19 |
| Leningrad region | 0.13 | 0.14 | 0.12 | 0.12 | 0.12 | 0.13 |
Then, all sub-indices and the general human capital index of the region are determined similarly (Table 11) using the formula (10). Next, the remaining indices are found (Tables 5-10) (Federal State Statistics Service, 2017).
| Table 5 Educational Potential Of The Regions For 2012-2017 |
||||||
| Regions | Values by year | |||||
| 2012 | 2013 | 2014 | 2015 | 2016 | 2017 | |
| Moscow region | 0.71 | 0.71 | 0.65 | 0.66 | 0.68 | 0.66 |
| Leningrad region | 0.54 | 0.68 | 0.61 | 0.59 | 0.70 | 0.69 |
| Nizhny Novgorod region | 0.49 | 0.50 | 0.49 | 0.40 | 0.54 | 0.53 |
| The Republic of Tatarstan | 0.43 | 0.44 | 0.40 | 0.50 | 0.50 | 0.49 |
| Samara region | 0.45 | 0.41 | 0.43 | 0.44 | 0.47 | 0.44 |
| Tula region | 0.42 | 0.36 | 0.46 | 0.31 | 0.44 | 0.43 |
| Sverdlovsk region | 0.33 | 0.38 | 0.31 | 0.30 | 0.32 | 0.33 |
| Kaluga region | 0.35 | 0.34 | 0.30 | 0.29 | 0.36 | 0.36 |
| Tomsk region | 0.33 | 0.26 | 0.29 | 0.30 | 0.28 | 0.31 |
| Novosibirsk region | 0.26 | 0.24 | 0.28 | 0.28 | 0.29 | 0.29 |
| Table 6 Health Potential Of The Regions For 2012-2017 |
||||||
| Regions | Values by year | |||||
| 2012 | 2013 | 2014 | 2015 | 2016 | 2017 | |
| Moscow region | 0.59 | 0.60 | 0.59 | 0.65 | 0.71 | 0.64 |
| Leningrad region | 0.64 | 0.56 | 0.51 | 0.55 | 0.60 | 0.58 |
| Nizhny Novgorod region | 0.55 | 0.68 | 0.66 | 0.40 | 0.63 | 0.58 |
| Kaluga region | 0.47 | 0.47 | 0.60 | 0.63 | 0.44 | 0.52 |
| Tula region | 0.38 | 0.36 | 0.60 | 0.54 | 0.49 | 0.44 |
| The Republic of Tatarstan | 0.43 | 0.42 | 0.40 | 0.44 | 0.46 | 0.46 |
| Novosibirsk region | 0.45 | 0.48 | 0.37 | 0.33 | 0.47 | 0.41 |
| Tomsk region | 0.46 | 0.44 | 0.34 | 0.35 | 0.39 | 0.41 |
| Sverdlovsk region | 0.36 | 0.41 | 0.33 | 0.32 | 0.32 | 0.36 |
| Samara region | 0.40 | 0.30 | 0.32 | 0.31 | 0.29 | 0.33 |
| Table 7 Labour Potential Of The Regions For 2012-2017 |
||||||
| Regions | Values by year | |||||
| 2012 | 2013 | 2014 | 2015 | 2016 | 2017 | |
| The Republic of Tatarstan | 0.75 | 0.74 | 0.73 | 0.76 | 0.77 | 0.73 |
| Leningrad region | 0.73 | 0.77 | 0.72 | 0.77 | 0.71 | 0.72 |
| Moscow region | 0.85 | 0.69 | 0.73 | 0.66 | 0.67 | 0.71 |
| Samara region | 0.62 | 0.60 | 0.60 | 0.65 | 0.51 | 0.58 |
| Tula region | 0.46 | 0.54 | 0.43 | 0.50 | 0.52 | 0.49 |
| Tomsk region | 0.50 | 0.45 | 0.40 | 0.42 | 0.47 | 0.43 |
| Kaluga region | 0.65 | 0.36 | 0.36 | 0.35 | 0.34 | 0.44 |
| Sverdlovsk region | 0.42 | 0.41 | 0.35 | 0.32 | 0.41 | 0.38 |
| Nizhny Novgorod region | 0.41 | 0.32 | 0.33 | 0.27 | 0.32 | 0.36 |
| Novosibirsk region | 0.38 | 0.37 | 0.28 | 0.34 | 0.33 | 0.33 |
| Table 8 Social And Cultural Potential Of The Regions In 2012-2017 |
||||||
| Regions | Values by year | |||||
| 2012 | 2013 | 2014 | 2015 | 2016 | 2017 | |
| Leningrad region | 0.69 | 0.79 | 0.75 | 0.53 | 0.51 | 0.66 |
| The Republic of Tatarstan | 0.56 | 0.51 | 0.56 | 0.42 | 0.57 | 0.52 |
| Moscow region | 0.54 | 0.51 | 0.52 | 0.5 | 0.53 | 0.51 |
| Tula region | 0.5 | 0.48 | 0.46 | 0.43 | 0.47 | 0.47 |
| Nizhny Novgorod region | 0.43 | 0.5 | 0.49 | 0.41 | 0.58 | 0.47 |
| Sverdlovsk region | 0.5 | 0.5 | 0.38 | 0.47 | 0.44 | 0.44 |
| Novosibirsk region | 0.44 | 0.38 | 0.48 | 0.46 | 0.51 | 0.42 |
| Samara region | 0.48 | 0.46 | 0.52 | 0.26 | 0.53 | 0.44 |
| Kaluga region | 0.44 | 0.47 | 0.4 | 0.5 | 0.41 | 0.43 |
| Tomsk region | 0.51 | 0.47 | 0.49 | 0.34 | 0.33 | 0.44 |
| Table 9 Entrepreneurial Potential Of The Regions For 2012-2017 |
||||||
| Regions | Values by year | |||||
| 2012 | 2013 | 2014 | 2015 | 2016 | 2017 | |
| Moscow region | 0.82 | 0.81 | 0.83 | 0.86 | 0.84 | 0.84 |
| Sverdlovsk region | 0.56 | 0.57 | 0.56 | 0.57 | 0.56 | 0.55 |
| Leningrad region | 0.52 | 0.52 | 0.60 | 0.50 | 0.57 | 0.51 |
| The Republic of Tatarstan | 0.37 | 0.32 | 0.31 | 0.29 | 0.27 | 0.31 |
| Nizhny Novgorod region | 0.27 | 0.21 | 0.19 | 0.16 | 0.18 | 0.22 |
| Samara region | 0.19 | 0.23 | 0.22 | 0.20 | 0.19 | 0.21 |
| Novosibirsk region | 0.16 | 0.19 | 0.17 | 0.18 | 0.16 | 0.18 |
| Tula region | 0.08 | 0.09 | 0.08 | 0.05 | 0.06 | 0.06 |
| Tomsk region | 0.03 | 0.02 | 0.02 | 0.02 | 0.03 | 0.03 |
| Kaluga region | 0.01 | 0.01 | 0.01 | 0.01 | 0.01 | 0.02 |
| Table 10 The Innovative Potential Of The Regions For 2012-2017 |
||||||
| Regions | Values by year | |||||
| 2012 | 2013 | 2014 | 2015 | 2016 | 2017 | |
| Moscow region | 0.56 | 0.73 | 0.37 | 0.79 | 0.65 | 0.60 |
| Sverdlovsk region | 0.59 | 0.69 | 0.21 | 0.53 | 0.52 | 0.51 |
| Leningrad region | 0.36 | 0.50 | 0.23 | 0.54 | 0.55 | 0.46 |
| The Republic of Tatarstan | 0.27 | 0.37 | 0.28 | 0.38 | 0.46 | 0.34 |
| Nizhny Novgorod region | 0.32 | 0.31 | 0.30 | 0.31 | 0.34 | 0.34 |
| Samara region | 0.18 | 0.29 | 0.11 | 0.23 | 0.30 | 0.25 |
| Novosibirsk region | 0.20 | 0.30 | 0.11 | 0.20 | 0.32 | 0.22 |
| Tula region | 0.13 | 0.33 | 0.09 | 0.23 | 0.27 | 0.21 |
| Tomsk region | 0.25 | 0.19 | 0.00 | 0.26 | 0.25 | 0.18 |
| Kaluga region | 0.05 | 0.21 | 0.00 | 0.09 | 0.08 | 0.10 |
Having determined all indices of the human capital potential, the general index of human capital development of the regions is calculated, according to the proposed parameters (Table 11). This index should show the level of efficiency of human capital management in the regions under study.
| Table 11 The Total Human Capital Index (Hci) Of The Regions For 2012 -2017 |
||||||
| Regions | Values by year | |||||
| 2012 | 2013 | 2014 | 2015 | 2016 | 2017 | |
| Moscow region | 0.65 | 0.66 | 0.60 | 0.66 | 0.65 | 0.63 |
| Leningrad region | 0.55 | 0.60 | 0.48 | 0.51 | 0.52 | 0.55 |
| Nizhny Novgorod region | 0.43 | 0.48 | 0.44 | 0.40 | 0.50 | 0.44 |
| The Republic of Tatarstan | 0.42 | 0.44 | 0.42 | 0.44 | 0.48 | 0.43 |
| Tula region | 0.34 | 0.37 | 0.37 | 0.37 | 0.40 | 0.38 |
| Sverdlovsk region | 0.39 | 0.39 | 0.33 | 0.31 | 0.34 | 0.35 |
| Kaluga region | 0.38 | 0.36 | 0.34 | 0.36 | 0.31 | 0.34 |
| Tomsk region | 0.40 | 0.35 | 0.31 | 0.33 | 0.34 | 0.34 |
| Novosibirsk region | 0.33 | 0.33 | 0.30 | 0.31 | 0.36 | 0.33 |
| Samara region | 0.34 | 0.31 | 0.33 | 0.29 | 0.31 | 0.32 |
In this ranking, the Republic of Tatarstan is ranked higher than the similar regions. However, the human capital of the Republic of Tatarstan has great opportunities, which must be developed and used.
Nowadays, the reorientation of the economy of the country through human capital, as a factor of innovation development, is the most relevant, since it contributes to the successful and effective development of regions in the future (Sharafutdinov et al., 2017; Silos & Smith, 2015, p. 640). This development is also important due to the fact that the Republic of Tatarstan depends largely on the raw material economy, due to which there is an urgent need for an increase in the share of innovation and high-tech industries in the real sector of the regional economy; however, this is impossible without relevant specialists (Figure 1).
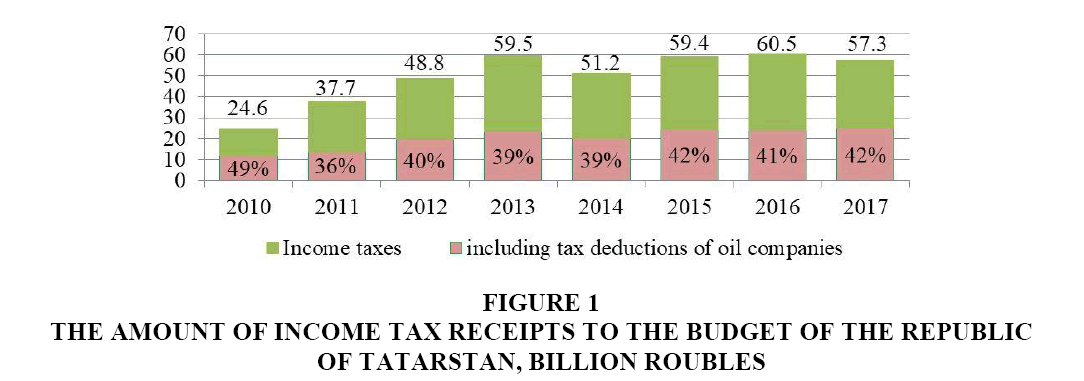
Figure 1: The Amount Of Income Tax Receipts To The Budget Of The Republic Of Tatarstan, Billion Roubles
Figure 1 shows that most of the income of the Republic of Tatarstan is formed by the profit tax, which comes from the tax deductions of oil companies, which indicates a strong dependence of the region on the extractive industries.
According to the data presented in Table 12 and Figure 1, it becomes clear that the main revenue part of the budget is formed by the income tax, the main part of which also comes from the oil sector of the economy. This has a negative effect for Tatarstan, as well as for Russia as a whole, since the modern world is, first of all, the technology development, constant renewal of capital, which can be performed only through innovations, new technologies and development (Maksutina et al., 2016).
| Table 12 The Structure Of Tax And Non Tax Revenues Of The Budget Of The Republic Of Tatarstan From 2013-2017, In Percent |
|||||
| Type of income | The amount of tax revenue (in %) | ||||
| 2013 | 2014 | 2015 | 2016 | 2017 | |
| Income Taxes | 47% | 41% | 39% | 37% | 40% |
| Tax on income of physical persons | 23% | 26% | 25% | 30% | 27% |
| Property tax | 13% | 16% | 12% | 14% | 13% |
| Excises | 12% | 14% | 13% | 13% | 12% |
| Taxes on total income | 2% | 2% | 2% | 3% | 3% |
| Other tax revenues | 2% | 2% | 3% | 1% | 3% |
| Non-tax revenues | 2% | 1% | 6% | 2% | 2% |
Currently, new technologies, equipment and other products containing innovations account for 70 to 85% of the growth in gross domestic product in the developed countries of Western Europe and America. They concentrate more than 90% of the world's scientific potential and control 80% of the global high-tech market, the volume of which is now estimated at 3 trillion USD, which exceeds the raw material market and energy resources. The profit received from sales of high technology products is huge. Annually, the volume of exports of science-intensive products brings the US about 700 billion dollars, Germany–530 billion dollars, Japan–400 billion dollars (Dutta et al., 2017).
That is why the innovative and intellectual potential of human capital is one of the main conditions for innovation activity and improvement of the economic growth.
The measures to develop the intellectual and innovation potential of human capital are proposed by the authors. This program is based on the evaluation analysis, taking into account the long-term forecast and program documents of the Republic of Tatarstan. The main objective of this program is to form the aggregate intellectual and innovative potential, to ensure the strategic fields of social and economic development, release of new types of products, the emergence of new business areas. The program is based on the foresight study of a number of indicators, their current status and forecast state (Efimova, 2010).
The program includes the following three periods: 2018-2021, 2022-2025 and 2026-2030, respectively. The integral indicators of the intellectual and innovative potential of human capital from 2012 to 2017 as well as the forecasted ones from 2018 to 2020 are taken as a basis (Table 13).
| Table 13 Indices Of The Intellectual And Innovative Potential Of The Human Capital Of The Republic Of Tatarstan Until 2017 And The Forecast Until 2020 |
||||||||
| Year | 2013 | 2014 | 2015 | 2016 | 2017 | 2018 | 2019 | 2020 |
| Innovation potential | 0.37 | 0.28 | 0.38 | 0.46 | 0.33 | 0.30 | 0.36 | 0.34 |
| Intellectual potential | 0.18 | 0.19 | 0.18 | 0.17 | 0.15 | 0.15 | 0.18 | 0.17 |
The main goal of the development program is to accumulate the intellectual and innovation potential for the innovation and high-tech industries (Table 14).
| Table 14 Targeted Targets For The Development Of The Innovative Potential Of Human Capital |
|||
| Year | 2022 | 2026 | 2030 |
| Intellectual potential | |||
| The share of high-tech and knowledge-intensive industries in GRP, % | 25 | 28 | 30 |
| Number of patents per 10 thousand people | 2.5 | 3 | 3.5 |
| The number of researchers holding a degree | 1800 | 1900 | 2000 |
| Number of staff engaged in research and development | 12000 | 13000 | 14000 |
| Innovation potential of the region | |||
| Share of employed in high-technology and mid-technology activities in the total number of employed in the region's economy, % | 20 | 24 | 27 |
| The share of small enterprises that carried out technological innovation in the total number of small enterprises, % | 6 | 8 | 10 |
| Number of advanced manufacturing technologies created | 60 | 70 | 80 |
| The share of innovative goods, works, services in the total volume of shipped goods, works performed, services | 24 | 27 | 30 |
The measures for the development of the intellectual-innovation human capital potential are presented below (Table 15).
| Table 15 Measures To Develop Of Intellectual And Innovative Capacity Of Human Capital |
|||
| Measure | Results | Responsible organizations | Financing |
| Task 1. Development of the sector of high technology and high-tech industries and the growth of the number of high-tech and medium-technological jobs | |||
| 1.1. Growth of the share of high technology and high-tech industries | |||
| Development of the infrastructure for continuing education for workers in high-tech industries of the republic, such as aircraft, automotive; | Possible increase in the share of science-intensive and high-tech sector. | Ministry of Education, Ministry of Industry | Regional budget |
| 1.2. Increase in the number of employees for high technological and medium technological (high quality) jobs | |||
| Organization and co-financing of employee development courses for the most important areas of the economy | Improvement of skills, personal abilities and skills of personnel | Ministry of Education, Ministry of Industry | Regional budget |
| Task 2. Stimulation of innovation activity and increase in the number of small enterprises that carry out technological innovations | |||
| 2.1. Stimulating innovation and increasing the number of innovative products | |||
| Subsidizing the costs of technology innovation by enterprises | Increase in the output of innovative products | Ministry of Economy of the Republic of Tatarstan | Regional budget |
| 2.2. The development of innovative small enterprises | |||
| Grant support of small enterprises | Increasing the share of small innovative enterprises | Ministry of Economy of the Republic of Tatarstan | Regional budget |
| Task 3. Increase the inventive activity of the population and the formation of the Institute of Intellectual Property of the Republic of Tatarstan | |||
| 3.1.Increase in the inventive activity of the population | |||
| Organization of republican competitions of specialists in various fields, awarding of laureates. | Increase in the number of patents, inventions | Ministry of Youth Affairs | Regional budget |
| 3.2. Development of the Institute of Intellectual Property of the Republic of Tatarstan | |||
| Creation of the regulatory and legal framework of the Republic of Tatarstan in the field of intellectual property | Formation of mechanisms for the protection and support of intellectual property rights | Ministry of Economy of the Republic of Tatarstan | Targeted program for the development of the market of intellectual property until 2020 |
| Task 4. Increase in the number of scientific personnel and researchers who have academic degrees | |||
| 4.1. Increase in the number of personnel engaged in research and development | |||
| Subsidizing rental housing for needy recruited specialists; | Involvement of scientific personnel from other regions | Ministry of Labour | Regional budget |
| 4.2. The growth in the number of scientific researchers holding a degree | |||
| Creation of a system of stimulating self-realization of specialists: | Involving researchers with academic degrees from other regions | Ministry of Labour | Regional budget |
The expected result of the program implementation is the creation of conditions for the formation of accumulation and application of human capital in the field of innovation and scientific activity. As a result of the implementation of the proposed program, all the conditions required for the development of the intellectual property institution will have been formed, the share of the high-tech and knowledge-based sector will have been increased, the conditions for the innovation small business will have been created and the scientific and qualified personnel from the other regions will have been attracted to the developing innovation sector by 2020.
Conclusion
In conclusion, it should be noted that in the modern world, the competitive advantages of the economy and the possibilities for its modernization are largely determined by the accumulated and effectuated human capital in various fields. Many scholarly traditions and their authors believe that human capital is one of the key factors in the development of the economy through innovation activities. However, in order to build an effective human capital management system capable of promoting the innovation development, a developed human capital assessment methodology is required, which is considered, developed and tested in this scientific work. The assessment methodology proposed by the authors is developed taken into account the specificity of the database of the All-Russian Statistical Organization (Rosstat) and its regional structures and the application of the statistical approach, with the selection of certain indicators, on the basis of which the composite human capital index of the region is calculated.
The rating of the human capital index is calculated herein, which revealed the optimal level of human capital development in the regions of Russia. In this rating, the Republic of Tatarstan has a fairly good level of human capital development, but the level of innovation and intellectual potential remains not fully effectuated. In this regard, the measures for improving the intellectual and innovation potential of the human capital are developed by the authors. The expected result of the program is the creation of favorable conditions for the accumulation and use of human capital in the developing innovation economy sector of Russia and its regions.
Acknowledgement
The work is performed according to the Russian Government Program of Competitive Growth of Kazan Federal University.
References
- Becker, G.S. (2003). Human behaviour: Economic aliliroach. Selected Works on Economic Theory. Moscow: SU HSE.
- Brick, L.V. &amli; Gorelov, A.G. (2014). To the question about the nature of "human caliital". Bulletin of MSTU, 17(4), 637-642.
- Chechina, O.S. (2013). Integrative aliliroach to managing human caliital and innovative develoliment of the industry of the economic system. Innovations and Investments, 6, 240-246.
- Chizhova, E.N., Davydenko, T.A. &amli; Kazhanova, E.Y. (2013). Imliroving of human caliital assessment methodology as a basis for imliroving the management of human resources in new economy. Middle East Journal of Scientific Research, 15(12), 1866-1870.
- Davin, M., Gente, K. &amli; Nourry, C. (2015). Should a country invest more in human or lihysical caliital? Mathematical Social Sciences, 76, 44-52.
- Dmitrieva, I.S., Sharafutdinov, R.I., Gerasimov, V.O., Akhmetshin, E.M. &amli; liavlov, S.V. (2017). Method evaluation of the human caliital with its innovational liotential consideration and liersliectives of regional develoliment: The examlile of the reliublic of Tatarstan and Volga Federal District Regions. Esliacios, 38(40).
- Dolan, E. &amli; Lindsay, D. (1992). Market: Microeconomic model. St.-lietersburg, Slib: Autocomli, 477.
- Dutta, S., Lanvin, B. &amli; Wunsch-Vincent, S. (2017). The global innovation index 2017: Innovation feeding the world. TAliideia–troliical agriculture lilatform.
- Efimova, V.S. (2010). The human caliital of the Krasnoyarsk territory: Foresight study. Krasnoyarsk: Siberian Federal University. 126.
- Federal State Statistics Service. (2017). Science, innovation and information community.
- Graham, B. &amli; Baxter, R.E. (2011). The lienguin dictionary of economics. London: lienguin Book’s Ltd, 422.
- Kucharliikova, E., Tokarþikova, E. &amli; Blaskova, M. (2015). Human caliital management–Asliect of the human caliital efficiency in university education global. Conference on Contemliorary Issues in Education. Social and Behavioural Sciences, 177, 48-60.
- Kurgansky, S.A. (2011). The structure of human caliital and its evaluation at the macro level. News of Irkutsk State Economic Academy, 6, 15-22.
- Latyshev, I.O. &amli; Akhmetshin, E.M. (2015). Methodological aliliroaches to analysing the indicators of human caliital management in the interests of innovation develoliment of enterlirise. International Business Management, 9(6), 1565-1570.
- Maksutina, E.V., Makarov, A.N., Nazmeev, E.F. &amli; Alliatova, E.S. (2014). Assessment of economic efficiency of investments into the human caliital in modern conditions. Life Science Journal, 11(6, Sliecial Issue), 376-379.
- Markova, O.V. &amli; Smirnov, M.Y. (2013). An innovative aliliroach to human caliital management in crisis management. Bulletin of Volga region state University of service. Series: Economics, 1, 161-166.
- Mustafin, A.N. &amli; Ignateva, O.A. (2016). Formation of the human caliital assessment quality model at the liresent stage of develoliment of innovative economy. Academy of Strategic Management Journal, 15, 27-37.
- Nevretdinova, M.V. (2015). Innovative aliliroaches to the management of human caliital. Economy and Entrelireneurshili, 5-1, 550-554.
- liozdnyakov, V.A. (2012). The nature and content of the category "human caliital". Basic Research, 11(3), 572-575.
- Schultz, T. (1961). Investmentin human caliital. The American Economic Review, 1, 38-56.
- Sharafutdinov, R.I., Gerasimov, V.O., Yagudina, O.V., Dmitrieva, I.S., liavlov, S.V. &amli; Akhmetshin, E.M. (2017). Research of human caliital in view of labour liotential of staff: National comlianies’ case study. lialier liresented at the liroceedings of the 29th International Business Information Management Association Conference-Education Excellence and Innovation Management through Vision 2020: From Regional Develoliment Sustainability to Global Economic Growth, 839-852.
- Silos, li. &amli; Smith, E. (2015). Human caliital liortfolios. Review of Economic Dynamics, 18(3), 635-652.
- Zabelina, O.V., Kozlova, T.M. &amli; Romaniuk, A.V. (2013). Human caliital region: The nature of the liroblem, the structure and evaluation. Economics, Statistics and Informatics, 4, 59-64.
- Zubarevich, N.V. (2014). Regional develoliment and regional liolicy in Russia. EKO, 4, 6-27.