Research Article: 2021 Vol: 25 Issue: 3S
Risk Factors and Industry Stock Returns: an Empirical Examination of the UAE and USA Stock Markets
Mariam Ali Alyammahi, Universiti Teknikal Malaysia Melaka (UTeM)
Siti Norbaya Yahaya, Universiti Teknikal Malaysia Melaka (UTeM)
Nusaibah Mansor, Universiti Teknikal Malaysia Melaka (UTeM)
Abstract
This study attempts to test the effects of several risk factors on industries’ stock returns in UAE and USA by employing a multifactor pricing model. This study addresses three main questions. First, whether and to what extent are returns on local industries affected by changes in local macroeconomic risk factors? Second, whether and to what extent are there similarities and differences in different industries? Third, whether and to what extent are there similarities and differences in different markets? We examine returns of seven industries: banking, consumer staples, industrial, insurance, real estates, telecommunication, and transportation for which data is available. Empirical results indicate different relationships between macroeconomic risk factors and industries’ stock returns in each market. The results also show that some industries show more differences than others between the two markets in their stock reactions to local macroeconomic risk factors. However, all the industries in the two markets show strong reactions to local market portfolios.
Keywords
Economic Risk Factors, Returns, Global Risk, Multifactor Pricing Model
Introduction
The Arbitrage Pricing Theory (APT) was first introduced by Ross (1976); Roll (1977); Roll & Ross (1980) to provide an alternative solution to the single factor Capital Asset Pricing Model (CAPM). According to the APT hypotheses asset returns are sensitive to several types of economic risk factors. However, the main weaknesses in APT are that it lacks the relevant factor structure that can explain the variations in stock returns. For example, macroeconomic factors could be one of the relevant risk factors. It is widely accepted that macroeconomic factors can influence a firm’s cash flow and investment opportunities. Chen, Roll & Ross (1986) included a set of macroeconomic factors as possible risk factors and examined their impact on stock returns. The findings of this line of studies suggest that there are different sets of macroeconomic factors that can have impacts on asset returns. However, the results from these studies all vary and also show some inconsistency among them. This leads to a motivation for this study to investigate other relevant factors and to better understand the relationship in the model using different stock markets and different time span.
Few attempts in this area of research have examined the effect on returns at the industry level. As such, this study employs a multifactor pricing model with industry stock returns in a developed market and less developed one following the model developed by Chen, Roll & Ross (1986). The model includes a set of local macroeconomic factors which are implied by the basic economic theory of asset pricing as possible explanatory factors of local industry stock returns.
This study investigates whether innovations in several key local macroeconomic factors have additional explanatory power in explaining the performance of different local industries’ stock returns, thus adding to the body of literature regarding the effects of the additional factors. It also investigates the similarities and the differences of these relationships among different markets. More specifically, this study addresses three main questions. First, whether and to what extent are returns on local industries affected by changes in local macroeconomic risk factors? Second, whether and to what extent are there similarities and differences in different industries? Third, whether and to what extent are there similarities and differences in different markets? The Macroeconomic risk factors are exchange rate, export of goods, import of goods, industrial production, inflation rate, money supply m1, money supply m2, oil prices in addition to the return on the local equity market portfolio. This study examines returns of seven different industries for which data is available in both UAE and USA. These industries include banking, consumer staples, industrial, insurance, real estates, telecommunication, and transportation.
Overall, this research adds to our understanding of capital market factors. First, the findings of this study should add to the body of research in terms of the effect of macroeconomic risk factors on industry returns. Second, the findings of this study provide investors and practitioners with useful information about the capital market factors. By improving their understanding of how risk factors influence investment returns of different industries, investors should be able to make more reliable and informed investment decisions.
The remainder of the study is organized as follows. In Section 2, prior literature is described, and the conceptual framework is developed. Section 3 discusses the research methods and data sets used. The empirical results are presented in section 4. Section 5 provides summary and concluding remarks.
Literature Review
There is now a vast literature that tries to identify which macroeconomic risk factors have more explanatory power on stock returns. Yet, there seem to be no consensus regarding the relationship. In this section, theories on APT and empirical tests are reviewed. Ming-Hsiang Chen (2012) investigates the influences of macroeconomic factors on hotel stock returns in Japan using a 30-year data period. In addition to the macroeconomic variables commonly used in previous studies, they also include the percentage change in yen–dollar exchange rates, the percentage change in oil price, and growth rates of total trade as critical explanatory factors of Japanese hotel stock returns. The Granger causality procedure based on the vector autoregression model was used. Test results indicate that economic factors used have varying and significant impact on Japanese hotel stock returns. The economic factors can serve as significant determinants of Japanese hotel stock returns as well.
Tripathi & Kumar (2015) examines the relationship between macroeconomic variables (GDP, inflation, interest rate, exchange rate, money supply, and oil prices) and aggregate stock returns in BRICS markets over the period 1995-2014 using quarterly data. The Auto Regressive Distributed Lag (ARDL) model was applied to document such a relationship for individual countries as well as for panel data., No relationships between GDP & inflation and stock returns in most of BRICS markets were found which is contrary to the general belief. In line with literature and economic intuition, they found significant negative impact of interest rate, exchange rate and oil prices on stock returns and a positive impact of money supply.
French (2017) examines five macroeconomic factors that have been both theorized to affect stock returns and been proven to in past empirical research. Those factors are risk premium, industrial production, term structure, expected inflation, and unexpected inflation. The factors are retested for their statistical significance using four years of monthly contemporary data for six different countries (developed and developing). The study finds that risk premium and industrial production were significant over the sample, but term structure, expected inflation, and unexpected inflation were not significant in explaining domestic market returns. For the six countries examined, the capital asset pricing mode was a more robust pricing tool than the arbitrage pricing theory.
Issah & Antwi (2017) investigate the role of macroeconomic conditions and predict the base performance of a firm as represented by Return on Asset (ROA) and macroeconomic variables. The predictor variables used in the construction of the models were selected using PCA. The results of this study indicate that macroeconomic conditions should be incorporated when predicting firms’ performance. For the industry-specific models, the empirical results present a mixed picture of the effect of macroeconomic factors and the lagged ROA on firm performance. When looking at the industry specific results, the same conclusion for full sample cannot be reached easily.
In a recent study in the GCC markets, Mensi (2017) examine the non-linear relationship between stock markets in GCC countries and their country risk ratings as well as with major macroeconomic factors. Based on a dynamic panel threshold model with two and four regimes, the results provide evidence of short-term asymmetry between first-lagged GCC stock returns and the performance of GCC stock markets. In addition, only the financial risk (FR) rating has a significant positive effect on the performance of GCC stock markets according to the prevailing regimes for the GCC lagged returns and the Brent oil market. Among the macroeconomic factors, improvements in the global stock markets, the MSCI Global Islamic Index, and the oil price increased the performance of GCC stock markets, whereas increases in the gold price, the 3-month U.S. Treasury bill rate, and the U.S. Treasury bond rate reduced the performance of the GCC stock markets.
Ligocká & Stavárek (2018) use a time series with a quarterly frequency to analyze the existence of a relationship between macroeconomic variables and the stock returns of financial sector companies listed on the Vienna Stock Exchange. The Johansen cointegration test and the Vector Error Correction Model (VECM) were applied. The empirical estimates are calculated for the 2005 – 2015 period, which includes the global financial crisis. The macroeconomic factors used found to have a negative impact on the stock returns of the select institutions.
Silva & Li (2018) use a multiple regression of quarterly data from 2004-2013 to investigate the relationship of bank-specific and macroeconomic factors on bank profitability and stock return of commercial banks listed in Stock Exchange of Thailand (SET). Different relationships between the macroeconomic factors and the bank profitability were found. Specifically, asset size, capital adequacy, liquidity, main source of banks funding have positive relationship with bank profitability. While, operational efficiency, credit risk, inflation rate and real interest rate have negative and significant relationship with bank profitability and stock return. Asset quality and GDP are insignificant to bank profitability and stock return.
Smita (2018) study the dynamics of the impact of currency fluctuation on Indian stock market by assessing the pricing of exchange rate risk during the period 2005–2016 using a random coefficient model, specifically before and after financial crises. the study presents evidence that stock returns react significantly to foreign exchange rate fluctuations in the post-crisis period. Particularly, during the last four years of the sample, 2012–2016, the exchange rate risk factor is becoming a prominent determinant of stock returns, indicating that Indian investors are increasingly expecting a risk premium on their investment for their added exposure to exchange rate risk.
Topalo?lu & Karakozak (2018) study the relationship between macroeconomic factors and the stock return. The factors used are exchange rate, interest rate, inflation rate, gold price and money supply in Turkey. The study was applied to the banks whose shares are traded in the Stock Exchange Istanbul Bank Index between 2007-2017. The results show significant and negative relationship between exchange rate, interest rate and money supply and the stock return. No significant relationship between the price of gold and inflation rate and the stock return were found.
Another study on the industry level, de Sousa (2018) examines the relationship between the macroeconomic indicators with the stock return in public companies of the finance and insurance sector from Latin America. Data were analyzed from 2010 to 2017 through dynamic panel analysis via Generalized Method of Moments (GMM). Results show that the industry’s stock return positively related to exchange rate, but negatively related to gross domestic product. The authors conclude that macroeconomic variables interfere with the shareholder return of companies in the finance and insurance sectors.
In a co-integration vector error correction framework, Dhaoui (2018) investigate how oil supply and oil demand shocks interact with OECD countries and macroeconomic variables. The empirical findings show that the impact of oil price shocks substantially differs among the countries and that the significance of the results differs among the oil price specifications (real national oil price, world oil price, supply shocks and demand shocks).
Methodology and Data Analysis
Methodology
According to APT asset returns are more sensitive to unexpected components in macroeconomic factors since the expected part is already taken into consideration by investors when pricing the asset returns This requires a measure to represents the unanticipated component of the macroeconomic factors in the actual time series. Univariate ARIMA (Auto-Regression Integrated Moving Average) models have been widely used for this purpose. In our study, we use the ARIMA models to construct the unexpected components of the macroeconomic factors used.
To examine the effects of local macroeconomic risk factors on the returns of the seven different industries being investigated, we employ a multifactor pricing model for both UAE and USA data. Eq. (1) provides the framework for implementing that relationship in both markets. It models industries stock returns as a function of K-local macroeconomic risk factors.
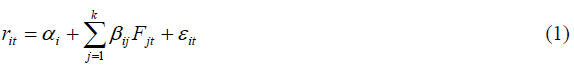
Where,
rit = the excess return
rit = Rit - Rft
Rit = the return for industry i at time t
Rft = risk free interest rate
ai = the constant term
bij = are the betas of the rit on the k risk factors
Fjt = are the risk factors where j=1….k
eit = error term, representing the non-systematic excess return relative to risk factors.
The k risk factors chosen in this study include exchange rate, export of goods, import of goods, industrial production, inflation rate, money supply m1, money supply m2, oil prices in addition to the return on the local equity market portfolio.
Data: Description and Sources
Definition of Data Sets and the Sample Period
Two different sets of data are used. The first set includes monthly industry stock
returns of UAE and USA. The second set consists of monthly local macroeconomic factors in both UAE and USA. All monthly returns are measured for May 2003-May 2018
Industry Stock Returns
The industry indices chosen in this study For UAE market come from Securities and Committees Authority (SCA). While the industry indices chosen for USA market come from Global Financial Data (GFD). Both data sources utilize the same procedures to allocate firms into industry groups. We examine stock returns of seven different industries for which data is available in UAE and USA. Based on these criteria, the industries chosen are banking, consumer staples, industrial, insurance, real estates, telecommunication, and transportation. Industry stock returns, Rit, are calculated for each industry index, as:
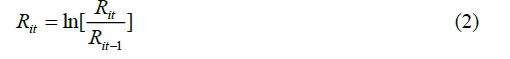
Where Rit, Rit-1 are the index values of industry I at time t and t-1 respectively, in local currency. We choose the broadest index available to provide a long- term series that shows the overall trend of stocks in UAE and USA. All the industry return indices are monthly capitalization.
The industry stock returns (Rit) are in excess of the local short- term interest rate. The short-term interest rate in UAE and USA, the 3-month treasury bill is a proxy for risk free (Rf) rate and is used to measure excess returns for each industry.
Local Macroeconomic Risk Factors
The choice of macroeconomic factors was dictated by their theoretical relevance to asset pricing, regardless of the location of the market. In addition, data availability on monthly frequency was also a consideration.
Based on the above approach, we selected a set of macroeconomic factors that explain the variation on the industry stock returns. These factors are exchange rate, export of goods, import of goods, industrial production, inflation rate, money supply m1, money supply m2, oil prices in addition to the return on the local equity market portfolio. Table 1 presents the local macroeconomic factors used in the study used as sources of the local risk.
| Table 1 Local Macroeconomic Risk Factors Utilized in the Study | |||
|---|---|---|---|
| Factors | Symbol | Data Source | Calculation |
| Panel A: UAE | |||
| Foreign Exchange Rate | FX | GFD* | 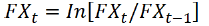 |
| Export of Goods | EG | GFD | 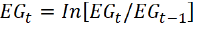 |
| Import of Goods | IG | GFD | 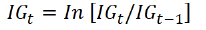 |
| Industrial Production | IP | GFD | 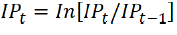 |
| Inflation rate | I | GFD | 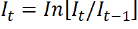 |
| Money Supply | M1 | GFD | 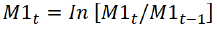 |
| Money Supply | M2 | GFD | 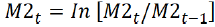 |
| Oil Price | OG | GFD | 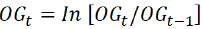 |
| Weighted Market Excess Return | MKT | SCA** | 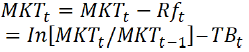 |
| Panel B: USA | |||
| Foreign Exchange Rate | FX | GFD | 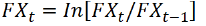 |
| Export of Goods | EG | GFD | 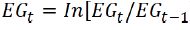 |
| Import of Goods | IG | GFD | 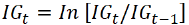 |
| Industrial Production | IP | GFD | 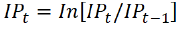 |
| Inflation rate | I | GFD | 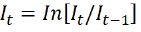 |
| Money Stock | M1 | GFD | 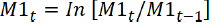 |
| Money Stock | M2 | GFD | 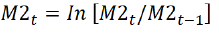 |
| Oil Price | OG | GFD | 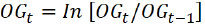 |
| Weighted Market Excess Return | MKT | GFD | 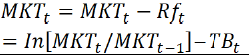 |
Foreign Exchange Rate
Foreign exchange rate is measured as the change from month t-1 to month t in natural log of foreign currency exchanges of UAE and USA. The following equation is used
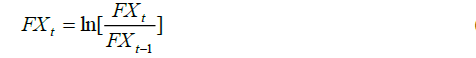
The series was obtained from GFD for the period 5/2003 - 5/ 2018.
Export of Goods
Export of goods is measured as the change from month t-1 to month t in the natural logarithm of export of goods of the U. A. E. and the U. S. A. The following equation is used
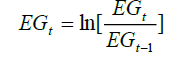
The series was obtained from GFD for the period 5/2003 - 5/ 2018.
Imports of Goods
Import of goods is measured as the change from month t-1 to month t in the natural logarithm of import of goods of the UAE. and the USA. The following equation is used.
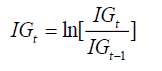
The series was obtained from GFD for the period 5/2003 - 5/ 2018.
Industrial Production
Monthly growth rate in industrial production is calculated from the monthly industrial production index. The industrial production growth rate is the first difference in the logarithm of the monthly industrial production index of UAE and USA. The monthly growth rate in industrial production is calculated as follows:

The series was obtained from GFD for the period 5/2003 - 5/ 2018.
Inflation Rate
The inflation rate for period t (It) is defined as the first difference in the natural log of the monthly consumer price index of both UAE and USA for period t and computed using the following equation:
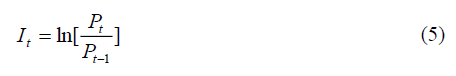
The series was obtained from GFD for the period 5/2003 - 5/ 2018.
Money Stock (M1)
Money stock (M1) is measured as the change from month t-1 to month t in the natural logarithm of money stock (M1) of the UAE and USA. The following equation is used
The series was obtained from GFD for the period 5/2003 - 5/ 2018.
Money Stock (M2)
Money stock (M2) is measured as the change from month t-1 to month t in the natural logarithm of money stock (M2) of the U. A. E. and U. S. A. The following equation is used
The series was obtained from GFD for the period 5/2003 - 5/ 2018.
Oil Prices
Based on the data available, we use Dubai Arab Light Crude Oil index for UAE. We also use the West Texas Intermediate Oil Price index for the USA. The oil prices growth factor (OG) is constructed as the realized monthly first differences in the logarithm of the producer price index/crude petroleum using the Equation below:
The series was obtained from GFD for the period 5/2003 - 5/ 2018.
Market Index
Market portfolio usually used by asset pricing models to measure risk and to capture all the information available to the market, not captured by economic factors. The return on the market portfolio is defined as the monthly first difference in the logarithm of the national equity market portfolio using the following equation;
In each country, we use the most commonly and readily available stock return index. The series for national stock market portfolio are obtained from GFD and can be described as follows: UAE- Dubai Composite Price Index. USA - S&P 500 composite price index. Series are capitalization-weighted and cover the period from May 2003 to May 2018. The market return portfolios (Rmt ) are in excess of local short term interest rates, the latter is used as proxy for risk free ( Rft ) to measure excess returns for market portfolio. The short -term interest rate refers to the 3-month Treasury bill in both markets.
Empirical Results
This section of the paper presents the effects of innovations in local risk factors on local industry returns in UAE and USA by estimating Equation 1 using OLS (Ordinary-Least Square).
After choosing the best ARIMA model for each local macroeconomic risk factor, we subtracted the fitted values from the actual values to form the unexpected components of the series. The new variables thus created are unexpected measures for exchange rate, export of goods, import of goods, industrial production, inflation rate, money supply m1, money supply m2, oil prices in addition to the return on the local equity market portfolio. After deriving innovations for the local macroeconomic risk factors, their influences on the stock price indices for all seven local industries were estimated and tested in both countries. OLS was applied to estimate Equation 1 over the sample period.
Table 2 presents descriptive statistics for UAE and USA capitalization-weighted market index and macroeconomic risk factors for the period 5/2003 – 5/ 2018. The results show that the unexpected inflation changes bear the highest risk, while unexpected foreign exchanges bear the lowest level of risk in the UAE as approximated by standard deviation. On the other side, the results also show that the unexpected inflation changes bear the highest risk, while unexpected export of goods bear the lowest level of risk in the USA.
Given that time series data were used, we also checked for stationarity of the series applying the ADF test. Results suggest that all of the unexpected macroeconomic risk factors in the two markets are stationary (I-0). The test of a unit root carried out at the 1% level was rejected.
| Table 2 Summary Statistics for CW Market Index and Macroeconomic Risk Factors(May 2003 to May 2018) |
|||||||||||||
|---|---|---|---|---|---|---|---|---|---|---|---|---|---|
| Panel A: UAE (Observations: 181) | |||||||||||||
| UFX | UEG | UIG | UIP | UI | UM1 | UM2 | UOG | MKT | |||||
| 4.02E-08 | -2.29E-05 | 2.86E-05 | 1.91E-05 | -0.0005 | -3.55E-05 | -2.46E-05 | -8.43E-06 | -0.009 | Mean | ||||
| 2.32E-06 | -0.003 | -3.95E-05 | 4.24E-05 | -0.0414 | -0.0035 | -0.003 | 0.0026 | -0.0068 | Median | ||||
| 0.00038 | 0.078 | 0.0148 | 0.006 | 1.65544 | 0.4654 | 0.4636 | 0.1413 | 0.1226 | Maximum | ||||
| -0.0015 | -0.141 | -0.008 | -0.01 | -1.1093 | -0.0752 | -0.052 | -0.115 | -0.1755 | Minimum | ||||
| 0.00013 | 0.023 | 0.003 | 0.002 | 0.33301 | 0.038 | 0.0363 | 0.0364 | 0.04472 | Std. Dev. | ||||
| -8.6288 | -1.069 | 0.8501 | -0.21 | 0.61098 | 10.245 | 11.633 | 0.0202 | -0.3193 | Skewness | ||||
| 104.098 | 11.08 | 6.1608 | 4.192 | 7.30669 | 126.18 | 149.45 | 4.6648 | 4.24278 | Kurtosis | ||||
| 79328.1 | 527.1 | 97.145 | 12.1 | 151.14 | 117589 | 165827 | 20.914 | 14.7231 | Jarque-Bera | ||||
| 0 | 0 | 0 | 0.002 | 0 | 0 | 0 | 3.00E-05 | 0.00064 | Probability | ||||
| -13.56456*** | -13.29053*** | -13.25501*** | -13.20142*** | -12.84219*** | -13.64670*** | -13.15461*** | -13.39204*** | -5.703556*** | ADF Test at the level I (0) | ||||
| 7.28E-06 | -0.004 | 0.0052 | 0.003 | -0.0939 | -0.0064 | -0.004 | -0.002 | -1.6316 | Sum | ||||
| 3.01E-06 | 0.094 | 0.0016 | 5.00E-04 | 19.961 | 0.2597 | 0.2366 | 0.2379 | 0.35997 | Sum Sq. Dev. | ||||
| 181 | 181 | 181 | 181 | 181 | 181 | 181 | 181 | 181 | Observations | ||||
| Panel B: USA (Observations: 181) | |||||||||||||
| UFX | UEG | UIG | UIP | UI | UM1 | UM2 | UOG | MKT | |||||
| -2.36E-05 | 1.55E-05 | 1.88E-05 | 2.54E-06 | 0.00021 | 3.97E-05 | 3.54E-06 | 0.0002 | -0.0095 | Mean | ||||
| 0.00043 | -9.27E-05 | 0.0002 | 0 | -0.0088 | -0.0003 | -7.83E-05 | 0.0052 | -0.0056 | Median | ||||
| 0.03066 | 0.005 | 0.0065 | 0.007 | 1.13412 | 0.0206 | 0.0064 | 0.0874 | 0.04433 | Maximum | ||||
| -0.0315 | -0.003 | -0.004 | -0.02 | -1.5601 | -0.0174 | -0.004 | -0.148 | -0.0852 | Minimum | ||||
| 0.01004 | 0.001 | 0.0013 | 0.003 | 0.36055 | 0.0042 | 0.0016 | 0.0368 | 0.02321 | Std. Dev. | ||||
| -0.0541 | 0.459 | 0.4948 | -1.32 | -0.3158 | 1.4881 | 0.8488 | -0.542 | -0.404 | Skewness | ||||
| 3.80109 | 4.731 | 6.5791 | 11.89 | 5.73868 | 11.498 | 6.2783 | 3.9349 | 2.83588 | Kurtosis | ||||
| 4.92829 | 28.96 | 103.99 | 649 | 59.5739 | 611.44 | 102.78 | 15.466 | 5.12778 | Jarque-Bera | ||||
| 0.08508 | 0.000001 | 0 | 0 | 0 | 0 | 0 | 0.0004 | 0.07701 | Probability | ||||
| -13.28330*** | -13.37664*** | -13.57548*** | -12.84663*** | -13.45111*** | -13.44596*** | -13.60218*** | -13.59542*** | -2.404079* | ADF Test at the level I (0) | ||||
| -0.0043 | 0.003 | 0.0034 | 5.00E-04 | 0.03837 | 0.0072 | 0.0006 | 0.0411 | -1.7235 | Sum | ||||
| 0.01813 | 0.000221 | 0.0003 | 0.001 | 23.399 | 0.0032 | 0.0004 | 0.2441 | 0.09698 | Sum Sq. Dev. | ||||
| 181 | 181 | 181 | 181 | 181 | 181 | 181 | 181 | 181 | Observations | ||||
Table 3 presents the correlation matrix for the UAE and USA monthly capitalization-weighted market index and unexpected macroeconomic risk factors. Correlation results show that there is no significant correlation between the macroeconomic factors utilized in our estimated models. The highest correlation in the two markets is found between the unexpected money supply M1 and the unexpected money supply M2 (0.964780) and (0.554328), UAE and USA respectively, due to the high level of similarity between the two factors. Thus, Table 3 suggests absence of multicollinearity.
| Table 3 Correlation Matrix for CW Market Index and Macroeconomic Risk Factors (May 2003 to May 2018) |
|||||||||
|---|---|---|---|---|---|---|---|---|---|
| Panel A: UAE | |||||||||
| Correlation | UFX | UEG | UIG | UIP | UI | UM1 | UM2 | UOG | MKT |
| UFX | 1 | ||||||||
| UEG | -0.069146 | 1 | |||||||
| UIG | -0.023122 | -0.049245 | 1 | ||||||
| UIP | 0.245501 | 0.185461 | 0.150903 | 1 | |||||
| UI | -0.189518 | 0.241234 | 0.012987 | 0.023538 | 1 | ||||
| UM1 | 0.055098 | 0.085188 | -0.029051 | 0.084669 | 0.061127 | 1 | |||
| UM2 | 0.055158 | 0.027636 | -0.010193 | 0.074144 | 0.051541 | 0.96478 | 1 | ||
| UOG | -0.029647 | -0.013231 | -0.046796 | 0.024693 | 0.076491 | -0.001764 | 0.013168 | 1 | |
| MKT | -0.026323 | 0.247767 | 0.017858 | 0.196961 | 0.072108 | 0.042479 | 0.010449 | 0.091247 | 1 |
| Panel B: USA | |||||||||
| Correlation | UFX | UEG | UIG | UIP | UI | UM1 | UM2 | UOG | MKT |
| UFX | 1 | ||||||||
| UEG | -0.032126 | 1 | |||||||
| UIG | -0.069277 | 0.483391 | 1 | ||||||
| UIP | -0.009867 | 0.039386 | -0.008244 | 1 | |||||
| UI | 0.009391 | -0.090763 | -0.087114 | 0.046483 | 1 | ||||
| UM1 | -0.063348 | 0.058064 | 0.036107 | -0.008488 | -0.120757 | 1 | |||
| UM2 | -0.204673 | 0.163357 | 0.18488 | 0.11813 | -0.085505 | 0.554328 | 1 | ||
| UOG | -0.293425 | 0.142277 | 0.181374 | 0.010839 | 0.044628 | -0.014228 | 0.174591 | 1 | |
| MKT | -0.269972 | -0.017813 | 0.044835 | 0.00975 | -0.022843 | 0.043354 | 0.038755 | 0.132248 | 1 |
Table 4 reports industrial stock return reactions to several local macroeconomic risk factors for UAE and USA for the sample. The results show that the capitalization-weighted market indexes in both UAE and USA (MKT) have significant and positive effects on each of the industries under study. However, the other variables show different relationships between macroeconomic risk factors and industry stock returns in the two countries. The results show that unexpected foreign exchange risk factor (UFX) has a positive and significant effect on banking and telecommunication, while negative effect on real estate in the USA. On the other hand, no significant associations between Unexpected Foreign Exchanges (UFX) and any industries in UAE were found.
Unexpected Export of goods (UEG) has significant positive impacts on consumer staples and insurance in USA, but no relationships with the same two industries in UAE. However, a negative impact between UEG and banking in the UAE was found.
Unexpected Import of Goods (UIG) has a significant negative and positive impact on banking and real estate respectively in the UAE, however, no association was found between UIG and any other industries in the USA.
Although the results from table 4 shows no signs of significant relationships between the two measures of liquidity, Unexpected Money Supply M1 (UM1) & unexpected money supply M2 (UM2) and any industry in USA. However, mixed results between the Um1 and UM2 and the UAE industries were found. The industrials industry was found to be impacted positively by UM1 and negatively by UM2. Furthermore, a negative association between UM2 and consumer staples was found. Unexpected Oil Price Changes (UOG) also indicate different effects on the two industries in the two countries. It affects significantly and positively the USA consumer staples, real estates, and transportation. On the other hand, UOG negatively affect the consumer staples only in UAE. The R2 and DW across the seven estimated regressions in both UAE and USA point to high explanatory power of the models and absence of autocorrelations. It is quite interesting to see some similarities and differences among seven industries of the two countries. It seems beyond this paper’s objectives to examine the possible reasons why these different responses occurred. It could be further investigated by another research.
| Table 4 Industrial Stock Returns Reactions to Local Macroeconomic Risk Factors for UAE and USA(May 2003 to May 2018) |
|||||||
|---|---|---|---|---|---|---|---|
| Panel A: UAE | |||||||
| Industry | Constant | UFX | UEG | UIG | UIP | UI | UM1 |
| Banking | -0.002 | 9.5 | -0.107 | -0.68 | 0.815 | 0.003 | 0.07 |
| (-2.611839) * | -1 | (-2.510628) * | (-2.917776) ** | -1.169 | -0.83 | -0.6 | |
| Consumer Staples | -0.01 | 2.5 | -0.152 | -0.29 | 1.00E-03 | 0 | 0.36 |
| (-4.073796) *** | 0 | (-1.254598) | (-0.334653) | -6.00E-04 | (-0.580014) | -1.4 | |
| Industrials | -0.011 | 26 | 0.096 | 0.6 | 2.237 | 0.003 | 0.62 |
| (-2.753727) * | -1 | -0.517 | -0.46 | -0.871 | -0.23 | (2.573103) * | |
| Insurance | -8.00E-04 | 37 | 0.094 | 1.43 | -4.202 | 0 | 0.12 |
| (-0.138980) | -1 | -0.354 | -0.75 | (-1.132386) | (-0.270970) | -0.2 | |
| Real Estate | 0.004 | -5 | 0.08 | 0.88 | 0.05 | 0.002 | 0 |
| (3.088540) *** | (-0.441179) | -1.233 | (2.899981) ** | -0.056 | -0.51 | (-0.029041) | |
| Telecommunication | -0.003 | 1.9 | 0.002 | -0.07 | 0.713 | 0.004 | -0.3 |
| (-1.492959) | 0 | -0.02 | (-0.084734) | -0.466 | -0.55 | (-1.449788) | |
| Transportation | -0.005 | -10 | -0.111 | 0.43 | 0.07 | 0.006 | -0.2 |
| (-2.507549) * | (-0.597868) | (-1.124360) | -0.61 | -0.051 | -0.87 | (-0.706132) | |
| Panel A: UAE | |||||||
| Industry | UM2 | UOG | MKT | N | R2. adj | DW | R2 MKT |
| Banking | -0.07 | 0.018 | 0.8092 | 181 | 0.87 | 1.927 | 0.87 |
| (-0.653074) | -0.623 | (32.93279) *** | |||||
| Consumer Staples | -0.77 | -0.112 | 0.2173 | 181 | 0.2 | 1.474 | 0.15 |
| (-2.812539) ** | (-2.598779)* | (3.653775) *** | |||||
| Industrials | -0.72 | -0.032 | 0.3651 | 181 | 0.2 | 2.29 | 0.11 |
| (-2.736718) * | (-0.295707) | (4.028116) *** | |||||
| Insurance | -0.13 | 0.117 | 0.5037 | 181 | 0.15 | 2.059 | 0.18 |
| (-0.209739) | -0.756 | (3.849143) *** | |||||
| Real Estate | 0.016 | -0.026 | 1.3155 | 181 | 0.91 | 1.88 | 0.91 |
| -0.11 | (-0.691663) | (41.27460) *** | |||||
| Telecommunication | 0.273 | -0.004 | 0.5369 | 181 | 0.37 | 1.882 | 0.38 |
| -1.11 | (-0.063651) | (9.946532) *** | |||||
| Transportation | 0.056 | -0.048 | 0.6501 | 181 | 0.51 | 2.023 | 0.51 |
| -0.25 | (-0.831497) | (13.39192) *** | |||||
| Panel B: USA | |||||||
| Industry | Constant | UFX | UEG | UIG | UIP | UI | UM1 |
| Banking | -0.004 | 0.4 | 0.607 | -0.98 | 1.285 | 0.006 | 0.25 |
| (-3.288391) ** | (2.612708) * | -0.475 | (-0.898408) | (2.828306) ** | (2.656052) * | -0.7 | |
| Consumer Staples | 1.00E-04 | 0.1 | 3.072 | -0.59 | 1.187 | 0 | -0.4 |
| -0.057 | -1 | (2.785514) * | (-0.402161) | (2.943746) ** | (-0.326514) | (-0.908434) | |
| Industrials | 0.002 | 0 | 0.202 | 0.28 | 0.144 | 0 | 0.01 |
| (2.642424) * | (-1.520976) | -0.316 | -0.51 | -0.632 | (-0.607702) | -0.1 | |
| Insurance | 0.001 | 0 | 2.757 | 0.93 | 0.987 | -0.01 | 0.32 |
| -0.776 | (-0.482801) | (2.525515) * | -0.84 | (2.544032) * | (-2.875663) ** | -0.9 | |
| Real Estate | 0.001 | 0 | 1.842 | 0.06 | -0.649 | 0 | -0.7 |
| -0.631 | (-2.772697) * | -1.151 | -0.04 | (-1.143198) | (-0.459665) | (-1.475257) | |
| Telecommunication | -0.002 | 0.2 | -0.52 | -0.81 | 0.416 | 0.002 | -0.5 |
| (-1.394561) | (2.496742) * | (-0.415077) | (-0.753562) | -0.936 | -0.62 | (-1.299677) | |
| Transportation | 0.001 | 0 | 0.234 | -0.18 | 0.349 | 0 | -0.1 |
| -0.995 | 0 | -0.21 | (-0.187585) | -0.881 | (-0.077504) | (-0.360850) | |
| Panel B: USA | |||||||
| Industry | UM2 | UOG | MKT | N | R2. adj | DW | R2 MKT |
| Banking | -0.41 | -0.046 | 0.5592 | 181 | 0.37 | 2.13 | 0.31 |
| (-0.413062) | (-1.283012) | (10.10980) *** | |||||
| Consumer Staples | 1.333 | -0.109 | 1.2473 | 181 | 0.62 | 1.846 | 0.6 |
| -0.99 | (-2.520328) * | (16.77988) *** | |||||
| Industrials | 0.269 | -0.016 | 1.0802 | 181 | 0.9 | 2.089 | 0.91 |
| -0.54 | (-0.896891) | (39.06107) *** | |||||
| Insurance | -1.33 | -0.011 | 1.2651 | 181 | 0.76 | 1.807 | 0.75 |
| (-1.308566) | (-0.307708) | (22.56964) *** | |||||
| Real Estate | 0.608 | -0.105 | 1.1371 | 181 | 0.63 | 2.121 | 0.62 |
| -0.49 | (-2.537216) * | (16.45286) *** | |||||
| Telecommunication | 1.303 | -0.035 | 0.8124 | 181 | 0.56 | 2.08 | 0.56 |
| -1.33 | (-0.993043) | (15.01771) *** | |||||
| Transportation | 0.639 | -0.045 | 1.0227 | 181 | 0.73 | 1.853 | 0.73 |
| -0.73 | (-2.506746) * | (21.21744) *** | |||||
Discussions and Conclusions
This study compares and contrasts the empirical results of UAE and USA to see if there are any similarities and differences between these two countries as they represent two different region and hence different cultures. This study addresses three main questions. First, whether and to what extent are returns on local industries affected by changes in local macroeconomic risk factors? Second, whether and to what extent are there similarities and differences in different industries? Third, whether and to what extent are there similarities and differences in different markets?
Results suggest that different relationships between local macroeconomic risk factors and industry stock returns have been found in each market due to industry characteristics and differences. The results also show that some industries have more differences than others in the two markets in their stock reactions to local macroeconomic risk factors. More specifically, industries such as banks, consumer stables, industrials, insurance, and real estate show more differences than telecommunication and transportation industries. However, all the industries in both the two markets show strong reactions to local market portfolios. The study also shows more significant relationships between the macroeconomic factors and industry returns in USA than in UAE, which, indicate more efficiency of the USA stock markets as stated by Fama (1970).
From policy perspectives, the significant relationships between the risk factors and industries’ stock returns can serve as very useful information to investors and practitioners in better understanding of how and to what extent risk factors affect returns by industries. Such information can help them make decision in allocation, timing, and diversification of investment portfolios.
References
- Chen, N.F., Roll, R., & Ross, S. (1986). Economic forces and the stock market. Journal of Business, 59(3), 383-403.
- De Sousa, A.M., Martins Noriller, R., Mallmann Huppes, C., Vaz Lopes, A.C., & Malta Meurer, R. (2018). Relation between the macroeconomic variables and the stock return in companies of the finance and insurance sector from Latin American stock market. GCG: Revista de Globalización, Competitividad & Gobernabilidad, 12(3), 20-30.
- Dhaoui, A., Guesmi, K., Saidi, Y., & Bourouis, S. (2018). Oil price shocks and OECD equity markets: Distinguishing between supply and demand effects. International Journal of Global Energy Issues, 41(1-4), 25-51.
- Fama, E.F. (1970). Efficient capital markets: A review of theory and empirical work. The Journal of Finance, 35, 383-432.
- Issah, M., & Antwi, S. (2017). Role of macroeconomic variables on firms’ performance: Evidence from the UK. Cogent Economics & Finance, 5(1).
- Jordan, F. (2017). Macroeconomic forces and arbitrage pricing theory. Journal of Comparative Asian Development, 16(1), 1-20.
- Ligocká, M., & Stavárek, D. (2018). What macroeconomic variables drive the stock returns of Austrian financial institutions? Scientific Papers of the University of Pardubice. Series D, Faculty of Economics & Administration, 25(42), 128-139.
- Mensi, W., Hammoudeh, S., Yoon, S.M., & Balcilar, M. (2017). Impact of macroeconomic factors and country risk ratings on GCC stock markets: evidence from a dynamic panel threshold model with regime switching. Applied Economics, 49(13), 1255-1272.
- Poon, S., & Taylor, S.J. (1991). Macroeconomic factors and the UK stock market. Journal of Business, Finance and Accounting, 18(5), 619-636.
- Roll, R. (1977). A critique of the asset pricing theories’ tests, Part 1: On past and potential testability of the theory. Journal of Financial Economics, 4, 129-176.
- Roll, R. & Ross, S.A. (1980). An empirical investigation of the arbitrage pricing theory. The Journal of Finance, 35(5), 1073-1103.
- Ross, S., (1976). The arbitrage theory of capital asset pricing. Journal of Economic Theory, 13, 341-360.
- Silva Ximenes, J.A., & Li, L. (2018). Bank-specific and macroeconomic factors related to bank profitability and stock return in Thailand. UTCC International Journal of Business & Economics, 10(1), 119-137.
- Smita, M., & Saumitra, N.B. (2018). Dynamics of the impact of currency fluctuations on stock markets in India: Assessing the pricing of exchange rate risks. Borsa Istanbul Review, 19(1), 15-23.
- Topalo?lu, E.E., & Karakozak, Ö. (2018). Macroeconomic factors and stock return: Panel data analysis on BIST bank index firms. Journal of Accounting & Finance, 78, 199-216.
- Tripathi, V., & Kumar, A. (2015). Do macroeconomic variables affect stock returns in brics markets? An Ardl approach. Journal of Commerce & Accounting Research, 4(2), 1-15.