Research Article: 2020 Vol: 24 Issue: 1
Simultaneity among Market Risk Taking, Bank Disclosures and Corporate Governance: Empirical Evidence from the Banking Sector of Bangladesh
Niluthpaul Sarker, Jagannath University
Md. Jamil Shariff, University of Dhaka
Abstract
The operational premises of the banking sector of Bangladesh are restrained by the strong governance system which controls the unusual fluctuations of banking profit. The study showed the simultaneous relationship among market risk taking, bank disclosures and corporate governance relying on panel data of thirty-two (32) commercial banks for the period of 2006-2016. The study addressed the problem of endogeneity, heteroskedasticity and auto-correlation by selecting the two-stage-least-square (2SLS) method in data analysis. The study argues in favor of good governance system which can ensure bank transparency and market stability. The study reveals that banks disclosures and corporate governance have a significant effect on market risk-taking behavior and also found a reciprocal effect in case of disclosure model and governance model.
Keywords
Bank Risk, Corporate Governance, Quantitative Methods, Panel Data, Bangladesh.
JEL Classifications
C12, C33
Introduction
The chronic fluctuations of financial performance indulge market growth in a countercyclical way and obstruct in economic development. Several studies (Cebenoyan et al., 1999; Fama & Jensen, 1983) supported that higher risk-taking behavior of banks are enormously increasing due to the problem of information asymmetry. In this regard, transparent disclosures can mitigate the conflict and confusion of stakeholders regarding the vulnerable economic performance of the banks. Cordella & Yeyati (1998); Boot & Schmeits (2000) found negative association between the higher defaults of credits and bank disclosures as shareholders and investors demand more information about risky projects. In addition, the studies conducted by Baumann & Nier, (2004); Nier (2005) found that banks transparency by ensuring higher disclosure have a significant impact on the volatility of share price. In fine, the study argued that higher level of disclosure practice can be a way of solving the problem of information heterogeneity in the financial market that is identified as a cause of global financial turmoil in recent years.
On the contrary, banks behavior is influenced by the corporate culture that termed as governance system. The strong governance system ensures effectiveness and efficiency of operation (OECD, 2004) that restrain economic meltdown. Generally, corporate governance (CG) plays a vital role in the growth prospects of an economy, especially reducing the risk for investors, attracting investment capital and improving the performance of banks (Spanos, 2005). Corporate governance deals with the norms of the organization that specifies the duties and responsibilities of the board of directors and their promises to shareholders and stakeholders group (Pass, 2004). In fact, corporate governance (CG) is a process by which shareholders influence management to act in their interest, providing a degree of investor confidence that is necessary for the capital markets to function effectively (Rezaee, 2009).
The study aims to investigate the joint effect of corporate disclosures and corporate governance (CG) structure on bank risk (market risk). Adequate risk disclosures can ensure more transparency and importantly keep the banking sector stable. Financial disclosures have raised a high level of importance for banking business rather than non-financial ones. Generally, the users of accounting information are shareholders, creditors, regulators, competitors, academics, employees, and the management who have demand for transparent information for their decisions with lower variance in prediction. The annual report is considered to be a reliable source of satisfying the needs of diversified users.
The study is conducted on the ground that there is a lack of research evidence in the area of bank risk-taking in the developing country like Bangladesh. It is true that the socio-political and economic environments are not supportive enough to motivate the researcher for intensive investigation. Besides, there is a limited scope of extracting bank related information from valid published sources other than annual reports. This study critically examines the published annual reports of the commercial banks and shows the effect of transparency disclosures and governance culture in their risk-taking behavior. Furthermore, it also investigates the probable relation among the bank risk with ownership structure, financial performance, and position of banks. The findings of the research will enhance the empirical evidence and will also help the policy maker for updating their existing rules and regulations to keep the market stable for the period.
Literature Review
In the earlier period, the risk is defined by the occurrence of adverse events in the scenario (Deumes & Knechel, 2008). The concrete idea of risk came out after the industrial revolution. During the Renaissance period, the idea behind risk was greatly used as a phenomenon in the insurance industry for probability calculations (Linsley & Shrives, 2000). Knight was the pioneer who introduces the concept of risk in 1921. The concept enumerates the risk as a measure of uncertainty in economics. On the passage of time, the word “risk” is used broadly in every language (Linsley et al., 2006).
The time horizon can be segregated as pre-modern age and modern age. In the pre-modern age, the idea of risk was mostly concerned with “occurrence of natural events” (Linsley & Shrives, 2006). However, the idea of risk specifically identified as “positive and negative outcomes of events” in the modern era (Linsley & Shrives, 2006). The modern concept of risk was more specific and understandable. The contemporary research used the term “risk” in several dimensions. IASB (2004) and ICAEW (1995) explained the risk as the improbability that ends with either gain or loss and plays a dominating role in the determination of expected result (Beretta & Bozzolan, 2004). The Institute of Risk Management (IRM, 2002) holds that risk is the arrangement of probable outcome or consequences of an event. In all soughs of activities, the potentiality of the events may be reflected by the creation of opportunities for benefits (upside) or threats to success (downside). They are also concerned with the positive and negative aspects of risk in risk management guidelines. However, International Organization for Standardization 310001 (ISO 31000, 2009) explains the risk as “effect of uncertainty on objectives” where the effect is a deviation from the expectation that may be positive or negative.
Market risk is “the risk related to the uncertainty of a financial institution’s earnings on its trading portfolio caused by changes in market conditions such as the price of an asset, interest rates, market volatility, and market liquidity” (Saunders, Chapter 10). Bank exposed the market risk in different ways. Generally, it categorizes risks into two heads based on the situations, where the volatility of similar assets is affected by systematic risk in the financial markets; alternatively the individual asset is affected by specific risk (Apostolik et al. 2009). In the banking industry, four (4) common types of market risk are found which are: Interest Rate Risk (IRR), Foreign Exchange Rate Risk (EER), Equity Price Risk (EPR) and lastly commodities risk (Apostolik et al., 2009; Jorion, 2003; and Greuning and Bratanovic, 2003). The market risk measurement is very important, because:
1. Management Decision: The strategic level employee wants market risk related information for better and decision making.
2. Limit setup: Market risk information helps in target setting or position limits.
3. Utilization of Resources: Market risk profile compares and contrast the risk and return tradeoff in each asset class and help to keep sufficient capital for the risky assets.
4. Performance judgment: The risk-return composition easily identified the less risky projects and can set the real benefit scheme.
5. The effectiveness of regulation: The internal rating based techniques can ensure superior capital allotment.
The market risk model is represented by two proxies: standard deviation of return on assets (SDROE) and standard deviation of return on equity (SDROE). The studies conducted by Saunders et al. (1990), Laeven and Levine (2009) used the proxy of market risk as standard deviation of return on equity (SDROE) as the investors are profit seeker, and so they try to hold those shares that have higher market returns. If the market risk (SDROE) is high, it indicate the vulnerable position of the banks in the capital market and declare it as a risky bank. If the outcome is negative or there is high volatility of returns, then they will release the shares because of higher coefficient of variations (CV), and they cannot take any solid decision.
Bank Risk Taking a nd Disclosures
The contemporary issues in bank risk management mostly confined in the premises of financial reporting nature and corporate governance systems. It is found that the default risk would be minimized by the increase of disclosure and strong market disciplines that encourage in selecting capital buffer system (Nier & Baumann, 2003). Another study conducted by Baumann & Erlend (2004) found that bank disclosures are minimizing the conflict of interest among the concerned parties and also have an inverse effect on stock price volatility. The study revealed that banks with higher disclosures on each category perform lower risk than the banks which discloses less information to the public.
Another study conducted by Hirtle (2007) found that there is a relationship between bank disclosures and its performance where the risk profile of the bank holding companies (BHC) are presented based on the quantity of disclosure. The study constructed a risk profile index based on the publicly traded information of BHC, especially the information that affects the forward-looking activities of banks in their trading and decision making platform. It examines the association between disclosure index and following the risk-return pattern of BHC’s operating activities. The performance of the bank is proxied by market return. The study revealed that banks with higher disclosures are minimizing risk, particularly idiosyncratic risk, and lower level of disclosure compensated bank return. In fact, higher disclosure commensurate two-fold objectives, firstly lowering the overall bank risk and secondly increase the efficiency of banks that boost up the profit.
Hossain (2008) conducted a study on banking sector of India. The study examines the extent of financial disclosure in the annual report of banks. It found that several variables are significant in outlining the level of disclosures that are size, profitability, board composition and market discipline. It also revealed that age, the complexity of business and asset-in-place variables are the insignificant effect on the level of annual disclosure. The study found that banks are very compliant with mandatory disclosures whereas overlook the voluntary disclosures.
It is very common that banks try to overlook the voluntary disclosures as there is no regulatory pressure. However, from the stakeholder point of view, banks should publish all the relevant information so that the users can take their prudent decisions. Wang et al. (2008) studied that the level of disclosures is positively associated with ownership structure and firm performance. The firm performance is proxied by return on equity (ROE). The ownership structure is also segregated as state ownership and foreign ownership. The study found that extensive voluntary disclosure does not affect the lowering cost of debt. Another study conducted by Putu et al. (2012), empirically showed the effect of voluntary disclosure on earnings management of banks listed in Indonesian Stock Exchange. They found that voluntary disclosure is having an inverse impact on earnings management. In fact, a higher level of voluntary disclosures decreased banks earnings management. Hence, banks disclosures play a vital role for those who take their decision based on annual reports.
Again, Bischof & Daske (2012) steered their studies on Eurozone banks focusing on bank-specific disclosures. They considered the stress test and sovereign debt crisis as a premise of their investigation. They found that mandatory disclosures increase the participants of providing rigorous information whereas voluntary enforcement works at weak stimuli. In fact, the commitment of higher disclosures reduces the bank opaqueness. It also found that negative stress test is related to the elimination of sovereign risk-taking. However, the effectiveness of supervisory disclosure is achieved by reducing the uncertainty in the financial market that influences in the lower risk-taking behavior of banks.
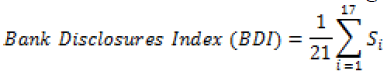
In this study, the disclosures index is prepared in accordance with the factors specified by Nier and Baumann, (2006) where seventeen (17) items are categorized into four (4) broad heads and show the effect on bank risk extended to credit risk, market risk, and liquidity risk along with overall bank risk. Based on the overall discussion and supports, the study develops the hypotheses that are given below:
H1: Ceteris paribus, higher disclosures have lessened market risk taking.
H1a: Ceteris paribus, higher bank risk have claimed more disclosures.
Bank Risk-taking and Corporate Governance
Banking business can achieve its goal only by practicing strong governance system. It is also found that the risk-taking behavior of banks is controlled by the regulatory interruption and creates a stable financial position in the market.
Evidence found from the study conducted by Konishi and Yasuda (2004) reveals that commercial banks’ risk-taking behavior can be eliminated by the execution of capital adequacy requirements proposed by the Basel norms. The findings support that the inclusion of retired government officials in the board member significantly affect the bank risk. Another study conducted by Laeven & Levine (2009) found that the composition of shareholders within the corporate governance system affects the risk-taking behavior of banks. The governance system of each bank is different from other banks ignoring the mandatory rules. In fact, the study emphasis on the ownership concentration of banks where they showed the power of the majority shareholders reflected in the risk taking behavior along with capital regulations and deposit insurance policies. They also revealed that the practice of rules and regulation of each bank has a different effect on its risk behavior, only because of the practice of different corporate governance system.
Beltratti & Stulz (2012) studied the effect of shareholder-friendly board index on firm’s risk. However, their findings are a little bit contradictory where they found shareholder-friendly boards have a positive impact on default risk but the argument was not true for the other types of risks.
Erkens et al. (2012) conducted their study on the effect of independent directors on bank risk-taking behaviors. The used three measures of bank risk, i.e., default risk, equity risk and leverage risk proxied by default frequency, stock volatility and additional capital rose. They revealed that independent directors do not have any association with the reduction of default risk and equity risk. However, the leverage risk reduced by the increase of independent directors in the board composition as they support to raise equity capital during financial turmoil.
Berger et al. (2014) worked on the demographic features of corporate governance in the perspective of bank risk. They focused on the qualitative features of directors considering age, education, and gender. The study considered the portfolio risk measured by asset density and loan portfolio concentration. The findings showed that younger executives have positive relations with portfolio risk same as the female directors. Another study conducted by Minton et al. (2014), focused on the skills of independent directors in the area of financial institutions. The study uses the risk measure as equity risk, leverage risk and portfolio risk proxied by stock volatility, risk-adjusted capital ratio, and fractions of collaterals covered by real estate consecutively. The results were beyond the expectation as the composition of board members with higher expertise in financial markets has a positive impact on bank risk.
Recently, International Monetary Fund (2014) conducted a research work emphasizing the board size and the composition of independent directors. The study considered default risk, equity risk, and tail risk in the model proxied by Z score, stock volatility, and expected and marginal shortfall. The investigation revealed that the higher composition of independent directors in the board negatively associated with bank risk whereas a higher numbers of financial experts on the board have a positive impact on bank risk. At this stage, the study develops the following hypothesis about risk and CG Index:
H2: Ceteris paribus, strong corporate governance have obstructed bank risk.
H2a: Ceteris paribus, higher bank risk demanded strong corporate governance.
Bank Risk taking a nd t he Multiple Effects o f Disclosures a nd Governance
The study uses the multiple effects of bank disclosures and corporate governance structure. It is assumed that banks with higher disclosure practice and strong governance system will deteriorate the expansion of bank risk-taking. Baumann & Erlend (2004) stated that bank transparency depends on the volume of disclosures of banks and reduce risk whereas Flannery (2001) argued that strong market mechanism in the form of corporate governance help to establish a good image in the marketplace and directed by banks transparency. Empirical evidence is sufficient to support the variables that may consider in the model. The hypotheses drawn from the discussion are given below:
H3: Ceteris paribus, the multiplicity of bank disclosures and corporate governance have obstructed market risk.
Methodology
The study is based on the systematic process to ensure the trust worthiness of the research. The main source of data are the annual reports published by the banks because in most of the developing and developed countries, annual report is considered as widely used and a major source of reliable information among other sources (Akhtaruddin, 2005; Alattar & Al-Khater, 2008; Catasús, 2008; Chau & Gray, 2010). Empirical studies (Naser & Nuseibeh, 2003; Al-Razeen & Karbhari, 2004) showed that annual report is the formal means of information in the developing countries. In this regard, this study relies on the annual reports as a major source of its data collection. The study also chooses single country experiment in its research. The reason is that the socio-political or economic environment of Bangladesh is not in the same track of the Asian region. Moreover, there is a lack of adequate research in the field of bank risk exposure in the financial sector of Bangladesh.
Data and Sample
The data set has been constructed based on panel data consisting eleven (11) years (2006-2016) time series data and 32 commercial banks longitudinal data. The total number of observation is 346. In 2006, 48 banks operated in Bangladesh under 4 different categories: i.e. National Commercial Banks (SCBs), Development finance institutions (DFIs), Private commercial banks (PCBs) and Foreign Commercial Banks (FCBs). The comparative scenarios among different types of banks are given below Table 1:
| Table 1Comparative Scenario by Types of Bank | ||||||||
| 2006 | 2016 | |||||||
| Bank by types | Number of Banks | Number of Branches | % of Industry Assets | % of Deposits | Number of Banks | Number of Branches | % of Industry Assets | % of Deposits |
| NCBs | 4 | 3384 | 32.7 | 35.2 | 6 | 3700 | 27.53 | 28.43 |
| DFIs | 5 | 1354 | 7.8 | 5.4 | 2 | 1407 | 2.82 | 2.85 |
| PCBs | 30 | 1776 | 47.7 | 51.3 | 39 | 4271 | 64.50 | 64.26 |
| FCBs | 9 | 48 | 11.8 | 8.1 | 9 | 75 | 5.15 | 4.46 |
| Total | 48 | 6562 | 100 | 100 | 56 | 9453 | 100 | 100 |
Model Selection
Simultaneity is determined by the endogeneity of explanatory variables. In this situation, explanatory variables are jointly determined with the independent variables through equilibrium. The classical model of SEM is:
Basic Model


Y= Bank Risk
X= Bank Disclosure
Z= Corporate Governance
i= Cross section
t = Time periods
Where the cross-sectional dimension across banks is represented by i subscript, and time dimension is represented by t. εit is the random error term, with vit capturing the unobserved bank specific effect, and uit is the idiosyncratic error and is independently identically distributed (i.i.d), eit N(0,σ2). Equation (1) examines whether the disclosure, governance and multiple effect of disclosure and governance can reflect the changes in bank risks.
Measurement of Variables
The dependent variable is the market risk which indicates the probable losses incurred by the banks in their aggressive strategy which simultaneously affect the overall position and performance of the bank. This study also identified several independent variable, based on prior research, to perform a statistical analysis to draw a conclusion whether the effect of independent variable changes the dependent variable to some extent. The dependent and independent variables are shown in the Table 2 below:
| Table 2 List Variables Used for Market Risk Model, Bank Disclosure Model, and Corporate Governance Model | ||
| Variables | Description | Source |
| Dependent Variable: | ||
| Market Risk: | ||
| SDROA | Standard deviation of last three year ROA | Annual Report |
| SDROE | Standard deviation of last three year ROE | Annual Report |
| Independent Variable: | ||
| BDI | A composite disclosure index based on 17 items identified by Bauman and Nier (2004) under four categories [See Appendix] | Author’s Construction |
| CGI | A composite index based compliance items issued by Securities and Exchange Commission of Bangladesh [See Appendix] | Author’s Construction |
| BDI*CGI | Multiplication of bank financial disclosures and governance disclosures | Author’s Construction |
| Control Variable: | ||
| Bank level: | ||
| CREG | Regulatory capital ratio | Annual Report |
| BGROWTH | Bank assets growth | Annual Report |
| INEFFIC | Total operating expense divided by total operating income | Annual Report |
| PROFIT | The percentage of net profit before tax over average assets | Annual Report |
| INDIV | The proportion non-operating income over total income | Annual Report |
| BAGE | Years of bank experience from its incorporation | Annual Report |
| SMDEV | Percentage of Stock Market Capitalization over GDP | WDI |
| Macroeconomic level: | ||
| GDPG | Annual real GDP Growth rate | WDI |
| INFLA | Annual inflation rate | WDI |
Preliminary Diagnosis
Unit Root Test
The panel data unit root tests have become popular during the recent years. It is argued that it is one way of obtaining more observations and solving the low power problem of unit root tests (Madala, 2001). The most commonly used tests are the Levin-Lin (LL) tests, followed by the Im-Pesaran-Shin (IPS) test, and Maddala-Wu (MW) test. Consider  ......,, N for N banks. The test for a unit root, say, for banks 1 is based on
It is argued that this test has low power. The panel data Levin-Lin LL unit root test is based on a test of

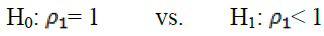
In statistics, unit root test determines whether a variable is stationary or non-stationary and possesses a unit root. The null hypothesis is the presence of unit root and the alternative hypothesis is stationary. The Table 3 below showed that all the variables are stationary and fit for further processing.
| Table 3 Levin-Lin-Chu Unit Root Test | ||
| (a) : Dependent Variables | ||
| Ho: Panels contain unit roots; Hi: Panels are stationary. | ||
| Variables | Statistic* | P-value |
| Market Risk | ||
| SDROA | -6.5482 | 0.0000 |
| SDROE | -6.2420 | 0.0000 |
| *Adjusted t value | ||
| (b): Independent variables | ||
| Ho: Panels contain unit roots; Hi: Panels are stationary. | ||
| Variables | Statistic* | P-value |
| Independent Variables | ||
| BDI | -12.6049 | 0.0000 |
| CGI | -19.9764 | 0.0000 |
| BDI*CGI | -12.8173 | 0.0000 |
| Control Variables | ||
| CREG | -12.4873 | 0.0000 |
| BGROWTH | -6.0272 | 0.0000 |
| INEFFIC | -10.9398 | 0.0000 |
| PVB | -8.6016 | 0.0000 |
| TIER 1 | -15.6382 | 0.0000 |
| PROFIT | -11.2241 | 0.0000 |
| INDIV | -7.9506 | 0.0000 |
| BAGE | -6.0272 | 0.0000 |
| BSDEV | -2.7047 | 0.0000 |
| SMDEV | -6.3086 | 0.0000 |
| GDPG | -4.5377 | 0.0000 |
| INFLA | -7.1022 | 0.0000 |
| *Adjusted t value | ||
Test of Endogeneity
Endogeneity problem is grounded on the basis of two prime causes, an uncontrolled confounding instigating both independent and dependent variables; another way is the simultaneity between independent and dependent variables of the model. In fact, it deals with the situation where explanatory variable are correlated with the error term. This problem arises due to measurement error, auto-regression with auto-correlated errors, simultaneous causality, and omitted variables. In the study, we conducted endogeneity test to ensure the existence of simultaneity between the variables. In our analysis, the results reject the null hypothesis that the variables are exogenous rather it confirms the endogeneity problem. The endogeneity test of Wu-Hausman showed the statistical significance in the Equation at 5% level and Equation 2 at 1% level (Tables 4 & 5).
| Table 4 Tests of Endogeneity for Market Risk, Disclosures, and Governance Model | ||||||||
| Ho: variables are exogenous | H1: variables are endogenous | |||||||
| Market Risk | Bank Disclosures | Corporate Governance | ||||||
| Model 1 | Model 2 | Model 3 | Model 4 | Model 5 | Model 6 | Model 7 | Model 8 | |
| Difference in J-stats | 9.1925 | 9.6517 | 8.8560 | 8.9629 | 23.4178 | 22.5625 | 21.6201 | 21.3455 |
| Probability | 0.0024 | 0.0019 | 0.0029 | 0.0045 | 0.0000 | 0.0000 | 0.0000 | 0.0000 |
| Table 5 Heteroskedasticity Test for Market Risk, Disclosure, and Governance Model | ||||||||
| Heteroskedasticity Test: White | ||||||||
| H0 : Errors are Homoskedastic | H1: Errors are Heteroskedastic | |||||||
| Market Risk | Bank Disclosures | Corporate Governance | ||||||
| Model 1 | Model 2 | Model 3 | Model 4 | Model 5 | Model 6 | Model 7 | Model 8 | |
| F-statistic | 40.86414 | 11.57799 | 23068.20 | 19.76588 | 3761.136 | 239225.8 | 40424.44 | 210.7990 |
| Prob. F(35,310) | 0.0000 | 0.0000 | 0.0000 | 0.0000 | 0.0000 | 0.0000 | 0.0000 | 0.0000 |
| Obs*R-squared | 305.6879 | 236.1061 | 345.9192 | 271.8766 | 345.1871 | 345.9872 | 345.9539 | 337.3753 |
| Prob. Chi-Square(35) | 0.0000 | 0.0000 | 0.0000 | 0.0000 | 0.0000 | 0.0000 | 0.0000 | 0.0000 |
| Scaled explained SS | 564.8439 | 474.5073 | 448.8378 | 499.5376 | 4517.890 | 6601.158 | 450.5808 | 610.0068 |
| Prob. Chi-Square(35) | 0.0000 | 0.0000 | 0.0000 | 0.0000 | 0.0000 | 0.0000 | 0.0000 | 0.0000 |
Test of Heteroskedasticity
Heteroskedasticity is said to occur when the variance of the unobservable error  conditional on independent variables, is not constant, i.e. Var
 In particular, the variance of the error may be a function of independent variables:
The White test is explicitly intended to test for forms of heteroskedasticity, the relation of  with all independent variables
 the squares of ith independent variables
  and all the cross products
 In the model, all the Equations reject the null hypothesis that the error term
 is homoskedastic. Equation 1 & 2 are both statistically significant at 1% and 5% level respectively.
Test of Auto correlation
The error terms are said to be autocorrelated if and only if Cov  The presence of serial correlation is tested through Breusch-Godfrey test. The idea of this test is originated from Lagrange multiplier that is why it is called LM test for serial correlation. Equations reject the null hypothesis that there is no serial correlation in the error term and are statistically significant (p<0.05) (Table 6).
| Table 6 Serial Correlation Test for Market Risk, Disclosure, and Governance Model | ||||||||
| Breusch-Godfrey Serial Correlation LM Test | ||||||||
| H0: There is no serial correlation | H1: There is serial correlation | |||||||
| Market Risk | Bank Disclosures | Corporate Governance | ||||||
| Model 1 | Model 2 | Model 3 | Model 4 | Model 5 | Model 6 | Model 7 | Model 8 | |
| Obs*R-squared | 145.9406 | 106.2350 | 154.0634 | 154.4783 | 125.7301 | 136.9536 | 131.5115 | 167.4352 |
| Prob. Chi-Square(2) | 0.0000 | 0.0000 | 0.0000 | 0.0000 | 0.0000 | 0.0000 | 0.0000 | 0.0000 |
Fixed Vs. Random Effect
Fixed effect (FE) model is used to analyze the impact of variables that have time variation. It helps to control the bias on predictor or outcome variables. FE model is widely thought to be more convincing tool to estimate ceteris paribus effects (Wooldridge, 2006). FE model usually removes the time-invariant characteristics and assesses the net effect on the outcome variable. Sometimes, time-invariant factors become unique to the individual and should not be correlated with other entities features. Random effect is supported in the situation where error terms of the entities are correlated. Random effect (RE) is applied to a certain situation when the key explanatory variable is constant over time. Ultimately, the selection of the fixed effect (FE) or random effect (RE) depends on Hausman test2.
In the risk model, the study runs the regression in fixed effect (FE) and random effect (RE) which showed that fixed effect (FE) model is appropriate. The Hausman test statistically supports that fixed effect (FE) model which is significant at 1% level. In the case of disclosure model, fixed effect (FE) and random effect (RE) are diagnosed through the Hausman test to select the best model considering the situations. It is found that result of the disclosure model is less than 5% (p<5%) which indicate that fixed effect model is appropriate rather than random- effect, i.e. alternative hypothesis is accepted. In the case of governance model, the study found the similar result where fixed effect model is supported and also significant at 5% level.
Data Processing Methods
In the above diagnosis tests, advocates for the selection of specific method to show the effect and validity of the model based on the nature of the data Table 7.
| Table 7 Selection of Research Method for the Models | ||
| Diagnosis | Result | Research method |
| Is there any endogeneity problem? | Yes | Two-Stage Least Square (2SLS) |
| Is there any heteroskedasticity problem? | Yes | |
| Is there any autocorrelation problem? | Yes | |
To run the final regression of the equation, the study uses Two-Stage Least Square (2SLS) method in data processing to reveal the accurate result.
Analysis and Findings
Descriptive Statistics
The descriptive statistics of the data set are presented below which contains the value of minimum, maximum, mean and standard deviation of thirty-two (32) commercial banks of Bangladesh from the year 2006 to 2016.The descriptive statistics of the bank risk-taking is given below Table 8:
| Table 8 Descriptive Statistics: Dependent Variables | ||||||
| Risk | Proxy | N | Minimum | Maximum | Mean | Std. Deviation |
| Market Risk | SDROA | 346 | 0.01 | 8.15 | 0.53 | 0.98 |
| SDROE | 346 | 0.03 | 167.33 | 7.94 | 19.14 | |
In market risk, it is found SDROE has a higher standard deviation with an average value of 7.94 where the minimum and maximum values are 0.03 and 167.33 respectively. It implies that some of the banks are unstable in retaining their profit and capital adequacy ratio over time. The volatility urges for more in-depth investigation in the area for steady growth. In the case of SDROA, the maximum and minimum limits ranges from 8.15 to 0.01 with an average value of 0.53. It indicates that the data are mostly close to a lower limit but some absurd cases also exist. The standard deviation is 0.98 which represent relatively lower deviation over time. These two proxies are used to measure the tendency of being the market position of banks over the period and also considered as market risk of banks.
From the descriptive statistics (Table 9), it is found that bank disclosure index (BDI) has a mean value of 0.88 with minimum and maximum value 0.52 and 1.00 respectively. It is mandatory for the banking industry to report their statements according to the Bangladesh Financial Reporting Standards (BFRS). It is obvious that adequate disclosures made the business more transparent to the different parties and regarded it as a corporate glass house. However, the standard deviation is 11% indicates that most of the banks tried to follow the prescribed reporting standards with little variations. In case of corporate governance index (CGI), the minimum and maximum values are 0.70 and 1.00 with average value 0.96. It indicates that most of the banks perform well in reporting governance related information in the annual reports. In Bangladesh, the first corporate governance rules was published in 2006 and again it was revised in 2012. So, there is very little standard deviation which is 0.07. In the case of multiple effects of bank disclosure index and corporate governance index (BDI*CGI), it is found that the minimum and maximum value is 0.50 and 1.00 with average value 0.85. It indicates that few of the banks are lagged in reporting equally in financial and governance factors in their annual reports whereas it is mandatory by the regulatory body. The standard deviation of the multiple effects of BDI and CGI is 0.13.
| Table 9 Descriptive Statistics: Independent Variables | |||||
| N | Minimum | Maximum | Mean | Std. Deviation | |
| BDI | 346 | 0.52 | 1.00 | 0.88 | 0.11 |
| CGI | 346 | 0.70 | 1.00 | 0.96 | 0.07 |
| BDI*CGI | 346 | 0.50 | 1.00 | 0.85 | 0.13 |
Regulatory capital (CREG) denotes the capital based on risk which is maintained by the rules determined by the regulatory authority in a country (Table 10). This capital is measured as the ratio of capital to risk-weighted assets and also known as risk-based capital adequacy ratio. It is found that the CREG has minimum and the maximum value of -17.58 and 20.92 with an average value of 11.34. Most of the government-owned commercial banks keep their regulatory capital in lower amount violating the existing Basel norms. According to BASEL III, all the banks should keep at least 10 percent of their risk-weighted capital (Tier 1 plus Tier 2 capital). It is also found that the standard deviation is 3.03 meaning that all the banks are not giving importance equally in keeping capital adequacy ratio in the uniform figure.
| Table 10 Descriptive Statistics: Control Variables | |||||
| N | Minimum | Maximum | Mean | Std. Deviation | |
| CREG | 346 | -17.58 | 20.92 | 11.34 | 3.03 |
| BGROWTH | 346 | 0.00 | 66.69 | 9.37 | 9.88 |
| INEFFIC | 346 | 17.85 | 112.23 | 44.20 | 12.69 |
| PVB | 346 | -0.11 | 1.77 | 0.09 | 0.12 |
| Tier 1 | 346 | -31.47 | 88.65 | 8.96 | 5.60 |
| PROFIT | 346 | -13.52 | 6.05 | 1.29 | 1.40 |
| INDIV | 346 | 2.96 | 56.43 | 27.29 | 9.28 |
| BAGE | 346 | 5.00 | 44.00 | 20.11 | 10.09 |
| BSDEV | 346 | 40.28 | 48.11 | 44.18 | 2.51 |
| SMDEV | 346 | 4.81 | 34.33 | 19.87 | 8.50 |
| GDPG | 346 | 5.05 | 7.11 | 6.28 | 0.59 |
| INFLA | 346 | 5.67 | 8.16 | 6.87 | 0.82 |
Bank growth (BGROWTH) is the growth of assets over the period. It is found that the minimum and maximum value of assets growth is 0.00 and 66.69 with a mean value of 9.37. The picture denotes that the average growth of banks over the period is negligible whether some of the banks are in good position with significantly high growth rate. This creates an uneven competition in the marketplace and allures the poor performer in taking an extravagant risk by comprising with the quality of borrowers. The deviation in growth phenomena is 9.88 which cluster the good performer and bad performers of banks in the investor's mindset and reflect the consequences in share price.
Bank inefficiency (INEFFIC) is measured by the operating expenses divided by operating income of the banks in their accounting period. The quality of earnings is mostly secured by the net operating income rather than income from non-operating income. That is why banks with higher net operating income are treated as more efficient though different measures are used to measure the efficiency of academic research. In this situation, the minimum and maximum values are 17.85 and 112.23 whereas the mean value is 44.20. The study found that, government-owned commercial banks are consistently incurring heavy loss in generating operating income and are treated as inefficient or poor performer banks.
In the case of the market to book value of equity (PVB), it is found that the lower and higher limit is -0.11 and 1.77 with an average value of 0.09. This is not good for the banking industry as well as for the country. It gives signal to the concern parties that the banks are losing their image in the market by devaluating their value. The standard deviation is 0.12.
Tier 1 capital is also called the core capital of banks according to BASEL norms. The statistics show that the minimum and maximum value is -31.47 and 88.65 with an average value of 8.96. The severe violation of BASEL norms found in this case. It proves that the governance system is not effective in the banking culture and is malfunctioning. The deviation over the period is 5.60.
Profitability of the banks (PROFIT) is denoted by the return on average assets which is calculated by net profit before tax divided by average total assets. It is found that the minimum and maximum value is -13.52 and 6.05 whereas the average value is 1.29. The result indicates that some of the banks perform extremely poor over the period and are waiting for liquidation. The average value neither reflects the lower limit nor, the higher limits; both are in extreme position. The standard deviation is 1.40.
Income diversification (INDIV) of banks is the alternative options of banks in adding positive value in total income. It is measured by the non-operating income to total income. The study found that the minimum and maximum value is 2.96 and 56.43 with a mean value of 27.29. It indicates that banks are trying to cover the losses by earning more in non-operating income though it contradicts with the quality of earnings. The study also reveals that some of the banks earn more than fifty (50) percent of their income from non-operating income. No doubt, it will derail the banking business from the mainstream and will create a hap-hazard position in the economy.
The year of experience denotes bank age (BAGE) over the time counted from their inception. It is found that the minimum and maximum age limit is 5 and 44 with a mean value of 20.11. In the data structure, both the young and older banks are considered for the test giving equal importance as both of the banks perform under same circumstances.
Financial system deposit calculates banking sector development (BSDEV) to the percentage of the gross domestic product. It is found that the minimum and maximum value is 40.28 and 48.11 with mean value 44.18. The deviation is lower which is 2.51. However, in the case of stock market development (SMDEV), the figure generated by the stock market capitalization to the percentage of gross domestic product (GDP). It is found that the minimum and maximum value is 4.81 and 34.33 with an average value of 19.87. It also reveals that capital market is not strong enough to earn more and can contribute highly to the economy. The standard deviation is 8.50 meaning that the industry contribution is not steadily growing over the period.
The gross domestic product (GDP) is the indicator of economic growth of a country. It is found that the minimum and maximum value over the period is 5.05 and 7.11 with an average value of 6.28. The growth position is not good although some systematic and unsystematic risk is associated with this macroeconomic variable. In the case of inflation, the minimum and maximum values are 5.67 and 8.16 with an average value of 6.87. It indicates that there is inflationary pressure in the economy although currency devaluation is very common in the third world country. The standard deviation is 0.82.
Univariate Analysis
The Spearman correlation analysis was performed to show the relationship between the explained variable and explanatory variables using SPSS 17. The results are shown in the Table 11 below. It has been found in this table that variables BDI, BDI*CGI, INEFFIC, INDIV, and INFLA have a strong positive and also statistically significant correlation with explained variable Standard Deviation of ROE i. e. SROE (0.002, 0.001, 0.087, 0.251 and 0.052). Moreover, variables CGI, CREG, BGROWTH, PROFIT, BSDEV and GDPG have the strong negative correlation, which is -0.004, -0.408, -0.178, -0.343, -0.023, and -0.005 with SROE and are statistically significant (P<0.01). On the other hand, INEFFIC, INDIV, GDPG, and INFLA have the strong positive correlation with Standard Deviation of ROA i. e. SROA which are 0.144, 0.186, 0.006 and 0.023 and are statistically significant (P<0.01). However, variables BDI, CGI, BDI*CGI, CREG, BGROWTH, PROFIT and BSDEV and have a strong negative correlation, which is -0.088, -0.036, -0.085, -0.496, -0.181, -0.423 and -0.121 with SROA and are statistically significant (P<0.01). It is also found that bank disclosure index and corporate governance index are highly correlated with multiple effects of bank disclosure and corporate governance with coefficients 0.909 and 0.648 and also significant at 1% level. It suggests that there is a multi-collinearity problem and suggest to construct the model considering each variable separately.
| Table 11 The Relationship Between Disclosures and Corporate Governance with Bank Market Risk | |||||||||||||
| SROE | SROA | BDI | CGI | BDI*CGI | CREG | BGROWTH | INEFFIC | PROFIT | INDIV | BSDEV | GDPG | INFLA | |
| SROE | 1 | 0.698** | 0.002 | -0.004 | 0.001 | -0.408** | -0.178** | 0.087 | -0.343** | 0.251** | -0.023 | -0.005 | 0.052 |
| SROA | 1 | -0.088 | -0.036 | -0.085 | -0.496** | -0.181** | 0.144** | -0.423** | 0.186** | -0.121* | 0.006 | 0.023 | |
| BDI | 1 | 0.276** | 0.909** | -0.034 | 0.244** | 0.251** | -0.085 | 0.157** | 0.435** | -0.027 | 0.063 | ||
| CGI | 1 | 0.648** | 0.056 | 0.206** | 0.097 | -0.086 | 0.132* | 0.377** | -0.060 | 0.017 | |||
| BDI*CGI | 1 | -0.004 | 0.282** | 0.247** | -0.109* | 0.183** | 0.513** | -0.042 | 0.047 | ||||
| CREG | 1 | 0.138* | -0.144** | 0.391** | -0.088 | 0.117* | 0.016 | -0.069 | |||||
| BGROWTH | 1 | 0.046 | 0.006 | -0.300** | 0.452** | 0.149** | -0.098 | ||||||
| INEFFIC | 1 | -0.440** | 0.168** | 0.335** | 0.192** | -0.148** | |||||||
| PROFIT | 1 | 0.008 | -0.246** | -0.245** | 0.067 | ||||||||
| INDIV | 1 | -0.128* | -0.118* | -0.048 | |||||||||
| BSDEV | 1 | 0.353** | -0.307** | ||||||||||
| GDPG | 1 | -0.130* | |||||||||||
| INFLA | 1 | ||||||||||||
Multivariate Analysis
In this study, the standard deviation of return on assets (SDROA) and standard deviation of return on equity (SDROE) are used as a proxy for market risk of banks. These two are the vital measure of banks performance whose deviation reflects in the market place and make a clear sense in the investor's mind.
The study show that bank disclosure index (BDI), corporate governance (CGI) and multiple effects of bank disclosures and governance (BDI*CGI) negatively affect the market risk of the bank and are statistically significant at 1% level. It indicates that the market risk of banks is reduced by the higher volume of disclosure and strong government policy which in fact make the banks transparent to the investor’s mindset (Baumann and Nier, 2004). Among the bank level variable, CREG and INEFFIC have negative but statistically significant (P<0.01) effect on market risk whereas BGROWTH and INDIV have a positive impact. In macroeconomic variable, it is found that GDPG has negative effect on market risk whereas INFLA has a positive effect, but both are statistically significant Table 12.
| Table 12 Effect of Bank Disclosures and Governance on Bank Market Risk (SDROA) | ||||
| SDROA | ||||
| Model I | Model II | Model III | Model IV | |
| BDI | -1.2260*** | -1.3745*** | ||
| (0.3185) | (0.3374) | |||
| CGI | -0.0154 | -4.4165*** | ||
| (0.2039) | (0.9342) | |||
| BDI*CGI | -1.0738*** | |||
| (0.2268) | ||||
| CREG | -0.0256*** | -0.0293*** | -0.0146 | -0.0173** |
| (0.0072) | (0.0072) | (0.0101) | (0.0080) | |
| BGROWTH | 0.0028 | 0.0034 | 0.0125*** | 0.0072* |
| (0.0035) | (0.0034) | (0.0041) | (0.0041) | |
| INEFFIC | -0.0056*** | -0.0056*** | -0.0048*** | -0.0041*** |
| (0.0019) | (0.0018) | (0.0015) | (0.0016) | |
| INDIV | 0.0041*** | 0.0029** | 0.0068*** | 0.0077*** |
| (0.0013) | (0.0014) | (0.0018) | (0.0012) | |
| GDPG | -0.0286** | -0.0271* | -0.0715*** | -0.0477*** |
| (0.0140) | (0.0150) | (0.0163) | (0.0143) | |
| INFLA | 0.0274** | 0.0246** | 0.0400*** | 0.0453*** |
| (0.0130) | (0.0117) | (0.0130) | (0.0137) | |
| CONST | 2.0260*** | 2.2217*** | 5.0274*** | 1.5362*** |
| (0.3600) | (0.3673) | (0.9682) | (0.3032) | |
| No. of Banks | 32 | 32 | 32 | 32 |
| Observations | 346 | 346 | 346 | 346 |
| Adj. R- Squared | 39.97% | 40.36% | 41.57% | 43.27% |
| F -Value | 6.4669*** | 6.8493*** | 4.7277*** | 6.0672*** |
| Hansen J stat. (overid test) | 0.5060 | 0.5565 | 0.5949 | 0.1665 |
The dependent variable of market risk denoted by SDROE represents the true earnings volatility and which is used as an instrument of judging share price. The banks with a higher return on equity can maximize the market value. The study found that bank disclosure index (BDI) has negative and significant (P<0.01) effect on market risk (SDROE) because higher disclosures create a positive image in the marketplace and reduce the market risk-taking behavior of banks. It is also found that corporate governance index (CGI) has a positive but insignificant effect on market risk. However, the multiplie effect of disclosure and governance (BDI*CGI) has negativ eeffect on risk and also significant at 1% level. Among the bank level variables, CREG and INEFFIC have negative and significant (P<0.01) impact on market risk whereas BGROWTH and INDIV have positive effect. In macroeconomic variable, GDPG has negativeeffect on market risk, and INFLA has negative and also significant impact Table 13.
| Table 13 Effect of Bank Disclosures and Governance on Market Risk: Dependent (SDROE) | ||||
| SDROE | ||||
| Model I | Model II | Model III | Model IV | |
| BDI | -15.9667*** | -15.2612*** | ||
| (3.9991) | (3.7639) | |||
| CGI | 2.4427 | 1.0105 | ||
| (1.6957) | (1.8251) | |||
| BDI*CGI | -11.1272*** | |||
| (2.7454) | ||||
| CREG | -0.3819*** | -0.3686*** | -0.3266*** | -0.3183*** |
| (0.1130) | (0.1076) | (0.1235) | (0.1094) | |
| BGROWTH | 0.0273 | 0.0335 | -0.0862*** | 0.0418 |
| (0.0394) | (0.0419) | (0.0171) | (0.0453) | |
| INEFFIC | -0.0687*** | -0.0665*** | -0.0902*** | -0.0602*** |
| (0.0158) | (0.0161) | (0.0152) | (0.0190) | |
| INDIV | 0.0640*** | 0.0671*** | 0.0374** | 0.0733*** |
| (0.0159) | (0.0164) | (0.0193) | (0.0204) | |
| GDPG | -0.3256* | -0.3483* | 0.0963 | -0.3603** |
| (0.1954) | (0.1992) | (0.2168) | (0.1798) | |
| INFLA | 0.4173*** | 0.4318*** | 0.0783 | 0.4214*** |
| (0.1314) | (0.1351) | (0.1337) | (0.1509) | |
| CONST | 24.2581*** | 25.6316*** | 13.3111*** | 20.6681*** |
| (3.2998) | (3.9362) | (2.3332) | (3.0887) | |
| No. of Banks | 32 | 32 | 32 | 32 |
| Observations | 346 | 346 | 346 | 346 |
| Adj. R- Squared | 41.20% | 41.25% | 38.92% | 39.61% |
| F –Value | 5.5267*** | 5.6598*** | 5.1471*** | 5.5606*** |
| Hansen J stat. (overid test) | 0.6108 | 0.7074 | 0.1633 | 0.5851 |
The reversal effect of market risk on disclosures is showed in the Table 14. The study found that market risk has a positive impact on bank disclosure with coefficient 0.00187 (SDROA) and 0.00011 (SDROE). It indicates that higher market risk imposes the banks to produce more disclosures and provide in the market place to minimize the agency problem. Among the bank level variables, CGI has negative and also significant (P<0.01) on bank disclosures whereas BGROWTH and BAGE have a positive effect and even statistically significant at 1% level. The industry level variable, SMDEV has positive and significant (P<0.01) effect on bank disclosures. It indicates that capital market development (SMDEV) was confirmed by the availability of information in the marketplace. So, the markets can get response efficiently by eliminating the information asymmetry among groups. In macroeconomic variable, GDPG has positive and significant (P<0.01) effect on disclosure and INFLA has negative effect and also significant at 1% level of significance Table 14.
| Table 14 The Effect of Market Risk on Bank Disclosure | ||
| BDI | ||
| Model X | Model XI | |
| SDROA | 0.00187 | |
| (0.00136) | ||
| SDROE | 0.00011 | |
| (0.00007) | ||
| CGI | -0.12957*** | -0.12461*** |
| (0.05001) | (0.04812) | |
| BGROWTH | 0.00109*** | 0.00110*** |
| (0.00020) | (0.00022) | |
| BAGE | 0.00173*** | 0.00167*** |
| (0.00018) | (0.00016) | |
| SMDEV | 0.01755*** | 0.01749*** |
| (0.00103) | (0.00092) | |
| GDPG | 0.00879*** | 0.00863*** |
| (0.00171) | (0.00153) | |
| INFLA | -0.01898*** | -0.01859*** |
| (0.00157) | (0.00140) | |
| CONST | 0.66909*** | 0.66548*** |
| (0.03557) | (0.03388) | |
| No. of Banks | 32 | 32 |
| Observations | 346 | 346 |
| Adj. R2 | 83.71% | 83.66% |
| F value | 47.6516*** | 47.4993*** |
| Sargan test | 0.7537 | 0.8450 |
In Table 15, it has been shown that SDROA and SDROE, the proxy of market risk has a positive impact on bank governance structure with coefficient 0.0008 and 0.0001. It indicates that higher level of market risk bounds the banks to practice good governance system or otherwise, weak governance will increase the risk. Among the control variables, bank disclosure index (BDI) has negative effect on governance index whereas BGROWTH and BAGE have a positive impact and also statistically significant at 1% level. The industry level variable, SMDEV has a positive impact on risk with the coefficient of 0.0081 and 0.0077 and also significant at 1% level. The macroeconomic variable shows the results that are expected and also proved in the earlier models. It is found that GDPG has positive and significant (P<0.01) impact on bank governance index but INFLA has negative and significant effect.
| Table 15 The Effect of Market Risk on Corporate Governance | ||
| CGI | ||
| Model X | Model XI | |
| SDROA | 0.0008 | |
| (0.0009) | ||
| SDROE | 0.0001 | |
| (0.0001) | ||
| BDI | -0.0836* | -0.0835* |
| (0.0482) | (0.0485) | |
| BGROWTH | 0.0011*** | 0.0012*** |
| (0.0003) | (0.0003) | |
| BAGE | 0.0005*** | 0.0005*** |
| (0.0001) | (0.0001) | |
| SMDEV | 0.0081*** | 0.0077*** |
| (0.0010) | (0.0011) | |
| GDPG | 0.0056*** | 0.0056*** |
| (0.0014) | (0.0014) | |
| INFLA | -0.0151*** | -0.0152*** |
| (0.0020) | (0.0020) | |
| CONST | 0.9086*** | 0.9163*** |
| (0.0234) | (0.0224) | |
| No. of Banks | 32 | 32 |
| Observations | 346 | 346 |
| Adj. R2 | 59.38% | 59.93% |
| F value | 14.2699*** | 14.5771*** |
| Sargan test | 0.9783 | 0.8975 |
Conclusion
In Bangladesh, there is a stiff competition in the financial market to draw the considerable attention of the investors. To fill up the need for the stakeholders, financial institutions like a bank should provide more information through annual report so that the entire concerned group (both internal and external) can take their prudent decision. The information provider must ensure the qualitative characteristics (relevance, reliability, comparability, and consistency) of information. The study reveals that adequate disclosure can bite the market and minimize risks which ultimately increase the bottom line figure of the bank. Transparent bank disclosuresare ensured not only profitability but also create a permanent reliance on the investors which reduce future uncertainties. It is found that disclosing more information on key items of disclosure minimize the risk of the bank and also establish a transparent image in the marketplace.
This study supports to enhance transparent disclosure with strong governance mechanism so that it can minimize the rapid growth of risk. The issues relating to bank risk should address appropriately by the regulatory bodies as well as the management of the bank unitedly for ensuring a better financial position in the market. Stable financial position attracts the real investors and can avoid market disorder.
Appendices
Bank Disclosure Index
Bank disclosures index is constructed referring to the study of Nier and Baumann (2006) where they identified 17 items under four (4) heads, i.e. Assets, Liabilities, Memo lines and Income statement. They assign values corresponding to each item either “1” for disclosure or “0” for non-disclosure. They separately assign value of three items (S6, S7 and S13), “0” for non-disclosure, “1”for the total amount mention and “2” for detail breakdown. Additionally, they infer another situation based on these three (3) items, where “1” for detailed breakdown of the three and “0” for otherwise. The statement related disclosures are given below Appendix A:
| Appendix A Bank Disclosure Indices | |||||
| Sub-index | Categories | ||||
| Assets | |||||
| Loans | s1: Loans by maturity | Sub three months, three to six months, six months to one year, one to five years, more than five years | |||
| s2: Loans by type | Loans to municipalities/government, mortgages, HP/lease, other loans | ||||
| s3: Loans by counterparty | Loans to group companies, loans to other corporate, loans to banks | ||||
| s4: Problem loans | Total problem loans | ||||
| s5: Problem loans by type | Overdue/restructured/other non-performing | ||||
| Other earning assets | s6: Securities by type | Detailed breakdown: Treasury bills, other bills, bonds, CDs, equity investments, other investments | |||
| s7: Securities by holding purpose | Coarse breakdown: Government securities, other listed securities, non-listed securities, Investment securities, trading securities | ||||
| Liabilities | |||||
| Deposits | s8: Deposits by maturity | Demand, savings, sub three months, three to six months, six months to one year, one to five years, more than five years | |||
| s9: Deposit by type of customer | Banks deposits, municipal/government Other funding | ||||
| s10: Money market funding | Total money market funding | ||||
| s11: Long-term funding | Convertible bonds, mortgage bonds, other bonds, subordinated debt, hybrid capital |
||||
| Memo lines | |||||
| s12: Reserves | Loan loss reserves (memo) | ||||
| s13: Capital | Total capital ratio, tier 1 ratio, total capital, tier 1 capital | ||||
| s14: Contingent liabilities | Total contingent liabilities | ||||
| s15: Off-balance sheet items | Off-balance sheet items | ||||
| Income statement | |||||
| s16: Non-interest income | Net commission income, net fee income, net trading income | ||||
| s17: Loan loss provisions | Loan loss provisions | ||||
Corporate Governance Index
No. SEC/CMRRCD/2006-158/129/Admin/43: Whereas, the Securities and Exchange Commission (herein after referred to as the “Commission”) deems it fit that the consent already accorded by the Commission, or deemed to have been accorded by it, or to be accorded by it in future, to the issue of capital by the companies listed with any stock exchange in Bangladesh, shall be subject to certain further conditions, on 'comply' basis, in order to enhance corporate governance in the interest of investors and the capital market ( SEC Notification, 03 July 2012) Appendix B.
| Appendix B Summary of CG Compliance Items | ||
| S.N. | Sub Index | Disclosure Items |
| 1 | Board of Directors | 49 |
| 2 | Chief financial officer (CFO), Head of Internal Audit and Company Secretary (CS) | 2 |
| 3 | Audit Committee | 42 |
| 4 | External/Statutory Auditors | 9 |
| 5 | Subsidiary Company | 5 |
| 6 | Duties Of Chief Executive Officer (CEO) And Chief Financial Officer (CFO) | 4 |
| 7 | Reporting and Compliance of Corporate Governance | 2 |
| Total Items | 113 | |
End Notes
1.ISO 31000 is the set of rules codified by ISO relating to risk management.
2.Hausman first proposed such type of test in 1978.
References
- Akhtaruddin, M. (2005). Corporate mandatory disclosure practices in Bangladesh. The International Journal of Accounting, 40(4), 399–422.
- Alattar, J.M., & Al-Khater, K. (2007). An empirical investigation of users’ views on corporate annual reports in Qatar. International Journal of Commerce and Management, 17(4), 312–325.
- Al-Razeen, A., & Karbhari, Y. (2004). Interaction between compulsory and voluntary disclosure in Saudi Arabian corporate annual reports. Managerial Auditing Journal. 19(3), 351-360.
- Apostolik, R., Donohue, C., & Went, P. (2009). Foundations of Banking Risk. Wiley Finance, New Jersey.
- Baumann, U., & Erlend, N. (2004). Disclosure, volatility, and transparency: An empirical investigation into the value of bank disclosure. Federal Reserve Bank of New York Economic Policy Review, 10(2), 31-45.
- Beltratti, A., & Stulz, R.M. (2012). The credit crisis around the globe: Why did some banks perform better. Journal of Financial Economics, 105(1), 1-17.
- Beretta, S., & Bozzolan, S. (2004). A framework for the analysis of firm risk communication. The International Journal of Accounting, 39(3), 265-288.
- Berger, A.N. & Turk-Ariss, R. (2014). Do depositors discipline banks and did government actions during the recent crisis reduce this discipline? An international perspective. Journal of Financial Services Research,48, 103-126.
- Bischof, J., & Daske, H. (2012). Mandatory supervisory disclosure, voluntary disclosure and risk–taking of financial institution: Evidence from EU. New York Financial Services, 51(5).
- Boot, A., & Schmeits, A. (2000). Market Discipline and incentive problems in conglomerate firms with applications to banking. Journal of Financial Intermediation, 9(3), 240-273.
- Catasús, B. (2008). In search of accounting absence. Critical Perspectives on Accounting, 19(7), 1004-1009.
- Cebenoyan, A.S., Cooperman, E.S., & Register, C.A., (1999). Ownership structure, charter value, and risk-taking behavior for thrifts. Financial Management, 28,43-60.
- Chau, G., & Gray, S.J. (2010). Family ownership, board independence and voluntary disclosure: Evidence from Hong Kong. Journal of International Accounting, Auditing and Taxation, 19(2), 93–109.
- Cordella, T., & Yeyati E.L., (1998). Public disclosure and bank failures. IMF Staff Papers, 45(1), 110-131
- Deumes, R., & Knechel, R.W. (2008). Economic incentives for voluntary reporting on internal risk management and control systems. Auditing: A Journal of Practice & Theory, 27(1), 35-66.
- Erkens, D.H., Hung, M., & Matos, P. (2012). Corporate governance in the 2007–2008 financial crises: Evidence from financial institutions worldwide. Journal of Corporate Finance, 18(2), 389-411.
- Fama, E.F., & Jensen, M.C. (1983). Separation of ownership and control. Journal of Law and Economics, 26, 301-325.
- Flannery, M.J. (2001). The faces of market discipline. Journal of Financial Services Research, 20(2), 107-119
- Greuning, H., & Brajovic-Bratanovic, S. (2003). Analyzing and managing banking risk: A framework for assessing corporate governance and financial risk management (English). Washington DC; World Bank.
- Hirtle, B., (2007). The impact of network size on bank branch performance. Journal of Banking & Finance, 31(12), 3782-3805.
- Hossain, M. (2008). The extent of disclosure in annual reports of banking companies: The case of India. European Journal of Scientific Research, 23(4), 659-680.
- Jorion, P. (2003). Financial risk manager handbook (2nd ed). New York, Chichester: Wiley.
- Konishi, M., & Yasuda, Y. (2004). Factors affecting bank risk taking: Evidence from Japan. Journal of Banking & Finance, 28, 215-232.
- Laeven, L., & Levine, R. (2009). Bank governance, regulation and risk taking. Journal of Financial Economics, 93, 259-275.
- Linsley, P.M., & Shrives, P.J. (2006). Risk reporting: A study of risk disclosures in the annual reports of UK companies. The British Accounting Review, 38(4), 387-404
- Linsley, P., & Shrives, P. (2000). Risk management and reporting risk in the UK. Journal of Risk & Insurance, 3(1), 115-129.
- Linsley, P.M., Shrives, P.J., & Crumpton, M. (2006). Risk disclosure: An exploratory study of UK and Canadian banks. Journal of Banking Regulation, 7(3/4), 268-282.
- Naser, K., & Nuseibeh, R. (2003). Users’ perceptions of corporate reporting: Evidence from Saudi Arabia. The British Accounting Review, 35(2), 129-153.
- Nier, E.W., (2005). Bank stability and transparency. Journal of Financial Stability, 1, 342-354
- Nier, E., & Baumann, U. (2006). Market discipline, disclosure and moral hazard in banking. Journal of Financial Intermediation, 15(3), 332-361.
- Pass, C., (2004). Corporate Governance and the role of non-executive directors in large UK companies: An empirical study. Corporate Governance, 4(2), 52-63.
- Putu., Nyoman., Moeljadi., Djumahir, & Djazuli. (2014). Factors affecting firm value of Indonesian Public Manufacturing. Quarterly Journal of Economics, 118, 107-155.
- Rezaee, Z. (2009). Corporate Governance and Ethics. John Wiley & Sons, Inc, USA.
- Saunders, A., Strock, E., & Travlos, N.G., (1990). Ownership structure, deregulation, and bank risk-taking. Journal of Finance, 45(2), 643-654.
- Spanos, L.J. (2005). Corporate governance in Greece: Development and policy implications. Corporate Governance, 5(1), 15-30.
- Wooldridge, J.M. (2006). Introductory Econometrics: A Modern Approach (Third Edition). Thomson Learning Inc.