Research Article: 2023 Vol: 27 Issue: 3S
Socially Responsible Investing: Evaluation of the performance of India’s ESG Funds Using Traditional Risk Adjusted Metrics
Harsh Thakrar, ASMSOC NMIMS University
Charu Bhurat, ASMSOC NMIMS University
Citation Information: Thakrar, H., & Bhurat, C. (2023). Socially responsible investing: evaluation of the performance of india’s esg funds using traditional risk adjusted metrics. Academy of Accounting and Financial Studies Journal, 27(S3), 1-13.
Abstract
ESG is still a new term in India, and companies are hesitant to invest in it because they are afraid it will hurt their profits. This article looks at the results of Socially Responsible Investment Funds and Socially Responsible Indices. It compares the financial performance of ESG funds in India to that of market benchmarks and tries to dispel the myths that most investors have about ESG and ESG investing. This research seeks to evaluate the performance of India's ESG funds using the 'traditional' risk-adjusted metrics of Jensen’s Alpha, Sharpe Ratio, and Treynor Ratio, which have been employed in large number of prior studies.
Keywords
Socially Responsible Investing, ESG, ESG Funds, Financial Performance, Performance Evaluation.
JEL Classification
G11, G14.
Introduction
The term "Socially Responsible Investing" (SRI) as stated by Social Investment Forum 2006 refers to an investment strategy that evaluates the positive and negative social and environmental consequences of investments within the framework of in-depth financial analysis. This type of investing is also known as "Impact Investing." The procedure of locating and investing in a business that satisfies the requirements of corporate social responsibility (also known as CSR) is another name for this process. An investor who prioritises social responsibility will only put their money into the stocks of socially responsible businesses, passing up opportunities to buy the shares of other companies. Although SRI is not a new concept, it has been gaining popularity in recent years as a result of an increased focus on Corporate Social Responsibility (CSR) among businesses. The global financial crisis, global warming, environmental degradation, enormous corporate frauds, the inability of major corporations to address social problems, and growing societal awareness are some of the factors that have contributed to the mainstream adoption of CSR. Other factors that have played a role include the global economic recession, global warming, and environmental degradation. Because of this, Environmental, Social, and Governance (ESG) factors have been given the opportunity to play a more significant role in investment decisions.
SRI and ESG investments are a market category that is gradually expanding as more people become interested in them. According to research conducted by the Social Investment Forum (2006), one dollar out of every ten dollars managed by professionals in the United States is invested in accordance with socially responsible principles. This expansion is being driven by investors who, during the investing process, apply a variety of social and environmental filters to their decisions. Even though SRI is a relatively new concept for investors in India, businesses have started taking into account the crucial aspects of the strategy whenever they make decisions regarding investments. The three indices for sustainable investing that are offered by the BSE are the S&P BSE Carbonex, the S&P BSE Greenex, and the S&P BSE 100 ESG. It is essential to investigate how India's sustainability investment indexes contribute to the realisation of the United Nations Sustainable Stock Exchanges Initiatives.
The primary objective of this study is to analyse and keep track of the social or ethical performance of socially responsible stock portfolios that are traded on the Indian stock exchange. We evaluate whether investors are required to make a financial sacrifice by weighing their morals against their financial returns. This is done by comparing the performance of established ESG funds on the market to that of the market while making use of appropriate market benchmarks. This helps us determine whether investors are required to make a sacrifice.
Literature Review
Schroder (2004) assesses the performance of SRI equity investment funds in the United States, Germany, and Switzerland, as well as well-known SRI equity indices like the Domini 400. A larger group of benchmark assets is investigated in addition to previous evaluations. According to the data, the majority of SRI investment funds in Germany, Switzerland, and the United States do not outperform their benchmarks significantly. The majority of US funds invest in blue chip stocks, whereas German and Swiss funds focus on smaller companies. Two of the ten SRI indexes were able to debunk the myth that SRI assets perform similarly to conventional assets. When compared to traditional funds, SRI funds have no discernible performance disadvantage. Their risk-adjusted performance is comparable to that of CFs, and investors should not expect a much lower return due to the short investment horizon.
Giamporcaro & Pretorius (2012) investigated whether South African Sustainable and Responsible Investment (SRI) products and strategies are environmentally sustainable. It is based on a qualitative and empirical examination of 22 organisations that either adhere to or provide SRI products in accordance with the UN's Principle for Responsible Investment. The authors discovered that the vast majority of SRI products and strategies are primarily focused on social development goals, while environmental criteria do not yet receive comparable attention from the SRI South African fund management industry, based on how ESG criteria are used in investment decision making and share ownership decisions. This article describes the state of SRI in South Africa in 2009 and investigates whether and how the country's investing business addresses environmental issues. The authors demonstrated that the majority of SRI goods and techniques are geared toward inclusive growth by examining the local SRI business. SRI's focus on South Africa reflects the country's specific socioeconomic challenges.
Sakuma & Louche (2008) examine the birth and development of socially responsible investing (SRI) in Japan in their article. In Japan, SRI is a relatively new discipline. It is unclear whether it will embrace the American, European, or its own model. By analysing the historical origins of SRI, key players, and factors that contributed to its dispersion, the research provides exploratory grounds for sketching the translation mechanisms of SRI in Japan and provides insight into its future trajectory. The analysis shows that, while SRI in Japan shares some similarities with the American and European models, it is distinct. It emphasises the significance of translation and redefinition when implementing a strategy in a new context. SRI is still under construction in Japan. Although it is expected to evolve further, its future shape and form are difficult to predict. The SRI is currently undergoing a translation process that will necessitate changes. This operation is still ongoing. In Japan, the SRI sector is still in the early stages of development, with rapid changes taking place. As a result, predicting the future shape and form of SRI in Japan has become difficult.
Lean et al. (2015) compare and analyse SRI fund performance and performance persistence in North America and Europe. A large sample of 500 European and 248 North American SRI funds was used from January 2001 to December 2011. The ability of a fund or portfolio to maintain its performance ranking in comparison to other funds over time is referred to as performance persistence. Investors purchase funds that are currently performing well and will continue to do so in the future. Investing in funds with a track record of consistent performance can thus be a highly effective way to generate abnormal returns. According to the study's preliminary findings, SRI funds in Europe and North America outperform the market benchmark. According to this study, European and North American investors can address environmental, ethical, and societal concerns without sacrificing financial success. According to the data, the lack of diversity among SRI funds has no negative impact on their financial performance. The second finding appears to be that SRI funds in North America outperform SRI funds in Europe. There is limited evidence of performance persistence; however, data show that European SRIs outperform their North American counterparts.
De la Torre et al. (2016) investigate the mean-variance efficiency of Mexico's sustainable investing strategy by demonstrating statistical equivalence between the IPC sustainability (IPCS) index and the overall market. Using data from 2008 to 2013, the results showed that the SRI approach in Mexico is as mean-variance efficient as the wide market strategy and is a viable long-term substitute for the latter. Experiments revealed that under certain conditions, the premise "The IPC sustainability index is as mean-variance efficient as the IPC broad market" holds true. The data show that the IPCS fluctuates at a statistically comparable rate to the larger market, demonstrating that investing in Mexico does not pose a higher risk than investing in the broader market due to a lack of diversification. The data also show that a sustainable investment in Mexico (IPCS) carries the same level of risk as a market investment. The statistical equality of risk exposure suggests that sustainable investments could be used in place of conventional ones.
Hill et al. (2007) investigate the relationship between corporate social responsibility (CSR) and stock valuation in three global locations in their research. This global report compares socially responsible investments to the larger stock markets in the United States, Europe, and Asia to assess corporate social responsibility. Based on an analysis of the world's largest socially responsible mutual funds, ten or more firms were chosen for each portfolio. According to the authors, only the European fund outperformed the broader equity market in the short term. Over the medium term (5 years), neither of these data were relevant, but over the long run (10 years), both the US and European portfolios outperformed the stock markets. The fact that the Asian portfolio was nearly relevant during this time period is intriguing, as it suggests that they may be approaching their western counterparts. European investors place a premium on CSR in both the short and long term, but Asian investors may be following in the footsteps of their American counterparts. If these findings are confirmed, the importance of CSR operations to multinational corporations may continue to grow.
The study by Fernandez-Izquierdo & Matallin-Saez (2008) sought to determine whether ethical investing (SRI) represents a sacrifice or a premium for Spanish investors. The Spanish retail market for SRI funds is still in its infancy, and they have not been studied in any way. The authors examined a wide range of mutual funds with varying investment objectives. From 1998 to 2001, the study looked at 2,064 funds, only 13 of which were labelled as ethical and solidarity funds. According to the data, the funds do not outperform the market on average, which is consistent with the efficient market hypothesis. Individual fund performance, on the other hand, varies due to the diversity of fund managers and the anticipated transformation of the fund industry into a more competitive market. Previous research has found no significant differences between ethical funds and certain other funds in the pooled investment business in the United States. Financial performance (FP) of ethical funds is superior to or equal to that of all other funds, according to an aggregate analysis.
According to Escrig-Olmedo et al. (2013), their main goal was to investigate public perceptions of socially responsible investing and to identify investor preferences for environmental, social, and governance concerns, as well as their actual investment needs and the most appropriate sustainable financial solutions. A survey of Spanish investors was conducted to ascertain how the Spanish public views SRI. The findings indicate that SRI is still in its early stages, and that Spanish investors want more specific information on social, environmental, and governance factors before investing in socially responsible firms and products. This paper outlines certain guidelines that Spanish organisations, executives, and shareholders, as well as international managers, may employ when entering the Spanish market in order to promote the development of socially responsible financial products.
Kempf & Osthoff (2007) investigate the impact of a variety of socially responsible criteria on the performance of screened stock portfolios in their paper. They used techniques such as negative, positive, and elite screening. If investors follow the negative screening policy, all businesses involved in ostensibly problematic business sectors are excluded from the investment pool. Positive screening does not result in the removal of all firms operating in risky business areas; rather, it assigns a score to each company based on a set of criteria. The firms with the highest scores are then chosen by investors. Best-in-class screening follows the same basic principles as positive screening but ensures that the final portfolio is distributed equitably across sectors. From 1992 to 2004, the authors used their trading strategy on S&P 500 and DS 400 stocks. The study's findings are as follows: Investors can generate extremely large abnormal returns by employing either the positive or best-in-class screening strategies, but not the negative screening technique, when using a basic long-short strategy. Investors use the most effective screening approach when they use a combination of several SRI screens and limit themselves to stocks with the highest SRI ratings.
Using daily returns data from December 2015 to April 2019, Rehman et al. (2021) examine the link between socially responsible funds and the conventional energy market. The findings of the paper show that using correlation, various quantile distributions provide diverse investment opportunities. Under adverse market conditions, investors may benefit from asset diversification in the short run. In the medium and long term, there are no significant opportunities for diversification. Individual investors who invest over a variety of time horizons and market conditions may find the findings useful. These findings are consistent with those obtained in bullish market conditions, indicating that, in the short term, both markets generate optimal returns by exhibiting a low correlation pattern during severe market conditions.
Arefeen & Shimada (2020) investigated the performance and resilience of socially responsible and conventional funds listed by the Japan Investment Trust Association in 2016 despite two economic shocks in their study. During the election period, the United States election had a significant positive impact on fund returns in Japan, while the Brexit referendum had a significant negative impact. According to empirical data, socially responsible funds were more resistant to the uncertainty surrounding the 2016 US presidential election than conventional funds, but conventional funds were more sensitive during the Brexit referendum. Using an event study technique, this study examined the performance and resilience of both SRI and conventional funds in 2016. These economic shocks are expected to have an impact on Japan's fund volatility. The negative average cumulative abnormal return of both SRI and conventional funds validated the negative shock to Japanese funds caused by Britain's exit from the European Union. The study found that socially responsible funds were more sensitive to the uncertainty surrounding the 2016 presidential election in the United States than conventional funds. In contrast, the Brexit referendum resulted in the opposite outcome. Conventional Japanese corporations may have more bilateral economic relationships with the United Kingdom and the European Union than with the United States, when compared to socially responsible funds.
Sotorrio & Sánchez (2008) examine the performance of a sample of European equities funds from 2003 to 2007 to see if there is a link between investing in socially responsible firms (the social side of the investment) and the funds' financial success. The study's main finding is that incorporating social characteristics into investment decisions results in lower returns for the investor. Examining these statistics reveals that, on average and over time, the social component of the investment has a negative effect on relative performance, implying that socially responsible investing costs the investor money. The impact on return is greater than the impact on overall portfolio risk. The lower return of the assets in which the fund invests is one explanation for the significantly lower return of SRI funds compared to conventional funds, based on the model's assessment of the other fundamental factors influencing fund return.
Yue et al. (2020) The study sought to determine if sustainable investments pose additional risks. Examining diverse perspectives on long-term investments to identify risks. A statistical study was done to determine the benefits of long-term investment in Asia-Pacific. This study compares the economic performance of sustainable and conventional funds without considering the social benefits. This study examined 30 sustainable and conventional funds. Sustainable funds are less risky than conventional funds, says this study. The authors note that as the demand for socially responsible investments rises, so do the associated risks. No evidence suggests sustainable funds can outperform benchmark indexes. Between 2014 and 2018, researchers gathered data. This time frame was chosen because sustainable investment needs increased in 2019. Demand for eco-friendly assets soared as central banks entered green finance. Thus, sustainable funds for earlier positions became more profitable, but this had little effect on future developments.
From 1992 to 2012, including the global financial crisis, Becchetti et al. (2015) compare how well socially responsible funds and other funds have done in a number of market categories. Using a sample of more than 22,000 funds and different methods, they compare the performance of portfolio managers. This article came to three main points: First, it doesn't look like one way of investing is better than another over the whole time period and across all market types. Second, it seems that all of the methods looked at show that SRFs do better than CFs after a financial crisis. Third, the fact that SRFs can only invest in a small number of markets doesn't seem to be a problem, since they do better in small markets than in the world market as a whole. During the 2007 Financial Crisis, SRFs did a better job as an "insurance function" than CFs did.
Jones et al. (2008) compare the performance of SRI Funds and Conventional Funds in Australia between 1986 and 2005. When such a large sample size is used, selection bias and other types of sampling error are reduced. Furthermore, examining the returns performance of the sample SRI fund over a longer and more recent time period provides a completer and more accurate picture of SRI fund performance in Australia. The authors conclude that SRI investments may incur a financial penalty. However, it is a relative cost. SRI funds, like traditional funds, trailed market indexes by a significant margin. Several Australian funds perform similarly to (or worse than) the market benchmark. As a result, the financial cost of SRI investments in Australia may not be disproportionately high when compared to the performance of conventional funds. Several previous studies, contrary to the findings of this study, have found no statistically significant differences in the performance of SRI funds and market benchmarks and/or conventional funds.
Galbreath (2013) examines ESG performance using a longitudinal database of Australian corporations from 2002 to 2009. ESG risk management is important to investors, shareholders, and governments, but it's also a part of Australian companies' competitive strategies. This study examined ASX300 ESG performance over eight years. Given Australia's institutional emphasis on ESG issues, businesses are effectively reacting by improving ESG performance. In terms of environmental, social, and governance (ESG) challenges and trade-offs, CEOs are focusing more on increasing corporate governance, especially after the dot-com boom and the Great Recession. High impact industries, or those expected to face higher institutional pressure to address ESG concerns, outperformed medium and low impact enterprises only on the social dimension, not the governance or environmental dimensions.
Ortas et al. (2013) The purpose of this paper is to evaluate the effects of incorporating environmental, social, and governance issues into core investment processes in the Asia-Pacific region in order to encourage cleaner production through investment. The focus is on the Dow Jones Sustainability Asia Pacific index (DJSI-AP), which includes the most sustainable Asian companies. The DJSI-AP study explains SRI's financial performance in that region. This study offers methodological changes that will result in more reliable and solid findings, overcoming previous research limitations. The DJSI-AP did not outperform the DJ-G in risk-adjusted returns. Modern Portfolio Theory (MPT), which predicts negative financial consequences from investing in SRI equities indexes, cannot be denied in this context or time period. Even if companies identify cost-effective and technically feasible cleaner production options, they may be unable to make the necessary investments, which could hurt their financial performance. Strong environmental performance is linked to company health and management, so companies are pushed to adopt cleaner production practices. DJSI-AP was safer than DJ-G.
Humphrey et al. (2012) examine environmental, social, and governance factors on British business success in 2012. In this paper, the authors investigate whether UK companies with high environmental, social, and governance ratings have better financial performance and risk. Analyzing E, S, and G separately reveals the link to financial performance. According to statistics, investing in E, S, or G firms has no costs or benefits. These businesses differ little from those with poor ratings in systemic risk, book-to-market ratios, and historical performance. The authors found no performance difference between portfolios of high- and low-rated firms. High E, S, or G-rated businesses grow more often. This is expected. Larger companies can invest more in ESG. E, S, or G factors have no monetary impact or benefit, the findings show. Good E, S, or G grades don't indicate lower returns or a fiduciary obligation to boost profits. Good E, S, or G-rated stocks are larger, more liquid, and easier to trade, making them more attractive to institutional investors.
Boitan (2020) research examines sustainability stock market indices to determine if there is synchronisation between price returns generated by different geographic sustainability indices. The investigation covered six Dow Jones Sustainability Indices. It was based on each Dow Jones Sustainability Index's 10-year daily price return series (2010–2019). The findings confirm that regional sustainability indicators are more connected and synchronised than others. Sustainability indexes, which include Europe, Japan, the U.S., the world's developed countries, and the world's best-in-class, have correlated price returns and are synchronised, but the DJSI for emerging countries is far behind. First five indices are interchangeable. Second, the emerging economies sustainability index can be used to diversify investor portfolios.
Jain et al. (2019) aimed to see if sustainable investment alternatives outperformed traditional indexes from both developed and developing countries in terms of financial returns This article examines the financial returns of global indices, particularly developed market ESG indices, to ensure consistency. The study also looks at how these markers interact with one another. The daily closing prices of all benchmark indexes were collected from 2013 to 2017. The analysis reveals that conventional and sustainable indices are linked, with data flowing back and forth between the two investment strategies. The data show that there is no significant performance difference between sustainable and traditional conventional indicators, implying that sustainable indicators can be used in place of conventional ones. As a result, financial/investment managers can gain more insight into investment decisions, and the study recommends that their portfolios include both indexes for risk diversification and hedging in order to reap the benefits of both. Corporate leaders will also use it to compare their own performance to that of their peers and to stay up to date on the latest news. The results show that there is no significant performance difference between sustainable indices and traditional conventional indices, which is consistent with previous research findings.
Data Analysis
The funds chosen for this study consist of stocks chosen based on social, ethical, and environmental criteria, with the majority of the funds being equity mutual funds. Furthermore, these funds have a minimum equity weighting of 94 percent, and the majority of the investment funds examined invest solely in equities or debt. The funds' data is gathered from the Yahoo Finance database, while the Nifty 100 ESG index and the NIFTY 50 index is gathered from the index provider’s website. The fund prices used as the study's foundation measure the funds' net asset value (NAV). 10-year Government of India Bond Yields are factored for the risk-free rate.
The duration of the time series chosen is an important selection criterion for SRI and ESG investment funds; only the major funds for which data is available before March 2021 were chosen, and the series concludes in March 2022. As a result, the price series must be at least 12 months long. The full available price series since the inception of the individual funds was used for all calculations, resulting in a significantly longer sample period for most investment funds and indices.
Many of these new funds came out after the pandemic in 2020, which made investors more aware of ESG and the idea of "responsible investing." But some of the fund and index series used are also short, which means that the results may be less accurate than they could be. The selected equity mutual funds only invest in Indian stocks, and a look at their SRI and ESG investment criteria shows that they are more similar to each other than their foreign counterparts. They use a wide range of good and bad criteria, and almost all of these funds don't invest in businesses like gambling, nuclear energy, making harmful things like alcohol and tobacco, and making military weapons.
In Table 1, all of the funds and indices that have been looked into for this study are listed. We also looked at their assets and how they are split up in their portfolios. This showed us that equity and debt are the two main types of investments that these funds make. Most of the funds that were looked at have a market capitalization of more than INR 1000 crore, and the total value of their assets is more than INR 10,000 crore.
| Table 1 New Funds Came Out After The Pandemic In 2020 |
|||
|---|---|---|---|
| Fund Name | Fund Type | Allocation | |
| Equity | Debt | ||
| SBI Magnum Equity ESG Fund | Equity Mutual Fund | 99.30% | 0.50% |
| Aditya Birla Sun Life ESG Fund | Equity Mutual Fund | 98.23% | 1.34% |
| Axis ESG Equity Fund | Equity Mutual Fund | 97.67% | 1.88% |
| ICICI Prudential ESG Fund | Equity Mutual Fund | 94.11% | 0.30% |
| Invesco India ESG Equity Fund | Equity Mutual Fund | 98.11% | 0.00% |
| Mirae Asset ESG Sector Leaders Fund of Fund | Equity ETF | 99.46% | 0.00% |
| Kotak ESG Opportunities Fund | Equity Mutual Fund | 98.27% | 0.60% |
| Quantum India ESG Equity Fund | Equity Mutual Fund | 94.20% | 5.70% |
| Quant ESG Equity Fund | Equity Mutual Fund | 100.00% | 0.00% |
| NIFTY 100 ESG Index | Thematic Index | 100.00% | 0.00% |
Methodology
To evaluate the performance of ESG funds, several one-parameter performance measures have been used:
1. The excess return to the measure of variability (Sharpe Ratio),
2. The excess return to risk that is non-diversifiable (Treynor Ratio), and
3. The differential return with risk measured by the beta of the fund (Jensen’s alpha).
The selected ESG funds' mean returns and performance were first estimated and compared to those of the NIFTY 50 index, which was used to approximate market performance. Using daily data for an entire year, this analysis calculates logarithmic returns. Table 2 displays the average logarithmic returns earned by ESG funds and the market overall since the funds' inceptions. One can see that the average logarithmic returns for both are very close to one another, suggesting that the two funds' performances are comparable to those of the market as a whole. However, given that the market risk-free rate and market risks are not taken into account, these proxies cannot be considered an accurate reflection of the market. Therefore, we consider three additional metrics to get a more accurate picture of these factors.
| Table 2 Average Logarithmic Returns Earned By Esg Funds |
||
|---|---|---|
| Fund Name | Mean Log Returns Fund | Mean Log Returns Market |
| Axis ESG Equity Fund | 0.12% | 0.11% |
| Aditya Birla Sun Life ESG Fund | 0.09% | 0.08% |
| SBI Magnum Equity ESG Fund | 0.08% | 0.07% |
| ICICI Prudential ESG Fund | 0.07% | 0.10% |
| Invesco India ESG Equity Fund | 0.10% | 0.07% |
| Mirae Asset ESG Sector Leaders FoF | 0.08% | 0.09% |
| Kotak ESG Opportunities Fund | 0.06% | 0.07% |
| Quantum India ESG Equity Fund | 0.07% | 0.06% |
| Quant ESG Equity Fund | 0.19% | 0.11% |
| NIFTY 100 ESG Index | 0.06% | 0.06% |
A comparison on ESG funds to market benchmarks using a variety of ratios. Ratio analysis is performed prior to almost all investment choices in the financial and equity markets. Metrics must be understood in the context of each participant's goals in the market. This is due to the fact that these ratios reveal crucial details about an investment, including its potential for profit. Due to the fact that they compare the market performance of various portfolios or securities, these ratios play an integral role in decision making. The Sharpe and Treynor performance ratios were used in this analysis (SR & TR). Each fund's performance is measured against the market by comparing its SR and TR to those of the NIFTY 50 index.
William F. Sharpe, a Nobel laureate in economics, developed the Sharpe ratio so that investors could compare the potential return of an investment with its inherent risk. The Sharpe ratio measures the average excess return over the risk-free rate per unit of volatility or total risk. Higher values for the Sharpe ratio indicate a superior portfolio.
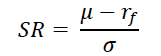
Where, μ = mean of logarithmic return of portfolio/security, rf = mean of logarithm of the risk-free interest rate, σ = standard deviation of the logarithmic returns of the portfolio/security. The risk-free interest rates taken for this study are the Indian 10-year Government Bond Yields. The Sharpe ratios of the funds and the NIFTY ESG 100 Index are compared to the Sharpe ratio for the NIFTY 50 index for the same period. The calculations use the full available data history of the ESG funds and the past 2 years data for the NIFTY 100 ESG index.
Table 3 shows that most of the funds have a higher Sharpe ratio than the NIFTY 50 index, even though the difference is not very big. This means that most of these funds seem to do as well as (or even better than) the market as a whole. Using the Sharpe ratio, we can see that six of the ten funds that were looked at for this study do as well as or better than the market.
| Table 3 Nifty 50 Index |
|||
|---|---|---|---|
| Fund Name | Period | Sharpe Ratio (Fund) | Sharpe Ratio (Market) |
| Axis ESG Equity Fund | 2020-22 | 10.39% | 6.38% |
| Aditya Birla Sun Life ESG Fund | 2020-22 | 3.12% | 2.28% |
| SBI Magnum Equity ESG Fund | 2020-22 | 5.39% | -4.69% |
| ICICI Prudential ESG Fund | 2020-22 | 1.45% | 3.93% |
| Invesco India ESG Equity Fund | 2021-22 | 5.88% | 2.25% |
| Mirae Asset ESG Sector Leaders FoF | 2020-22 | -0.40% | 0.44% |
| Kotak ESG Opportunities Fund | 2020-22 | -0.53% | 0.92% |
| Quantum India ESG Equity Fund | 2019-22 | 9.85% | 7.23% |
| Quant ESG Equity Fund | 2020-22 | 9.06% | 3.00% |
| NIFTY 100 ESG Index | 2019-22 | 8.39% | 7.47% |
The Sharpe Ratio is a broad concept that takes into account both systematic and unsystematic risks. It can be said that the market does not reward the portfolio/fund manager for taking risks that can be spread out. So, after the Sharpe Ratio, the next model used to judge performance is the Treynor Ratio, which is a narrower measure than the Sharpe Ratio. Jack Treynor, an accomplished American economist and one of the founders of the Capital Asset Pricing Model, came up with the Treynor ratio as a way to measure performance. It figures out how much more money a financial asset or group of securities makes for each extra unit of risk the portfolio takes on.
The Treynor ratio, which is also called the reward-to-volatility ratio, is a performance indicator used to figure out how much extra return a portfolio made for each unit of risk it took on. The Treynor Ratio only looks at the systematic risk because it can't be changed and affects the whole market at once. The beta of a portfolio is used to measure the systematic risk of a portfolio. Beta is a measure of how much a portfolio's return tends to change in relation to the changes in the return of the market as a whole. Investors and analysts use this metric to compare the performance of different investment opportunities by removing the risk associated with the volatility component of each investment. By taking this risk into account, investors can compare how each fund or investment has done financially.
The Treynor measure, often known as the reward-to-volatility ratio, is calculated analogous to how the Sharpe ratio is calculated. The Treynor ratio is determined as follows:
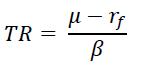
Where, μ = mean of logarithmic return of portfolio/security, rf = mean of logarithm of the risk-free interest rate, β= beta of the portfolio/security w.r.t the market for the given period. The risk-free interest rates taken for this study are the Indian 10-year Government Bond Yields.
Table 4 shows that most of the funds have a higher Treynor ratio than the market, which means they make more money if the market as a whole is exposed to the same risks at the same time. Using Treynor's ratio, six of the ten funds studied for this study do as well as or better than the market. Also, almost all ESG funds have betas that are less than 1, indicating they are less volatile than the market and less likely to be affected by common market risks.
| Table 4 Higher Treynor Ratio Than The Market |
|||
|---|---|---|---|
| Fund Name | Beta | Treynor Ratio (Fund) | Treynor Ratio (Market) |
| Axis ESG Equity Fund | 0.8709 | 0.14% | 0.12% |
| Aditya Birla Sun Life ESG Fund | 0.9959 | 0.04% | 0.02% |
| SBI Magnum Equity ESG Fund | 0.9049 | 0.06% | 0.05% |
| ICICI Prudential ESG Fund | 0.9277 | 0.01% | 0.05% |
| Invesco India ESG Equity Fund | 0.9568 | 0.06% | 0.02% |
| Mirae Asset ESG Sector Leaders FoF | 0.9608 | 0.00% | 0.00% |
| Kotak ESG Opportunities Fund | 0.9585 | -0.01% | 0.01% |
| Quantum India ESG Equity Fund | 0.9168 | 0.13% | 0.12% |
| Quant ESG Equity Fund | 1.0333 | 0.12% | 0.03% |
| NIFTY 100 ESG Index | 0.9845 | 0.12% | 0.11% |
The Jensen's Alpha measure is the third and last model used to measure how well the ESG funds do. The Jensen's measure, also called Jensen's alpha, is a risk-adjusted performance measure that shows the average return on a portfolio or investment, above or below the return predicted by the capital asset pricing model (CAPM), given the beta for the portfolio or investment and the average market return. It's the difference between the fund's expected risk-adjusted return and what it actually earned. If the value for Jensen's Alpha is positive, the portfolio is making more money than it should. Most fund managers want their investments to have a higher alpha because that means their investments did better than the market benchmarks. In other words, if Jensen's alpha has a positive value, it means that a fund manager has "beaten the market" with how they choose stocks. Excess return, also called the alpha of the security, is a way to measure how well or poorly a fund did compared to the benchmark it was compared to. The goal is to figure out Jensen's alpha, which is the difference between risk and return as measured by the beta of the fund. This is calculated with the following formula:
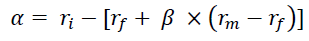
Where, ri is the return on the investment/ portfolio, rf is the return on the risk-free rate, β is the Beta of the security w.r.t the market portfolio and rm is the return of the market.
Compared to the Sharpe and Treynor Ratios, the Jensen's alpha metric is a more precise way to measure how well different funds are doing. The ability of a portfolio manager to predict the future is measured by this standard. It's the ability to make more money than we might expect, given how risky his portfolio is, by making accurate predictions about the prices of securities. Jensen's alpha is based on the lognormal returns and excess returns of the fund over the given sample period. The risk adjusted and normal Jensen's alpha for the funds and the NIFTY 100 ESG Index are shown in Table 5 below.
| Table 5 Nifty 100 Esg Index |
|||
|---|---|---|---|
| Fund Name | Beta | Jensen's Alpha | Jensen’s Alpha Using Excess Returns |
| Axis ESG Equity Fund | 0.8709 | 0.03% | 0.06% |
| Aditya Birla Sun Life ESG Fund | 0.9959 | 0.01% | 0.01% |
| SBI Magnum Equity ESG Fund | 0.9049 | 0.01% | 0.01% |
| ICICI Prudential ESG Fund | 0.9277 | -0.03% | -0.03% |
| Invesco India ESG Equity Fund | 0.9568 | 0.03% | 0.03% |
| Mirae Asset ESG Sector Leaders FoF | 0.9608 | -0.01% | -0.01% |
| Kotak ESG Opportunities Fund | 0.9585 | -0.02% | -0.02% |
| Quantum India ESG Equity Fund | 0.9168 | 0.02% | 0.03% |
| Quant ESG Equity Fund | 1.0333 | 0.09% | 0.09% |
| NIFTY 100 ESG Index | 0.9845 | 0.01% | 0.01% |
Results
Based on the three measures used, it is possible to compare the overall performance of ESG funds to that of market benchmarks. Using Jensen's measure, we can see that seven of the ten funds have a slightly positive alpha, which means they are likely to make money. The funds' calculated alphas are very close to zero.
When comparing the performance of ESG funds to that of the Market, the Jensen measure gives the most favourable picture. This is because SRI funds tend to have betas that are less than one, which means that their alphas are higher. On the other hand, the Treynor Ratio tends to be higher for funds with higher betas.
Seven ESG funds outperform the market when all three metrics are considered. Therefore, there are 7 funds where the metrics agree that they perform better than the market on average. There is some evidence that the funds under consideration have a slight edge over the market benchmark on the Jensen measure alone, and there is a general agreement that SRI and ESG funds either slightly outperform or slightly underperform their benchmarks on all three performance criteria. The majority of the funds, when compared to the market (benchmark portfolio), tend to perform about the same as the market or slightly better.
It can be seen that ESG funds do a little better than the market. Seven ESG funds have a higher Treynor ratio than the market, and seven ESG funds have a higher Sharpe ratio than the market. Some trusts do better than the market in both ways, while others only do better in one. When it came to ESG funds, 7 trusts did slightly better than the market on one or both of the criteria. This shows that the funds tend to do as well as or better than the market.
The NIFTY 50 benchmark was used as a stand-in for the market in this study. Investors use broad indexes like the NIFTY 50 as benchmarks to figure out not only how well the markets are doing, but also how well they are doing as investors. Investors can use these benchmarks to figure out "where the market is" at a certain time. Most investors think that, over time, they will be able to match or beat the returns of these indexes.
Based on the performance measures used in this study, ESG funds did slightly better than the market benchmark (NIFTY 50). This means that investors who buy ESG mutual funds do not have to pay more for their investments. As a result, the study shows that investors don't have to give up money to find a balance between their morals and their financial returns.
Conclusion
In this paper, we evaluate the market performance of ESG funds and compare it to the overall market performance. After comparing the average returns of ESG funds to those of market benchmarks, we found that they perform about the same as the benchmarks. However, the evidence is not strong enough to conclude that these funds consistently beat the market. The Sharpe and Treynor Ratios of ESG funds have been calculated and analysed and compared to the Sharpe and Treynor Ratios of the market to make sure this is the case. In both cases, the ESG funds' returns are comparable to or higher than those of market benchmarks.
Depending on the risk-adjusted metric chosen, ESG Funds typically exhibit similar or slightly better performance than the market. This is especially true when using the Jensen measure. Combining the Jensen, Treynor, and Sharpe performance measures leads to the conclusion that ESG funds in India outperform the market by a small margin but do not command a premium. Therefore, an individual can confidently put their money into ESG funds.
The study finds that the ESG index not only outperforms the traditional equity index in India over time, but also protects against downside risks better, despite the fact that ESG in India is still in its infancy compared to global markets like the European Union (EU), the United States (US), and China. Because the funds considered in this analysis are regular funds, the returns received by investors have been reduced to account for the amounts to be paid back to the fund managers as well as the profit earned by them, which may explain the funds' lukewarm superior performance.
The sample's better performance of ESG funds may have been a temporary phenomenon caused by a rise in interest in ethical and socially responsible investing in the wake of the pandemic's outbreak.
As a result, there was more demand for good investment products, which caused realised rates of return to go up. In fact, as ESG investing becomes more popular, this trend may continue, and companies may try to improve their ESG scores to attract more investors. One limitation worth noting is the difficulty in determining the ESG status of a given fund. It's not easy to tell which investment fund is doing good work for society. However, it is difficult to verify the claims made by the vast majority of funds that they engage in socially responsible investing. It's not clear whether or not the funds' investment strategies take social concerns into account. Therefore, it is difficult to compile a representative sample of ESG funds for purposes of analysis. The lack of ESG and SRI-focused funds is another limitation of the study. ESG investment is still a novel concept in India.
References
Arefeen, S., & Shimada, K. (2020). Performance and resilience of socially responsible investing (SRI) and conventional funds during different shocks in 2016: Evidence from Japan. Sustainability, 12(2), 540.
Indexed at, Google Scholar, Cross Ref
Becchetti, L., Ciciretti, R., Dalò, A., & Herzel, S. (2015). Socially responsible and conventional investment funds: performance comparison and the global financial crisis. Applied Economics, 47(25), 2541-2562.
Indexed at, Google Scholar, Cross Ref
Boitan, I. A. (2020). Sustainable stock market indices: A comparative assessment of performance. Journal of Research in Emerging Markets, 2(1), 7-14.
Indexed at, Google Scholar, Cross Ref
De la Torre, O., Galeana, E., & Aguilasocho, D. (2016). The use of the sustainable investment against the broad market one. A first test in the Mexican stock market. European Research on Management and Business Economics, 22(3), 117-123.
Indexed at, Google Scholar, Cross Ref
Escrig-Olmedo, E., Muñoz-Torres, M. J., & Fernandez-Izquierdo, M. A. (2010). Socially responsible investing: sustainability indices, ESG rating and information provider agencies. International Journal of Sustainable Economy, 2(4), 442-461.
Indexed at, Google Scholar, Cross Ref
Fernandez-Izquierdo, A., & Matallin-Saez, J. C. (2008). Performance of ethical mutual funds in Spain: sacrifice or premium? Journal of Business Ethics, 81(2), 247-260.
Indexed at, Google Scholar, Cross Ref
Galbreath, J. (2013). ESG in focus: The Australian evidence. Journal of Business Ethics, 118(3), 529-541.
Indexed at, Google Scholar, Cross Ref
Giamporcaro, S., & Pretorius, L. (2012). Sustainable and responsible investment (SRI) in South Africa: A limited adoption of environmental criteria. Investment Analysts Journal, 41(75), 1-19.
Indexed at, Google Scholar, Cross Ref
Goldreyer, E.F., Ahmed, P., & Diltz, J.D. (1999). The performance of socially responsible mutual funds: Incorporating sociopolitical information in portfolio selection. Managerial Finance.
Indexed at, Google Scholar, Cross Ref
Hill, R.P., Ainscough, T., Shank, T., & Manullang, D. (2007). Corporate social responsibility and socially responsible investing: A global perspective. Journal of Business Ethics, 70(2), 165-174.
Indexed at, Google Scholar, Cross Ref
Humphrey, J.E., Lee, D.D., & Shen, Y. (2012). Does it cost to be sustainable? Journal of Corporate Finance, 18(3), 626-639.
Indexed at, Google Scholar, Cross Ref
Jain, M., Sharma, G.D., & Srivastava, M. (2019). Can sustainable investment yield better financial returns: A comparative study of ESG indices and MSCI indices. Risks, 7(1), 15.
Indexed at, Google Scholar, Cross Ref
Jones, S., Van der Laan, S., Frost, G., & Loftus, J. (2008). The investment performance of socially responsible investment funds in Australia. Journal of Business Ethics, 80(2), 181-203.
Indexed at, Google Scholar, Cross Ref
Kempf, A., & Osthoff, P. (2007). The effect of socially responsible investing on portfolio performance. European Financial Management, 13(5), 908-922.
Indexed at, Google Scholar, Cross Ref
Lean, H.H., Ang, W.R., & Smyth, R. (2015). Performance and performance persistence of socially responsible investment funds in Europe and North America. The North American Journal of Economics and Finance, 34, 254-266.
Indexed at, Google Scholar, Cross Ref
Mallin, C.A., Saadouni, B., & Briston, R.J. (1995). The financial performance of ethical investment funds. Journal of Business Finance and Accounting, 22, 483-483.
Indexed at, Google Scholar, Cross Ref
Ortas, E., Burritt, R.L., & Moneva, J.M. (2013). Socially Responsible Investment and cleaner production in the Asia Pacific: does it pay to be good? Journal of Cleaner Production, 52, 272-280.
Indexed at, Google Scholar, Cross Ref
Rehman, M.U., Kashif, M., Naifar, N., & Shahzad, S.J.H. (2021). Socially Responsible Funds and Traditional Energy Commodities: A Diversification Perspective for Investments. Frontiers in Environmental Science, 369.
Indexed at, Google Scholar, Cross Ref
Sakuma, K., & Louche, C. (2008). Socially responsible investment in Japan: Its mechanism and drivers. Journal of Business Ethics, 82(2), 425-448.
Indexed at, Google Scholar, Cross Ref
Sánchez, J.L.F., & Sotorrío, L.L. (2009). Performance of European SRI funds vs conventional funds. Working paper, University of Cantabria, Santander.
Schroder, M. (2004). The performance of socially responsible investments: Investment funds and indices. Financial Markets and Portfolio Management, 18(2), 122.
Indexed at, Google Scholar, Cross Ref
Sotorrio, L.L., & Sánchez, J.L.F. (2008). Corporate social responsibility of the most highly reputed European and North American firms. Journal of Business Ethics, 82(2), 379-390.
Indexed at, Google Scholar, Cross Ref
Yue, X.G., Han, Y., Teresiene, D., Merkyte, J., & Liu, W. (2020). Sustainable funds’ performance evaluation. Sustainability, 12(19), 8034.
Indexed at, Google Scholar, Cross Ref
Received: 19-Dec-2022, Manuscript No. AAFSJ-22-13010; Editor assigned: 21-Dec-2022, PreQC No. AAFSJ-22-13010(PQ); Reviewed: 04-Jan-2023, QC No. AAFSJ-22-13010; Revised: 13-Jan-2023, Manuscript No. AAFSJ-22-13010(R); Published: 21-Jan-2023