Research Article: 2022 Vol: 26 Issue: 3
Spillover Effect among Carry Trade, Equity and Commodity in Indian Market Using Var Bekk Garch
Jyoti Ranjana, Uttam Institute of Management Studies
Citation Information: Ranjana, J. (2022). Spillover- effect among carry trade, equity and commodity in indian market using var- bekk garch. Academy of Accounting and Financial Studies Journal, 26(3), 1-20.
Abstract
Carry trade with respect to Indian Rupees has been studied. Currencies included in the study are united state dollar, Great Britain Pound, Euro, Japanese Yen, Australian Dollar, Singaporean Dollar, New Zealand Dollar, Brazilian Real, Russian Rouble, Chinese Yuan and Hong Kong Dollar. The carry trade returns are stationary. Relationship of carry trade return with equity return, bond returns and commodity return has been carried out using Vector auto regression method. Equity has effect on carry trade return. The granger causality test is conducted to study the impact of bond returns, equity returns and commodity returns on carry trade. Spillover effect of carry trade returns of eleven currencies with that of equity and commodity, that is gold, has been studied. I have used Var – Bekk Garch approach to measure the spillover effect. Bekk method has the advantage of reduced parameter, but the disadvantage is that relationship of maximum three variables can be studied. Result suggests that the equity volatility have negative relationship with carry trade volatility and also gold volatility have negative relation with carry trade volatility.
Keywords
Carry Trade, Indian Rupees, Var, Relationship of Carry Trade, Characteristics of Carry Trade, Bekk-Garch.
Introduction
Carry trade is a strategy in financial markets in which traders borrow currency with low interest rate over short maturities and sell proceeds to buy currency with high interest rate. This currency with high interest rates is then lent over the same time period, leading to profits. The borrowed currency with low interest rate is called funding currency while currency with high interest rate is called target currency or investment currency. Given that Japanese Yen has historically yielded the lowest interest rate in the world, it has been widely accepted as funding currency. On the other hand, New Zealand and Australian dollars have recorded rising interest rates, and hence have been largely recognised as investment currencies within the carry trade strategies. But, there is a large empirical evidence to prove that carry trade is profitably undertaken using many other currencies. In practice, however one can adopt the carry trade for individual currency or for portfolios of currencies.
Normally, as per no arbitrage argument of Covered/Uncovered Interest Rate Parity Theory, this trade should give no return due to appreciation of low yield currency and/or proportional depreciation of the high yield currency (Brunnermeier et al., 2008). This theory is one of the main building blocks of international finance. However, in many empirical studies (Menkhoff et al., 2012) as well as practitioners’ experience, this theory is found to be violated. High yield currency appreciates against low yield currency, eventually resulting in gain in trade. This trade has been profitably conducted in spite of having no proper economic explanation, and hence is termed as the Forward Premium Puzzle.
Recently, profit from carry trade has dipped, as interest rates of all major currencies are near zero (Hördahl et al., 2016). Besides, interest rates of traditional target currencies are near two to three percent (Australia and New Zealand) which may introduce the risk in profit.
Exchange rate volatility may erode the profit in the carry trade. Simultaneously however, opportunities for carry trades are rising in emerging markets. With rising interest rate in emerging markets like India, China, Russia and Brazil, it becomes imperative to study carry trade with respect to developing nation. Hence, this study addresses the issue of short run profitability of carry trade returns using Indian Rupee as base currency. Carry trade can be undertaken with both spot exchange rate and exchange rate futures; we note that risk in carry trade using exchange rate future is less in comparison to carry trade using spot exchange rates. When carry trade is undertaken using exchange rate futures, all positions are taken at the time of entering into carry trade, so uncertainties corresponding to spot exchange rate do not exist. This study documents that carry trade returns using exchange rate futures have lesser risk, but higher skewness and kurtosis than carry trade returns using spot exchange rates.
Further, study has tried to find relationship of carry trade return with bonds, commodity and equity. These asset classes are governed by common macroeconomic factors. Commodity returns and stock returns have information concerning economic fundamentals that have effect on high interest rate and low interest rate currencies (Bakshi & Panayotov, 2013). So, carry trade might have some relationship with them. So, this study attempts to uncover relations with returns from other asset classes like equity, bond and commodities (crude and gold). Only two commodities have been employed in this study – crude oil and gold. This is because they constitute highest and second highest imports (in value) of India.
We find that equity has statistically significant relationship with carry trade in seven of eleven currencies considered in this study. Bond returns are statistically insignificant in most of the cases. Relationship with returns of commodity is mixed. The rest of the paper has been written as follows. Section 2 contains literature review. Section 3 has methods. Section 4 has data and section 5 has result and discussion followed by section 6 conclusion.
Literature Review
Previous researchers have examined whether carry trade returns co-vary with returns of other asset classes, stocks, bonds and commodities. Christiansen et al. (2011) shows that the return on carry trades is positively correlated with return on stocks whereas they are slightly negatively correlated with return on bonds. Further, the extent of correlation depends on the level of foreign exchange volatility and liquidity. When the foreign exchange volatility is high, the correlation between carry trade returns and stock market is high. Tse & Zhao (2011) find no lead-lag relationship between carry trade returns and equity returns and report that neither can predict the other. Cheung et al. (2005) have shown that carry trade affects stock markets in target countries. Carry trade effects stock market of target currencies’ countries. The rapidity and sluggishness in carry trade direct stock markets in target currency countries (Dobrynskaya, 2014).
Lee & Chang (2013) shows a positive relationship between market returns and currency carry trade returns. Lu & Jacobsen (2016) employ lead-lag regressions to show that equity returns forecast short leg profit returns, that is, returns from shorting low-yielding currencies. This effect tends to be lower if equity indices drop and higher if equity indices increase over the preceding three months. They also show that commodity returns predict long leg profits, that is, returns from buying high yield currencies. However, it has been found that the equity effect is faster than the commodity effect. The effect from stocks on the short leg carry trade is most prominent after two months whereas the effect from commodities to long leg carry trade occur after three months. Innovations to equity and commodity returns are positively correlated to innovations in high interest rate currencies (VAR innovation), but negatively correlated to innovations in low interest rate currencies.
So, there is no consensus on relationship of carry trade with other asset classes. It has been seen that there is inconclusive relation between carry trade return and equity market. No firm connection has been found between carry trade return and returns from bond and commodity markets as well.
Method
Measurement of carry trade returns
In extant literature Burnside Menkhoff et al. (2012), carry trade return is calculated as:
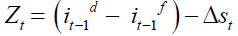
Here Zt is carry trade return at time t,
it-1d is the logarithm of domestic interest rate at time t-1
it-1f is logarithm of foreign interest rate at time t-1
st =log(nominal exchange rate)
Exchange rate is taken in terms of foreign currency against every Indian Rupee.
However, in this paper, we have embraced a different approach Jurek (2014) to calculate the profits from carry trade. Assume that at time t-1, foreign interest rate is less than domestic interest rate  a trader will adopt a strategy to borrow x units of foreign currency on a continuously compounded interest rate of
  and he will sell it at spot exchange rates of
  to get
  units of domestic currency, and will invest domestically at a continuously compounded interest rate,
  On time t, he will return
  units of foreign currency, where δt is the difference between times (t-1) and t. In terms of domestic currency, it will be
 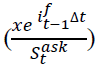 units. From this strategy, he would get
 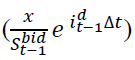 units of domestic currency. If the Uncovered Interest Rate Parity Theory holds, the amounts received in this transaction should be equal to the amount to be paid. That is,
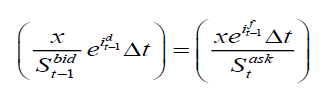
Taking natural logarithms of ratio of both terms, we obtain:
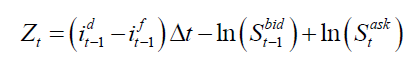
The profits from carry trade will be as follows:
When 
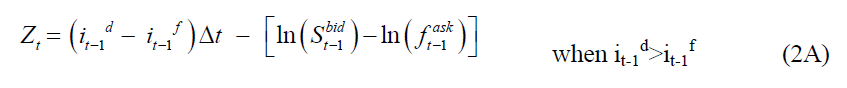
If foreign interest rates are more than domestic interest rates 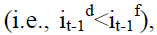 a trader will undertake the transactions in opposite direction, and then, the gains from carry trade are as follows:
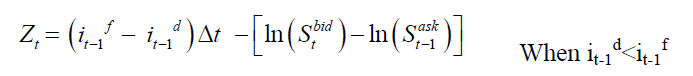
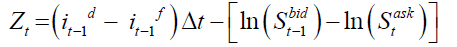
Combining the above two equations, we get the carry trade gains as (Jurek, 2014):

In this paper, we use Eqn (2) to calculate carry trade gains, instead of the more commonly used Eqn (1).
Returns of carry trade using the future exchange rate is given as following:

Here Zt is carry trade return at time t,
it-1d is the domestic interest rate at time t-1
it-1f is the foreign interest rate at time t-1
st =log(nominal spot exchange rate)
ft =log(nominal futures exchange rate)
Superscripts ask and bid denote ask and bid quotes of the spot and futures exchange rates. Exchange rates are defined in terms of foreign currency against Indian Rupee. Econometric approaches:
Firstly, we have applied Augmented Dicker-Fuller test to verify the stationarity of each of the time series variables. The equation which governs the ADF test is given as follows:

Here α is a constant, β the coefficient on a time trend and p the lag order of the autoregressive process. In the above equation, coefficient Δ is set equal to zero under the null hypothesis that the system has a unit root. In the presence of intercept and trend, a Δt statistic is calculated, which is compared with the critical value of the Augmented Dickey Fuller statistic to make inferences of stationarity of the series.
VAR Model
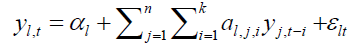
If all variables of interest are stationary then vector auto-regression (VAR) model is applied. In VAR model, regression analysis is done on the lags of endogenous variables. The VAR model can be written as:
Here
yl,t are endogenous I(0) variables,  is white noise and
  and α l are parameters to be determined. The optimal number of lags to be used in the VAR model, is estimated using Schwartz Information Criteria (SIC).
Here, I use tri-variate BEKK GARCH model to calculate conditional means of carry trade, equity and gold.
Let x, y, z denotes the carry trade returns, equity returns and gold returns respectively, and define residual vector εt as (εxt, εyt, εzt)’. Regarding εt, I assume that it is conditionally normal with mean zero and covariance matrix  That is
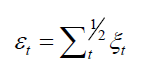
 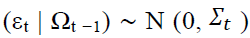 where Ωt −1 is the information set up to time t −1. The process obeys a multivariate GARCH process if εt can be represented as:
Conditional covariance matrix  is given by E
 has elements
  with
with  denoting conditional variances and off-diagonal elements
  denoting conditional covariance ( I, j =1,…N), dependencies of the second order moments in
  on
on  become computationally irrelevant for all practical purposes. Vech representation for
  is given by (Bollerslev et al., 1988):
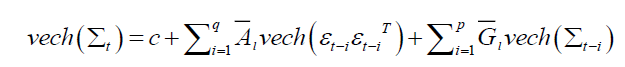
Where  and
and  are matrices containing
  elements and deterministic covariance components are collected in c This model is cumbersome as there are large number of elements in matrices. So, Baba gave the model which was more compact model as:

Where  and
and  are N-by-N matrices and
  is upper triangular matrix.This model preserves the positive definitiveness of
  This gives
  where i and j = x, y, z.
Data
In this study, I have selected currencies from both developed and emerging economies. Accordingly, currencies from developed nations are from Australia (AUD), United States of America (USD), Japan (Yen), United Kingdom (GBP), Europe (Euro), and New Zealand (NZD) and currencies from developing economies are Brazil (BRL), China (CNY), Russia (RBL), Hong Kong (HKD), and Singapore (SGD). Then the carry trade gains from each of these currencies vis-à-vis Indian Rupees (INR) are calculated. However, in case of exchange rate futures for carry trade return, only four currencies: USD, EURO, GBP and Japanese Yen have been studied due to lack of data for other currencies. Both far month future and near month future have been considered (Buncic & Tischhauser, 2017).
I got spot exchange rates for each of mentioned currencies against INR and three month interest rates for all countries including India from Bloomberg Database. Crude oil price and gold price have been downloaded from Multi-Commodity Exchange (MCX) of India. From the Clearing Corporation of India Ltd. (CCIL), daily prices of bond index have been taken (Liu et al., 2012). Finally, daily levels of Nifty 50, a free-float, market capitalisation based stock index have been downloaded from National Stock Exchange of India. For each of these series, daily data from April 1, 2006 to December 31, 2019 have been considered in this study (Atanasov & Nitschka, 2014).
The period of study of futures extends from January 2010 to December 2019. Using the above data, we calculate daily carry trade returns based on Eqn (2) and (2A). Prices of Nifty 50, bond index, gold and crude oil were converted to logarithmic returns. Descriptive statistics of all these series are given in Table 1A to 1C.
| Table 1A Descriptive Statistics of Carry Trade Returns Along With Jaque Bera Probability | |||||||||||
| Panel A: carry trade returns using spot exchange rate | |||||||||||
| USD | GBP | EURO | JPY | AUD | NZD | CNY | RUB | BRL | SGD | HKD | |
| average | 0.005 | 0.010 | 0.008 | 0.005 | 0.004 | -0.004 | -0.008 | -0.013 | 0.006 | 0.003 | 0.005 |
| std deviation | 0.045 | 0.053 | 0.054 | 0.075 | 0.059 | 0.059 | 0.049 | 0.1 | 0.071 | 0.037 | 0.045 |
| skewness | -0.861 | -0.116 | 0.089 | -0.650 | 0.567 | -0.126 | -0.706 | -1.025 | -0.802 | -0.286 | -0.865 |
| Excess kurtosis | 0.971 | 0.546 | 0.422 | 1.016 | 1.652 | 0.036 | 0.523 | 5.11 | 1.564 | 0.476 | 1.058 |
| observation | 2244 | 2144 | 2145 | 1811 | 2424 | 1246 | 2052 | 2023 | 2230 | 2191 | 2142 |
| JB probability | 662.1 | 542.9 | 596.7 | 424.5 | 313.4 | 459.5 | 694.8 | 728.22 | 431.3 | 611.4 | 603.5 |
| p value | 0.00 | 0.00 | 0.00 | 0.00 | 0.00 | 0.00 | 0.00 | 0.00 | 0.00 | 0.00 | 0.00 |
|
Table 1B Panel B: Returns Fronm Carry Trade Using Exchange Rate Futures |
||||||||
| USDf | EURf | GBPf | JPYf | USDn | EURn | GBPn | JPYn | |
| average | 0.04 | 0.017 | -0.00135 | 0.013 | 0.0183 | 0.0186 | -0.195 | 0.0186 |
| std deviation | 0.006 | 0.008 | 0.008 | 0.008 | 0.003 | 0.005 | 0.065 | 0.005 |
| skewness | 1.233 | -0.810 | -0.691 | -0.691 | 0.398 | 0.009 | 0.671 | 0.16 |
| Excess kurtosis | 2.36 | 2.45 | 1.180 | 1.180 | 3.142 | 4.127 | -0.458 | 1.472 |
| observation | 103 | 1000 | 1026 | 1026 | 898 | 1062 | 1024 | 1011 |
| JB Probability | 27.88 | 122.12 | 223.1 | 223.1 | 24.5 | 56.1 | 587.0 | 6.7 |
| p value | 0.00 | 0.00 | 0.00 | 0.00 | 0.00 | 0.00 | 0.00 | 0.00 |
| Table 1C Panel C: Returns From Other Asset Classes | ||||
| BOND | CRUDE | GOLD | Equity | |
| average | 0.000 | 0.000 | 0.000 | 0.000 |
| std deviation | 0.003 | 0.018 | 0.009 | 0.015 |
| skewness | -1.794 | 0.720 | 0.109 | 0.045 |
| Excess kurtosis | 56.191 | 8.419 | 5.772 | 10.072 |
| observation | 2346 | 791 | 2290 | 2346 |
| JB probability | 180342.2 | 1036.19 | 737.7773 | 4890.482 |
| p value | 1.00 | 1.00 | 0.00 | 1.00 |
NOTE: Simply currency name indicate three months carry trade return using spot exchange rates. Currency name with subscript f indicates carry trade return over three months using far month exchange rate future and currency name followed by subscript n indicated carry trade return using near month exchange rates futures.
From Table 1A to 1C it can be concluded that all carry trades have positive average return except NZD, CNY, RUB, far and near month GBP return. Return from GBP is highest in three month spot exchange rate. Overall I observe that the returns from developed countries currencies are more than returns from emerging markets currencies. Further comparing the returns from spot exchange rate and exchange rate futures, it is observed that returns corresponding to former are greater than returns from latter. Again from Table 1, from the returns of future carry trade and spot trade, it can be shown that the return of future trade is greater than carry trade using spot exchange. Comparing panel A and panel B, the returns using three month exchange rate future is more than that of one month exchange rate futures. It can be observed from panel A and B that the standard deviation of future carry trade is less than that of carry trade using spot rates. Thus, we infer that the future carry trade is less risky than spot carry trade, carry trade returns from exchange rate futures are more than carry trade from spot rate futures. Return from USD in three months future is greater than return from any other currencies. Three month exchange rate future in USD is the best strategy for carry trade in given condition. Kurtosis for carry trade return using exchange rate future has higher kurtosis than carry trade return using spot exchange rate. The skewness is negative for carry trade return using spot exchange whereas for carry trade return using exchange rate future, skewness is mixed. For the second stage calculation, bond and crude oil have been dropped as there was found to be not significant relationship with carry trade.
Results and Discussion
All carry trade returns are stationary at significance level of 1% (from Table 2A to 2C). Gold price, crude price bond price and stock index (equity) are all stationary. So, Vector Auto Regression model can be established between carry trade returns and returns of equity (stock index), bond, and commodities’ return (gold or crude).
| Table 2A Results of Adf Test on Carry Trade, Equity, Bond and Commodity Returns | |||||||||||
| PANEL A | |||||||||||
| USD | AUD | EUR | JPY | BRL | GBP | RUB | NZD | HKD | SGD | CNY | |
| T value | -4.16 | -6.46 | -4.36 | -3.93 | -3.75 | -3.37 | -4.22 | -4.82 | -4.56 | -3.25 | -3.60 |
| Prob. | 0.00 | 0.00 | 0.000 | 0.00 | 0.00 | 0.01 | 0.00 | 0.000 | 0.008 | 0.02 | 0.01 |
| Table 2B PANEL B | ||||||||
| USDf | EUROf | GBPf | JPYf | USDn | EUROn | GBPn | JPYn | |
| T value | -9.377 | -23.95 | -5.55 | -7.35 | -22.93 | -27.61 | -2.65 | -23.47 |
| Prob. | 0 | 0 | 0 | 0 | 0 | 0 | 0 | 0 |
| Table 2C PANEL C | ||||
| Equity | Bond | Crude | Gold | |
| T alue | -46.95 | -55.61 | -32.15 | -35.55 |
| Prob. | 0.0001 | 0.0001 | 0 | 0.0000 |
NOTE: Simply currency name indicate three months carry trade return using spot exchange rates. Currency name with subscript f indicates carry trade return over three months using far month exchange rate future and currency name followed by subscript n indicated carry trade return using near month exchange rates futures.
Abstract of VAR result have been shown in Table 3 and 4. Table 3 contains abstract which are corresponding to commodity Gold and Table 4 corresponds to commodity Crude oil (Lettau et al., 2014). The optimal number of lags has been shown in Table 3 and Table 4.
| Table 3 Abstract of Var Result | |||||
| Lags | Lagged Currency | Equity | Bonds | Gold | |
| USD | 1 | +ve Sig. | +ve Sig. | InSig. | InSig. |
| GBP | 1 | +ve Sig. | +ve Sig. | InSig. | -veSig. |
| EUR | 1 | +ve Sig. | +ve Sig. | InSig. | -ve Sig. |
| JPY | 1 | +ve Sig. | +ve Sig. | InSig. | -ve Sig. |
| AUD | 2 | +ve Sig. | InSig. | InSig. | InSig. |
| NZD | 1 | +ve Sig. | InSig. | +ve Sig. | +ve Sig. |
| CNY | 1 | +ve Sig. | +ve Sig. | -ve Sig. | InSig. |
| RUB | 1 | +ve Sig. | InSig. | InSig. | -ve Sig. |
| BRL | 1 | +ve Sig. | InSig. | InSig. | InSig. |
| HKD | 1 | +ve Sig. | +ve Sig. | InSig. | InSig. |
| SGD | 1 | +ve Sig. | +ve Sig. | InSig. | -ve Sig. |
| USDf | 1 | +ve Sig. | Insig. | InSig. | InSig. |
| EUROf | 2 | Insig. | -ve Sig. | InSig. | InSig. |
| GBPf | 2 | +ve Sig. | InSig. | InSig. | InSig. |
| JPYf | 2 | +ve Sig. | InSig. | -ve Sig. | +ve Sig. |
| USDn | 2 | +ve Sig. | InSig. | InSig. | InSig. |
| EUROn | 2 | +ve Sig. | InSig. | InSig. | InSig. |
| GBPn | 2 | +ve Sig. | InSig. | InSig. | InSig. |
| JPYn | 2 | +ve Sig. | InSig. | InSig. | +ve Sig. |
| Table 4 Abstract of Var Result Due to Crude | |||||
|
|
Lags
|
Lagged Currency
|
Equity
|
Bonds
|
Crude
|
| USD
|
1
|
+ve
|
InSig.
|
InSig.
|
Ins.
|
| GBP
|
1
|
+ve
|
+ve Sig.
|
InSig.
|
-ve sig.
|
| EUR
|
1
|
+ve
|
+ve Sig.
|
InSig.
|
-ve sig.
|
| JPY
|
1
|
+ve
|
+ve Sig.
|
InSig.
|
In Sig.
|
| AUD
|
1
|
+ve
|
+ve Sig.
|
InSig.
|
In Sig.
|
| NZD
|
1
|
+ve
|
InSig.
|
InSig.
|
In Sig.
|
| CNY
|
1
|
+ve
|
InSig.
|
In Sig.
|
In Sig.
|
| RUB
|
1
|
+ve
|
InSig.
|
InSig.
|
In Sig.
|
| BRL
|
1
|
+ve
|
InSig.
|
InSig.
|
In Sig.
|
| HKD
|
1
|
+ve
|
+ve Sig.
|
InSig.
|
-ve sig.
|
| SGD
|
1
|
+ve
|
InSig.
|
InSig.
|
In Sig.
|
| USDf
|
1
|
+ve
|
InSig.
|
InSig.
|
InSig.
|
| EUROf
|
2
|
+ve
|
InSig.
|
-ve Sig.
|
+veSig.
|
| GBPf
|
2
|
+ve
|
InSig.
|
InSig.
|
InSig.
|
| JPYf
|
2
|
-ve
|
+ve
|
InSig.
|
+veSig.
|
| USDn
|
2
|
+ve
|
InSig.
|
InSig.
|
InSig.
|
| EUROn
|
2
|
+ve
|
InSig.
|
InSig.
|
InSig.
|
| GBPn
|
2
|
+ve
|
InSig.
|
InSig.
|
InSig.
|
| JPYn
|
2
|
+veSig.
|
InSig.
|
-ve sig.
|
InSig.
|
NOTE: Simply currency name indicate three months carry trade return using spot exchange rates. Currency name with subscript f indicates carry trade return over three months using far month exchange rate future and currency name followed by subscript n indicated carry trade return using near month exchange rates futures. InSig means that T-statistics is between 2 and -2, +ve Sig. means that T- statistics is more than 2 and -ve Sig means that t-statistics is less than -2.
InSig means that T-statistics is between 2 and -2, +ve Sig. means that T- Statistics is more than 2 and -ve Sig means that t-statistics is less than -2.
NOTE: Simply currency name indicate three months carry trade return using spot exchange rates. Currency name with subscript f indicates carry trade return over three months using far month exchange rate future and currency name followed by subscript n indicated carry trade return using near month exchange rates futures. InSig means that T-statistics is between 2 and -2, +ve Sig. means that T- statistics is more than 2 and -ve Sig means that t-statistics is less than -2.
VAR result is given in Tables 1 to 19 in appendix.
Equity positively affects the carry trade in case of developed countries. In case of carry trade using spot exchange, there are seven positive significance cases out of eleven cases. This result is in congruence with those of (Christiansen et al., 2011 & Lee & Chang, 2013). Gold is negatively significant in case of EURO, GBP, JPY, RUB and SGD and positively significant in NZD and in the rest it is insignificant. Campbell et al. (2010) and Bakshi & Panayotov (2013) have also shown the effect of commodity on the carry trade. This shows that gold negatively influences the carry trade for developed nations. As from Table 3(i.e. in case of gold), bond in carry trade of NZD is positively significant and in case of CNY, it is negatively significant. And in all other cases, bond is insignificant. Christiansen et al. (2011) and Lee & Chang (2013) report small negative relationship between bond and carry trade. From Table 4 (i.e. in case of crude), it can be inferred that there has been not much significance of Indian sovereign bond on carry trade. Since sovereign bonds and gold are considered to be hedge Baur & Lucey (2010), thus they have negative or insignificant relationship with carry trade. Crude price and exchange rate are inversely related in Indian case, thus carry trade has also negative or insignificant relationship with crude.
For carry trade return using exchange rate future does not have significant relationship with any of the asset that is bond, equity and commodity. Gold has positive significance in case of Japanese Yen for both 1 month and three month return. Crude has positive significance to the three months return for Japanese Yen and EURO. Carry trade has positive effects on the respective carry trade Table 5A to 5C.
| Table 5A The Values of From Bekk Garch Model PANEL A | |||||||
| EURO | BRL | AUD | CNY | ||||
| COEFF | t- VALUE | COEFF | t- VALUE | COEFF | t- VALUE | COEFF | t- VALUE |
| 0.137249 | 1.772502 | 0.946445 | 94.99185 | 0.508735 | 47.83806 | 0.555203 | 22.50664 |
| -0.00038 | -5.60965 | -1.2E-05 | -0.16812 | -0.102 | -2942.65 | -0.22999 | -728.575 |
| 6.12E-05 | 1.131559 | -0.11628 | -2544.9 | -0.25181 | -1001.37 | ||
| 1.941994 | 0.344594 | 0.821799 | 1.875764 | 0.683981 | 3.5494 | ||
| -0.67605 | -27.6472 | -0.23941 | -5.04168 | -0.2548 | -92.378 | ||
| -6.74382 | -1.21121 | 1.076454 | 8.602372 | 0.664928 | 4.63961 | ||
| -0.001 | -0.04331 | 0.143224 | 3.874326 | -0.31077 | -149.794 | ||
| Table 5B PANEL B | |||||||
| JPY | GBP | HKD | NZD | ||||
| COEFF | t- VALUE | COEFF | t- VALUE | COEFF | t- VALUE | COEFF | t- VALUE |
| 0.020519 | 0.687883 | 0.686013 | 265.1902 | 0.862737 | 14.62848 | 0.354756 | 37.86335 |
| -0.00221 | -144.494 | -0.36658 | -41500.8 | -0.06693 | -160.77 | -0.00133 | -5.10947 |
| 4.02E-05 | 1.95275 | -0.39269 | -27493.2 | -0.11497 | -483.299 | -0.00064 | -2.31178 |
| 0.659866 | 0.04256 | 1.557326 | 3.866607 | 1.556084 | 1.472187 | 0.526577 | 2.090038 |
| 0.133577 | 2.878826 | -0.69978 | -5.51488 | -0.31428 | -2.07894 | -0.02996 | -0.17312 |
| -0.63298 | -0.11526 | 1.635363 | 3.586846 | 1.586828 | 1.216291 | 0.52645 | 2.194999 |
| 0.014453 | 0.407977 | -0.63743 | -3.60954 | -0.35628 | -1.98627 | -0.03006 | -0.21641 |
| Table 5C PANEL C | |||||
| RUB | SGD | USD | |||
| COEFF | t- VALUE | COEFF | t- VALUE | COEFF | t- VALUE |
| 0.636684 | 16.46218 | -0.53058 | -13.7189 | 0.377819 | 36.55701 |
| 0.01018 | 522.5109 | -0.00126 | -64.6687 | 0.041737 | 407.4708 |
| 0.008873 | 381.9042 | -3.9E-05 | -1.69089 | 0.06964 | 119.0065 |
| 0.200812 | 0.01545 | -5.86447 | -0.45118 | 0.774459 | 0.151082 |
| 0.005444 | 0.0941 | 0.650445 | 11.24298 | -0.13845 | -4.51867 |
| 0.182695 | 0.012548 | -8.41651 | -0.57807 | 0.870851 | 0.310101 |
| 0.4837 | 3.999362 | -0.06944 | -0.57414 | 0.256088 | 8.160702 |
From Panel A of Table 5, results suggest that volatility of carry trade with EURO is negatively affected by the volatility of gold and equity. Volatility of equity is insignificantly affected by volatility of EURO carry trade return and that of carry trade insignificantly affects the volatility of gold. Volatility of carry trade with BRL is insignificantly affected by the volatility of gold and insignificantly affected by equity volatility. Volatility of equity affects the volatility of BRL insignificantly. In case of BRL carry trade return insignificantly affects the volatility of gold. In case of AUD, carry trade returns is negatively affected by those of equity and gold. While carry trade insignificantly affects the equity and that positively affects the gold. The carry trade returns of CNY are negatively affected by volatility of equity and gold. Whereas the carry trade volatility positively affects the equity’s and gold’s volatility.
From Panel B of Table 5, carry trade volatility of JPY are negatively affected by equity volatility and insignificantly affected by gold volatility. Carry trade volatility insignificantly affects the equity volatility and gold volatility. Carry trade returns’ volatility of GBP are negatively affected by equity volatility and gold volatility also negatively affects the carry trade’s volatility. Volatility of carry trade returns of GBP positively affects the volatility of equity as well as the volatility of gold. Volatility of carry trade return of HKD is negatively affected by equity volatility and negatively affected by gold volatility. In case of HKD, the carry trade volatility insignificantly affects the volatility of equity and volatility of gold. In case of NZD, the carry trade volatility is negatively affected by volatilities of equity and gold whereas there is insignificant relationship between carry trade volatility and volatility of equity and gold (Jylhä & Suominen, 2011).
In Panel C of Table 5, there are three carry trades analysed. It is found that volatility of RUB are positively impacted by volatilities of equity and gold. Whereas the volatilities of equity and gold are insignificantly affected by volatility of RUB carry trade. Volatility of carry trade with SGD is negatively affected by the volatility of equity. And volatility of gold insignificantly affect the carry trade volatility. Volatility of carry trade with SGD insignificantly affects the volatility of equity and they insignificantly affect the volatility of gold. The carry trade volatility of USD get positively affected by the volatility of equity and positively affected by volatility of gold. The carry trade volatility insignificantly affects the volatility of equity and those of gold.
Thus volatility of equity negatively affect the volatility of carry trade in cases of EURO, AUD, CNY, JPY, GBP, HKD, NZD and SGD. Volatility of equity positively affect the volatility of carry trade in cases of RUB and USD. Volatility of gold negatively affects the volatility of carry trade in case of EURO, AUD, CNY, GBP, HKD, and NZD. Volatility of gold positively affect the volatility of carry trade in case of RUB and USD. Volatility of carry trade affects the volatility of equity positively in case of CNY, GBP, NZD. Carry trade volatility positively affects the volatility of gold in case of AUD, CNY, GBP and NZD.
Conclusion
Carry trade with Indian Rupees are profitable with most of the countries studied. The relationship between equity returns and carry trade are significantly affected by equity returns at least for developed currencies(USD, GBP, EURO and JPY). For emerging market this relationship is not statistically significant except for SGD, CNY and HKD. Equity has role to play in carry trade with developed nation. Bond has no significant relationship with carry trade and commodity has mixed effect on carry trade.
I have taken carry trade returns of eleven countries, returns of equity and gold. Here, I have employed VAR –BEKK model to find the relationship between the volatility of carry trade returns, gold and equity. Results suggest that in eight out of eleven cases considered, the equity volatility has negative relationship with carry trade volatility. In two cases the equity volatility has positive relationship with the volatility of carry trade and specifically those are RUB and USD. In six out of eleven cases the gold volatility has negative relationship with carry trade volatility. And, with two types of carry trade, the gold volatility has positive relationship (that is RUB and USD). Carry trade volatility has positive relationship with equity volatility in three cases while all other has insignificant relationship. And carry trade volatility has positive relation with gold volatility in four cases.
Thus it can be concluded that the equity volatility has negative relationship with carry trade volatility and gold volatility has negative relationship with carry trade volatility. Hence, it can be said that the carry trade with emerging markets are negatively affected by equity volatility and negatively affected by gold volatility.
Appendix
| Table Panel 1A VAR estimates of returns from various currency carry trades, equity, bond and commodities EQt = Equity at time t, Bt = bond at time t, Gt = Gold at time t and Ct = crude at time t, Row with symbols are coefficient and next row is the T-statistics | |||||||||
| VAR estimates of returns from AUD carry trade, equity, bond, and commodity(Gold), optimal lag =2 | |||||||||
| AUDt-1 | AUDt-2 | EQt-1 | EQt-2 | Bt-1 | Bt-2 | Gt-1 | Gt-2 | C | |
| AUDt | 0.58 | 0.33 | -0.02 | -0.12 | 0.17 | 0.02 | -0.12 | 0.08 | 0.00 |
| 27.93 | 15.98 | -0.46 | -3.19 | 0.86 | 0.11 | -1.66 | 1.19 | 0.85 | |
| EQt | 0.03 | -0.05 | 0.05 | -0.02 | 0.17 | -0.14 | 0.00 | 0.06 | 0.00 |
| 2.52 | -4.08 | 2.27 | -0.67 | 1.49 | -1.26 | -0.02 | 1.43 | 0.87 | |
| Bt | 0.01 | 0.00 | 0.03 | 0.00 | 0.13 | -0.05 | -0.02 | -0.02 | 0.00 |
| 2.23 | -1.34 | 6.82 | -0.88 | 5.45 | -2.25 | -2.27 | -2.11 | 2.99 | |
| Gt | 0.01 | 0.00 | -0.01 | 0.01 | 0.03 | -0.10 | 0.25 | -0.11 | 0.00 |
| 0.77 | -0.70 | -1.10 | 0.59 | 0.40 | -1.64 | 11.07 | -4.86 | 1.94 | |
| Table Panel 1B VAR estimates of returns from AUD carry trade, equity, bond, and commodity(Crude), optimal lag =1 | |||||
| AUDt-1 | EQt-1 | Bt-1 | Ct-1 | C | |
| AUDt | 0.88 | 0.16 | -0.20 | 0.03 | 0.00 |
| 43.85 | 2.04 | -0.88 | 0.57 | 2.07 | |
| EQt | 0.00 | 0.04 | 0.28 | -0.04 | 0.00 |
| -0.22 | 0.82 | 2.16 | -1.33 | 1.49 | |
| Bt | 0.00 | 0.04 | 0.08 | -0.01 | 0.00 |
| -1.00 | 2.42 | 1.84 | -0.93 | 2.00 | |
| Gt | 0.01 | -0.02 | -0.08 | -0.01 | 0.00 |
| 0.75 | -0.35 | -0.41 | -0.13 | -0.88 | |
| Table Panel 2A VAR estimates of returns from BRL carry trade, equity, bond, and commodity(Gold), optimal lag =1 | |||||
| BRLt-1 | EQt-1 | Bt-1 | Gt-1 | C | |
| BRLt | 0.97 | 0.00 | -0.07 | -0.03 | 0.00 |
| 143.27 | 0.11 | -0.44 | -0.51 | 0.64 | |
| EQt | 0.02 | 0.05 | 0.14 | 0.05 | 0.00 |
| 3.11 | 2.11 | 1.21 | 1.26 | 0.40 | |
| Bt | 0.00 | 0.03 | 0.11 | -0.02 | 0.00 |
| -3.40 | 5.40 | 4.56 | -2.03 | 2.94 | |
| Gt | 0.00 | -0.02 | 0.09 | 0.23 | 0.00 |
|
|
-0.33 | -1.28 | 1.38 | 9.66 | 1.68 |
| Table Panel 2B VAR estimates of returns from BRL carry trade, equity, bond, and commodity(Crude), optimal lag =1 | |||||
| BRLt-1 | EQt-1 | Bt-1 | Ct-1 | C | |
| BRLt | 0.94 | -0.13 | 0.27 | 0.07 | 0.00 |
| 50.97 | -1.86 | 1.30 | 1.70 | -0.03 | |
| EQt | 0.02 | -0.01 | 0.36 | -0.05 | 0.00 |
| 1.76 | -0.31 | 2.66 | -1.87 | 0.86 | |
| Bt | 0.00 | 0.03 | 0.09 | -0.01 | 0.00 |
| -0.17 | 1.96 | 1.92 | -0.99 | 1.70 | |
| Gt | -0.03 | -0.01 | -0.11 | -0.04 | 0.00 |
| -1.50 | -0.08 | -0.52 | -0.84 | -0.07 | |
| Table Panel 3A VAR estimates of returns from CNY carry trade, equity, bond, and commodity(gold), optimal lag =1 | |||||
| CNYt-1 | EQt-1 | Bt-1 | Gt-1 | C | |
| CNYt | 0.99 | 0.15 | -0.12 | -0.02 | 0.00 |
| 283.77 | 13.69 | -2.32 | -0.90 | -0.31 | |
| EQt | 0.00 | 0.07 | 0.03 | 0.04 | 0.00 |
| 0.53 | 2.79 | 0.27 | 0.87 | 0.99 | |
| Bt | 0.00 | 0.02 | 0.12 | -0.02 | 0.00 |
| 0.08 | 4.83 | 5.00 | -2.72 | 2.59 | |
| Gt | 0.00 | -0.03 | 0.11 | 0.22 | 0.00 |
| 0.25 | -2.05 | 1.69 | 9.62 | 1.89 | |
| Table Panel 3B VAR estimates of returns from CNY carry trade, equity, bond, and commodity(crude), optimal lag =1 |
|||||
| CNYt-1 | EQt-1 | Bt-1 | Ct-1 | C | |
| CNYt | 1.00 | 0.26 | 1.35 | 0.11 | 0.00 |
| 122.29 | 0.36 | 0.73 | 0.19 | -0.08 | |
| EQt | 0.00 | 0.07 | 0.20 | 0.02 | 0.00 |
| -0.50 | 1.26 | 1.49 | 0.53 | 0.60 | |
| Bt | 0.00 | 0.03 | 0.08 | -0.01 | 0.00 |
| 0.10 | 1.65 | 1.58 | -0.86 | 0.18 | |
| Ct | 0.00 | 0.04 | 0.03 | 0.14 | 0.00 |
| -0.05 | 0.64 | 0.24 | 3.20 | 0.11 | |
| Table Panel 4A VAR estimates of returns from EURO carry trade, equity, bond, and commodity(gold), optimal lag =1 | |||||
| EURt-1 | EQt-1 | Bt-1 | Gt-1 | C | |
| EURt | 0.98 | 0.12 | -0.03 | -0.20 | 0.00 |
| 216.44 | 7.33 | -0.43 | -7.09 | 1.14 | |
| EQt | -0.01 | 0.07 | 0.12 | 0.05 | 0.00 |
| -1.80 | 2.85 | 1.02 | 1.27 | 0.97 | |
| Bt | 0.00 | 0.02 | 0.11 | -0.02 | 0.00 |
| 1.81 | 4.93 | 4.75 | -1.76 | 2.50 | |
| Gt | 0.00 | -0.02 | 0.08 | 0.23 | 0.00 |
| 0.35 | -1.70 | 1.30 | 9.41 | 1.26 | |
| Table Panel 4B VAR estimates of returns from EURO carry trade, equity, bond, and commodity(crude), optimal lag =1 | |||||
| EURt-1 | EQt-1 | Bt-1 | Ct-1 | C | |
| EURt | 0.98 | 0.28 | 0.09 | -0.15 | 0.00 |
| 104.49 | 5.82 | 0.68 | -3.70 | -0.05 | |
| EQt | 0.00 | 0.04 | 0.29 | 0.04 | 0.00 |
| -0.36 | 0.85 | 2.09 | 0.88 | 0.21 | |
| Bt | 0.00 | 0.03 | 0.09 | -0.02 | 0.00 |
| 0.24 | 1.48 | 1.71 | -1.12 | 1.45 | |
| Ct | 0.00 | 0.04 | 0.01 | 0.19 | 0.00 |
| -0.08 | 0.69 | 0.07 | 3.95 | -1.05 | |
| Table Panel 5A VAR estimates of returns from GBP carry trade, equity, bond, and commodity(gold), optimal lag =1
|
|||||
| GBPt-1
|
EQt-1
|
Bt-1
|
Gt-1
|
C
|
|
| GBPt
|
0.98
|
0.08
|
0.02
|
-0.13
|
0.00
|
| 199.63
|
4.65
|
0.24
|
-4.58
|
1.15
|
|
| EQt
|
-0.02
|
0.07
|
0.12
|
0.06
|
0.00
|
|
|
-2.32
|
2.84
|
1.08
|
1.36
|
1.15
|
| Bt
|
0.00
|
0.03
|
0.11
|
-0.02
|
0.00
|
| 1.55
|
4.95
|
4.75
|
-1.82
|
2.42
|
|
| Ct
|
0.00
|
-0.02
|
0.08
|
0.22
|
0.00
|
| 0.87
|
-1.65
|
1.24
|
9.39
|
1.12
|
|
| Table Panel 5B VAR estimates of returns from GBP carry trade, equity, bond, and commodity(Crude), optimal lag =1 | |||||
| GBPt-1 | EQt-1 | Bt-1 | Ct-1 | C | |
| GBPt | 0.98 | 0.18 | -0.01 | -0.14 | 0.00 |
| 105.19 | 3.19 | -0.08 | -3.01 | -0.01 | |
| EQt | 0.00 | 0.04 | 0.01 | 0.18 | 0.00 |
| -0.40 | 0.69 | 0.07 | 3.89 | -1.20 | |
| Bt | -0.01 | 0.06 | 0.28 | 0.04 | 0.00 |
| -0.61 | 1.06 | 2.06 | 0.94 | 0.21 | |
| Ct | 0.00 | 0.03 | 0.09 | -0.02 | 0.00 |
| -0.01 | 1.48 | 1.72 | -1.13 | 1.41 | |
| Table Panel 6A VAR estimates of returns from HKD carry trade, equity, bond, and commodity(Gold), optimal lag =1 | |||||
| HKDt-1 | EQt-1 | Bt-1 | Gt-1 | C | |
| HKDt | 0.98 | 0.16 | -0.06 | -0.02 | 0.00 |
| 238.99 | 13.11 | -1.07 | -0.89 | 0.84 | |
| EQt | 0.00 | 0.04 | 0.11 | 0.04 | 0.00 |
| 0.08 | 1.79 | 0.96 | 0.86 | 1.38 | |
| Bt | 0.00 | 0.01 | 0.09 | -0.02 | 0.00 |
| -0.89 | 3.07 | 4.02 | -1.86 | 3.53 | |
| Gt | 0.00 | -0.03 | 0.04 | 0.21 | 0.00 |
| -0.53 | -2.26 | 0.63 | 8.85 | 2.14 | |
| Table Panel 6B VAR estimates of returns from HKD carry trade, equity, bond, and commodity(Crude), optimal lag =1 | |||||
| HKDt-1 | EQt-1 | Bt-1 | Ct-1 | C | |
| HKDt | 0.99 | 0.24 | -0.07 | -0.06 | 0.00 |
| 120.93 | 5.86 | -0.62 | -2.48 | 0.02 | |
| EQt | -0.01 | 0.03 | 0.29 | -0.05 | 0.00 |
| -0.91 | 0.73 | 2.15 | -1.80 | 1.23 | |
| Bt | 0.00 | 0.03 | 0.08 | -0.01 | 0.00 |
| 0.16 | 1.87 | 1.79 | -0.82 | 1.82 | |
| Ct | 0.01 | -0.04 | -0.13 | 0.02 | 0.00 |
| 0.56 | -0.56 | -0.60 | 0.50 | -1.03 | |
| Table Panel 7A VAR estimates of returns from JPY carry trade, equity, bond, and commodity (Gold), optimal lag =1 | |||||
| JPYt-1 | EQt-1 | Bt-1 | Gt-1 | C | |
| JPYt | 0.98 | 0.29 | -0.06 | -0.08 | 0.00 |
| 212.26 | 13.98 | -0.59 | -2.11 | 0.16 | |
| EQt | 0.00 | 0.08 | 0.09 | 0.10 | 0.00 |
| -0.01 | 3.04 | 0.68 | 2.00 | 1.29 | |
| Bt | 0.00 | 0.02 | 0.12 | -0.02 | 0.00 |
| 0.29 | 3.36 | 4.32 | -1.77 | 2.04 | |
| Gt | 0.00 | -0.03 | 0.09 | 0.23 | 0.00 |
| -0.22 | -1.88 | 1.31 | 8.74 | 1.93 | |
| Table Panel 7B VAR estimates of returns from JPY carry trade, equity, bond, and commodity(crude), optimal lag =1 | |||||
| JPYt-1 | EQt-1 | Bt-1 | Ct-1 | C | |
| JPY | 0.98 | 0.41 | 0.13 | -0.11 | 0.00 |
| 102.76 | 5.53 | 0.69 | -2.55 | 0.57 | |
| EQUITY | -0.01 | 0.10 | 0.25 | -0.02 | 0.00 |
| -0.79 | 1.75 | 1.73 | -0.63 | 2.03 | |
| BONDS | 0.00 | 0.02 | 0.08 | -0.01 | 0.00 |
| 0.40 | 0.99 | 1.33 | -0.63 | 1.52 | |
| GOLD | 0.00 | -0.04 | -0.12 | 0.05 | 0.00 |
| 0.00 | -0.35 | -0.46 | 0.81 | -0.41 | |
| Table Panel 8A VAR estimates of returns from NZD carry trade, equity, bond, and commodity (Gold), optimal lag =1 | |||||
| NZDt-1 | EQt-1 | Bt-1 | Gt-1 | C | |
| NZDt | 0.90 | 0.00 | 0.46 | 0.20 | 0.00 |
| 70.19 | 0.09 | 1.99 | 2.54 | -0.94 | |
| EQt | -0.01 | -0.03 | 0.22 | 0.23 | 0.00 |
| -1.61 | -1.95 | 2.45 | 7.50 | 1.19 | |
| Bt | 0.00 | 0.02 | 0.13 | -0.02 | 0.00 |
| 1.34 | 3.44 | 4.12 | -1.79 | 1.97 | |
| Ct | -0.01 | 0.06 | 0.05 | 0.10 | 0.00 |
| -1.24 | 2.08 | 0.30 | 1.69 | 0.66 | |
| Table Panel 8B VAR estimates of returns from NZD carry trade, equity, bond, and commodity(crude), optimal lag =1 | |||||
| NZDt-1 | EQt-1 | Bt-1 | Ct-1 | C | |
| NZDt | 0.93 | -0.06 | 0.32 | -0.04 | 0.00 |
| 40.37 | -0.73 | 0.79 | -1.05 | 1.83 | |
| EQt | 0.01 | 0.09 | 0.27 | -0.11 | 0.00 |
| 0.25 | 1.03 | 0.66 | -2.68 | 1.49 | |
| Bt | 0.00 | 0.03 | 0.09 | 0.00 | 0.00 |
| 0.49 | 1.42 | 1.10 | -0.45 | 1.66 | |
| Ct | 0.00 | 0.00 | -1.23 | -0.10 | 0.00 |
| 0.04 | 0.00 | -1.35 | -1.10 | -0.64 | |
| Table Panel 9A VAR estimates of returns from RUB carry trade, equity, bond, and commodity(Gold), optimal lag =1 | |||||
| RUBt-1 | EQt-1 | Bt-1 | Gt-1 | C | |
| RUBt | 0.99 | 0.02 | -0.08 | -0.13 | 0.00 |
| 222.12 | 0.60 | -0.57 | -2.53 | 0.35 | |
| EQt | 0.00 | 0.07 | 0.13 | 0.06 | 0.00 |
| -0.20 | 2.77 | 1.08 | 1.29 | 0.67 | |
| Bt | 0.00 | 0.03 | 0.12 | -0.02 | 0.00 |
| -0.47 | 4.83 | 4.62 | -2.13 | 2.55 | |
| Gt | 0.00 | -0.02 | 0.04 | 0.22 | 0.00 |
| -0.77 | -1.22 | 0.62 | 8.63 | 1.13 | |
| Table Panel 9B VAR estimates of returns from RUB carry trade, equity, bond, and commodity (Crude), optimal lag =1 | |||||
| RUBt-1 | EQt-1 | Bt-1 | Ct-1 | C | |
| RUBt | 1.00 | 0.02 | -0.10 | -0.02 | 0.00 |
| 63.93 | 0.31 | -0.60 | -0.33 | 1.78 | |
| EQt | 0.03 | 0.02 | 0.26 | 0.00 | 0.00 |
| 1.79 | 0.27 | 1.78 | -0.08 | 1.25 | |
| Bt | 0.01 | 0.03 | 0.08 | -0.02 | 0.00 |
| 1.72 | 1.24 | 1.34 | -1.25 | 1.60 | |
| Ct | 0.03 | 0.02 | -0.01 | 0.14 | 0.00 |
| 1.72 | 0.38 | -0.08 | 2.60 | -0.89 | |
| Table Panel 10A VAR estimates of returns from SGD carry trade, equity, bond, and commodity(Gold), optimal lag =1 | |||||
| SGDt-1 | EQt-1 | Bt-1 | Gt-1 | C | |
| SGDt | 0.98 | 0.09 | -0.10 | -0.05 | 0.00 |
| 155.69 | 8.52 | -1.57 | -2.16 | 0.67 | |
| EQt | -0.01 | 0.05 | 0.05 | 0.12 | 0.00 |
| -0.41 | 1.67 | 0.26 | 1.75 | 0.83 | |
| Bt | 0.00 | 0.02 | 0.11 | -0.03 | 0.00 |
| 1.42 | 3.69 | 3.30 | -2.72 | 1.64 | |
| Gt | 0.00 | -0.02 | 0.17 | 0.24 | 0.00 |
| 0.34 | -1.10 | 1.88 | 7.40 | 1.45 | |
| Table Panel 10B VAR estimates of returns from SGD carry trade, equity, bond, and commodity(Crude), optimal lag =1 | |||||
| SGDt-1 | EQt-1 | Bt-1 | Ct-1 | C | |
| SGDt | 0.98 | 0.06 | 0.04 | 0.00 | 0.00 |
| 67.22 | 1.55 | 0.20 | -0.06 | 1.09 | |
| EQt | 0.01 | 0.12 | 0.18 | -0.12 | 0.00 |
| 0.30 | 1.23 | 0.36 | -3.01 | 0.85 | |
| Bt | 0.00 | 0.04 | 0.13 | 0.00 | 0.00 |
| -0.35 | 1.91 | 1.32 | -0.17 | 1.51 | |
| Gt | 0.01 | 0.08 | -2.11 | -0.19 | 0.00 |
| 0.15 | 0.34 | -1.72 | -1.89 | -0.83 | |
| Table Panel 11A VAR estimates of returns from USD carry trade, equity, bond, and commodity(Crude), optimal lag =1 | |||||
| (USD)t-1 | EQt-1 | Bt-1 | Ct-1 | C | |
| USDt | 0.97 | 0.05 | 0.03 | 0 | 0 |
| 70.33 | 1.33 | 0.14 | 0.15 | 1.48 | |
| EQt | -0.03 | 0.27 | 0.07 | -0.07 | 0 |
| -0.82 | 2.62 | 0.14 | -1.47 | 1.43 | |
| Bt | 0 | 0.04 | 0.12 | 0 | 0 |
| -0.41 | 2.03 | 1.16 | 0.09 | 1.86 | |
| Ct | 0.03 | 0.08 | -1 | -0.08 | 0 |
| 0.3 | 0.34 | -0.82 | -0.74 | -0.85 | |
| Table Panel 12 A VAR estimates of returns from USD Carry trade(future and far end month), equity bond and commodity(Gold),optimal lag= 2 | |||||||||
| USDt-1 | USDt-2 | EQt-1 | EQt-2 | BONDt-1 | BONDt-2 | GOLDt-1 | GOLDt-2 | C | |
| USD | 0.57 | 0.19 | -0.02 | 0.03 | 0.46 | 0.3 | 0.03 | 0.12 | 0.01 |
| 6.38 | 1.82 | -0.41 | 0.78 | 1.49 | 1.37 | 0.45 | 1.6 | 2.61 | |
| EQUITY | 0.26 | -0.48 | 0.08 | -0.14 | -0.56 | -0.38 | -0.06 | -0.41 | 0.01 |
| 0.94 | -1.53 | 0.57 | -1.04 | -0.6 | -0.57 | -0.26 | -1.86 | 0.78 | |
| BONDS | 0.12 | -0.12 | 0 | 0.01 | 0.34 | -0.07 | 0 | 0.01 | 0 |
| 1.91 | -1.67 | -0.1 | 0.3 | 1.61 | -0.44 | 0.05 | 0.15 | -0.24 | |
| GOLD | -0.21 | 0.33 | -0.19 | -0.05 | -1.14 | -1.57 | 0.22 | -0.05 | -0.01 |
| -0.48 | 0.66 | -0.81 | -0.26 | -0.77 | -1.5 | 0.63 | -0.14 | -0.32 | |
| Table Panel 12B VAR estimates of returns from USD Carry trade(future and 3 month return), equity bond and commodity(Crude),optimal lag= 1 | |||||
| USDt-1 | EQt-1 | BONDt-1 | Crude_oilt-1 | C | |
| USD | 0.24 | -0.08 | -0.56 | -0.23 | -0.01 |
| 1.77 | -0.7 | -1.45 | -0.96 | -1.74 | |
| BONDS | 0.48 | -0.26 | -1 | -0.66 | 0.03 |
| 0.7 | -0.49 | -0.52 | -0.54 | 0.76 | |
| Table Panel 13A VAR estimates of returns from EURO Carry trade(future and 3 months return), equity bond and commodity(Gold),optimal lag= 1 | |||||
| EUROt-1 | EQt-1 | BONDt-1 | CRUDE_OILt-1 | C | |
| EURO | 0.01 | -0.05 | 0.06 | -0.01 | 0.00 |
| 0.47 | -3.21 | 1.32 | -0.47 | -1.12 | |
| BONDS | 0.24 | -0.02 | -0.07 | -0.04 | 0.01 |
| 5.12 | -0.75 | -1.11 | -1.25 | 15.70 | |
| CRUDE_OIL | -0.04 | -0.01 | 0.19 | 0.27 | 0.00 |
| -0.58 | -0.28 | 2.10 | 5.99 | 0.42 | |
| EQUITY | 0.04 | 0.01 | -0.28 | -0.11 | 0.00 |
| 0.48 | 0.21 | -2.30 | -1.84 | -0.05 | |
| Table Panel 14A VAR estimates of returns from GBP Carry trade (future and 3 months return), equity bond and commodity(Gold), optimal lag= 2 | |||||
| GBPt-1 | EQt-1 | BONDt-1 | GOLDt-1 | C | |
| GBP | 0.26 | 0.00 | 0.06 | 0.01 | 0.00 |
| 6.87 | 0.15 | 0.67 | 0.31 | -2.90 | |
| EQUITY | -0.06 | 0.11 | -0.26 | -0.10 | 0.00 |
| -1.15 | 3.00 | -2.16 | -2.02 | 1.27 | |
| BONDS | -0.01 | -0.06 | 0.06 | -0.01 | 0.00 |
| -0.40 | -5.33 | 1.54 | -0.75 | -2.63 | |
| GOLD | -0.01 | -0.03 | 0.13 | 0.26 | 0.00 |
| -0.38 | -1.06 | 1.42 | 6.61 | 0.71 | |
| Table Panel 14B VAR estimates of returns from GBP Carry trade (future and 3 months return), equity bond and commodity (Crude), optimal lag= 2 | |||||||||
| GBPt-1 | GBPt-2 | EQt-1 | EQt-2 | BONDt-1 | BONDt-2 | Crudet-1 | Crudet-2 | C | |
| GBP | 0.14 | 0.21 | 0.00 | -0.03 | 0.21 | 0.18 | -0.04 | 0.14 | 0.00 |
| 2.04 | 3.10 | 0.04 | -0.53 | 1.90 | 1.20 | -0.31 | 1.28 | 3.00 | |
| EQUITY | 0.04 | 0.02 | -0.07 | -0.02 | -0.03 | -0.04 | 0.01 | 0.07 | 0.00 |
| 1.42 | 0.62 | -3.46 | -1.05 | -0.64 | -0.69 | 0.14 | 1.63 | -1.99 | |
| BONDS | 0.10 | -0.05 | 0.06 | 0.00 | -0.02 | 0.04 | 0.18 | 0.02 | 0.00 |
| 2.12 | -1.06 | 1.71 | 0.12 | -0.26 | 0.42 | 2.55 | 0.34 | -0.43 | |
| Crude_oil | -0.12 | -0.06 | 0.09 | 0.02 | -0.12 | -0.12 | 0.01 | -0.11 | 0.00 |
| -1.18 | -0.63 | 1.23 | 0.26 | -0.77 | -0.56 | 0.04 | -0.68 | 0.70 | |
| Table Panel 15A VAR estimates of returns from JPY Carry trade (future and 3 month return), equity bond and commodity (Gold), optimal lag= 2 | |||||||||
| JPYt-1 | JPYt-2 | EQt-1 | EQt-2 | BONDt-1 | BONDt-2 | GOLDt-1 | GOLDt-2 | C | |
| JPY | -0.04 | -0.04 | -0.07 | 0.02 | 0.30 | -0.66 | -0.08 | 0.17 | 0.00 |
| -1.02 | -1.14 | -1.31 | 0.44 | 2.52 | -4.77 | -1.04 | 2.39 | -3.08 | |
| EQUITY | -0.22 | 0.07 | 0.02 | 0.23 | 0.52 | 0.06 | 0.16 | 0.21 | 0.00 |
| -2.66 | 0.88 | 0.22 | 2.30 | 2.25 | 0.23 | 1.11 | 1.57 | -1.05 | |
| BONDS | 0.50 | 0.21 | 0.04 | 0.25 | 0.47 | 0.39 | -0.08 | 0.73 | 0.00 |
| 4.33 | 1.93 | 0.26 | 1.73 | 1.41 | 1.00 | -0.38 | 3.77 | -2.42 | |
| GOLD | 0.03 | 0.21 | 0.00 | -0.35 | -0.11 | -0.33 | -0.29 | -0.27 | 0.00 |
| 0.33 | 2.14 | 0.03 | -2.70 | -0.36 | -0.93 | -1.55 | -1.52 | 1.99 | |
| Table Panel 15B VAR estimates of returns from JPY Carry trade (future and 3 months return), equity bond and commodity (Crude), optimal lag= 2 | |||||||||
| JPYt-1 | JPYt-2 | EQt-1 | EQt-2 | BONDt-1 | BONDt-2 | CRUDEt-1 | CRUDEt-2 | C | |
| JPYf | -0.04 | -0.12 | -0.09 | 0.00 | 0.35 | -1.34 | -0.24 | 0.01 | 0.00 |
| -0.81 | -2.70 | -1.12 | -0.03 | 3.05 | -7.49 | -1.56 | 0.05 | -3.79 | |
| EQUITY | 0.58 | 0.03 | -0.09 | 0.04 | 0.27 | 0.44 | -0.40 | 0.41 | -0.01 |
| 3.26 | 0.15 | -0.30 | 0.18 | 0.63 | 0.66 | -0.70 | 0.85 | -2.21 | |
| BONDS | 0.05 | 0.34 | 0.09 | -0.36 | -0.11 | -0.02 | 0.15 | -0.16 | 0.00 |
| 0.38 | 2.61 | 0.38 | -2.24 | -0.35 | -0.03 | 0.34 | -0.44 | 2.00 | |
| CRUDE | -0.14 | -0.01 | 0.05 | 0.02 | -0.03 | 0.37 | 0.13 | 0.12 | 0.00 |
| -2.29 | -0.17 | 0.43 | 0.30 | -0.24 | 1.65 | 0.71 | 0.77 | -0.63 | |
| Table Panel 16A VAR estimates of returns from USD Carry trade (future and 1 month return), equity bond and commodity (Gold), optimal lag= 2 | |||||||||
| USDt-1 | USDt-2 | EQt-1 | EQt-2 | BONDt-1 | BONDt-2 | GOLDt-1 | GOLDt-2 | C | |
| USD | 0.34 | 0.38 | 0.02 | -0.01 | 0.01 | -0.07 | 0.03 | 0.01 | 0.01 |
| 5.86 | 6.44 | 1.03 | -0.27 | 0.19 | -0.81 | 0.94 | 0.28 | 4.89 | |
| EQUITY | -0.06 | 0.00 | 0.00 | 0.09 | 0.20 | 0.37 | 0.32 | -0.04 | 0.00 |
| -0.46 | -0.03 | -0.02 | 1.64 | 1.58 | 1.79 | 4.05 | -0.52 | 0.62 | |
| BONDS | 0.00 | -0.03 | -0.05 | -0.05 | 0.05 | -0.50 | -0.05 | 0.07 | 0.00 |
| -0.01 | -0.50 | -2.02 | -1.90 | 0.85 | -5.41 | -1.34 | 1.95 | -0.27 | |
| GOLD | -0.09 | 0.01 | -0.01 | -0.17 | -0.12 | -0.49 | -0.17 | -0.11 | 0.00 |
| -0.48 | 0.05 | -0.09 | -2.21 | -0.70 | -1.74 | -1.66 | -0.96 | 0.44 | |
| Table Panel 16B VAR estimates of returns from USD Carry trade (future and 1 month return), equity bond and commodity (Crude), optimal lag= 2 | |||||||||
| USDt-1 | USDt-2 | EQt-1 | EQt-2 | BONDt-1 | BONDt-2 | CRUDEt-1 | CRUDEt-2 | C | |
| USD | 0.35 | 0.37 | 0.01 | 0.02 | 0.01 | 0.02 | -0.01 | 0.04 | 0.01 |
| 3.37 | 3.30 | 0.31 | 0.41 | 0.16 | 0.17 | -0.09 | 0.37 | 2.48 | |
| EQUITY | 0.05 | 0.01 | 0.09 | 0.00 | -0.03 | 0.26 | 0.21 | -0.01 | 0.00 |
| 0.40 | 0.08 | 1.55 | -0.06 | -0.39 | 1.54 | 1.55 | -0.08 | -0.45 | |
| BONDS | 0.17 | 0.00 | -0.05 | -0.03 | 0.06 | -0.71 | -0.24 | 0.29 | 0.00 |
| 1.30 | -0.01 | -0.89 | -0.67 | 0.77 | -4.51 | -1.84 | 2.36 | -1.69 | |
| CRUDE | -0.51 | 0.16 | 0.00 | -0.18 | -0.28 | -0.22 | 0.04 | -0.45 | 0.01 |
| -1.60 | 0.45 | 0.02 | -1.45 | -1.36 | -0.54 | 0.11 | -1.46 | 1.18 | |
| Panel 17A VAR estimates of returns from EURO Carry trade (future and 1 month return), equity bond and commodity (Gold), optimal lag= 2 | |||||||||
| EUROt-1 | EUROt-2 | EQt-1 | EQt-2 | BONDt-1 | BONDt-2 | GOLDt-1 | GOLDt-2 | C | |
| EURO | 0.192 | 0.294 | 0.009 | 0.037 | -0.040 | -0.110 | -0.043 | 0.034 | 0.010 |
| 3.016 | 3.932 | 0.235 | 0.951 | -0.439 | -0.731 | -0.779 | 0.565 | 6.037 | |
| EQUITY | -0.067 | -0.107 | 0.001 | 0.092 | 0.216 | 0.289 | 0.342 | -0.078 | 0.004 |
| -0.793 | -1.077 | 0.010 | 1.787 | 1.778 | 1.435 | 4.683 | -0.974 | 1.596 | |
| BONDS | -0.002 | -0.039 | -0.05 | -0.05 | 0.044 | -0.496 | -0.050 | 0.058 | 0.000 |
| -0.048 | -0.867 | -2.11 | -2.54 | 0.817 | -5.533 | -1.536 | 1.622 | -0.18 | |
| GOLD | 0.057 | -0.045 | 0.010 | -0.12 | -0.139 | -0.506 | -0.105 | -0.064 | 0.000 |
| 0.490 | -0.328 | 0.133 | -1.64 | -0.836 | -1.839 | -1.052 | -0.584 | 0.017 | |
| Table Panel 17B VAR estimates of returns from EURO Carry trade(future and 1 month return), equity bond and commodity(Crude),optimal lag= 2 | |||||||||
| EUROt-1 | EUROt-2 | EQt-1 | EQt-2 | BONDt-1 | BONDt-2 | CRUDEt-1 | CRUDEt-2 | C | |
| EURO | 0.45 | 0.09 | -0.05 | -0.07 | 0.02 | 0.15 | -0.04 | -0.07 | 0.01 |
| 4.66 | 0.91 | -0.94 | -1.62 | 0.20 | 1.01 | -0.30 | -0.66 | 4.29 | |
| EQUITY | 0.21 | -0.19 | 0.07 | -0.01 | 0.01 | 0.25 | 0.29 | -0.06 | 0.00 |
| 2.12 | -1.88 | 1.36 | -0.21 | 0.12 | 1.65 | 2.39 | -0.49 | -0.26 | |
| BONDS | 0.09 | 0.00 | -0.06 | -0.06 | 0.04 | -0.68 | -0.20 | 0.21 | 0.00 |
| 0.86 | -0.04 | -1.13 | -1.38 | 0.54 | -4.41 | -1.61 | 1.80 | -1.36 | |
| CRUDE | -0.60 | 0.39 | 0.05 | -0.11 | -0.37 | -0.36 | -0.09 | -0.28 | 0.01 |
| -2.50 | 1.56 | 0.46 | -1.04 | -1.91 | -0.98 | -0.31 | -0.99 | 1.03 | |
| Table Panel 18A VAR estimates of returns from GBP Carry trade (future and 1 month return), equity bond and commodity (Gold), optimal lag= 2 | |||||||||
| GBPt-1 | GBPt-2 | EQt-1 | EQt-2 | BONDt-1 | BONDt-2 | GOLDt-1 | GOLDt-2 | C | |
| GBP | 0.69 | 0.30 | -0.01 | 0.03 | -0.09 | -0.22 | -0.02 | -0.03 | 0.00 |
| 11.56 | 4.97 | -0.13 | 0.63 | -0.80 | -1.20 | -0.28 | -0.41 | -0.52 | |
| EQUITY | -0.04 | 0.02 | 0.00 | 0.10 | 0.20 | 0.28 | 0.33 | -0.07 | 0.00 |
| -0.56 | 0.30 | 0.03 | 1.95 | 1.63 | 1.41 | 4.45 | -0.84 | -1.94 | |
| BONDS | -0.02 | 0.01 | -0.05 | -0.05 | 0.03 | -0.50 | -0.06 | 0.07 | 0.00 |
| -0.64 | 0.37 | -2.08 | -2.32 | 0.63 | -5.66 | -1.79 | 1.85 | -3.38 | |
| GOLD | 0.12 | -0.12 | 0.00 | -0.12 | -0.14 | -0.50 | -0.11 | -0.06 | 0.00 |
| 1.38 | -1.36 | 0.04 | -1.64 | -0.82 | -1.80 | -1.05 | -0.58 | 0.15 | |
| Table Panel 18B VAR estimates of returns from GBP Carry trade (future and near end month), equity bond and commodity (Crude), optimal lag= 2 | |||||||||
| GBPt-1 | GBPt-2 | EQt-1 | EQt-2 | BONDt-1 | BONDt-2 | Crude_oilt-1 | Crude_oilt-2 | C | |
| GBP | 0.91 | 0.08 | 0.08 | 0.02 | -0.01 | 0.1 | 0.13 | 0.02 | 0 |
| 8.58 | 0.7 | 1.23 | 0.35 | -0.13 | 0.54 | 0.89 | 0.17 | 0.78 | |
| EQUITY | -0.13 | 0.11 | 0.07 | -0.01 | 0.01 | -0.24 | 0.23 | -0.02 | 0 |
| -1.54 | 1.28 | 1.36 | -0.15 | 0.12 | -1.6 | 1.94 | -0.13 | 1.32 | |
| BONDS | -0.04 | 0.03 | 0.05 | 0.07 | 0.01 | -0.69 | 0.19 | -0.19 | 0 |
| -0.52 | 0.35 | 1 | 1.6 | 0.18 | -4.6 | 1.61 | -1.68 | 1.42 | |
| Crude_oil | 0.27 | -0.3 | 0.07 | -0.11 | 0.27 | 0.27 | 0.03 | -0.33 | 0.01 |
| 1.28 | -1.39 | 0.55 | -0.95 | 1.4 | 0.73 | 0.09 | -1.16 | 0.94 | |
| Table Panel 19A VAR estimates of returns from JPY Carry trade (future and 1 month return), equity bond and commodity (Gold), optimal lag= 2 | |||||||||
| JPYt-1 | JPYt-2 | EQt-1 | EQt-2 | BONDt-1 | BONDt-2 | GOLDt-1 | GOLDt-2 | C | |
| JPY | 0.23 | 0.22 | -0.01 | 0.02 | -0.13 | 0.04 | 0 | 0.12 | 0.01 |
| 3.08 | 2.72 | -0.32 | 0.46 | -1.43 | 0.27 | 0.08 | 1.92 | 6.09 | |
| EQUITY | -0.05 | -0.16 | 0 | 0.13 | 0.2 | 0.3 | 0.31 | -0.02 | 0 |
| -0.47 | -1.41 | 0.07 | 2.23 | 1.62 | 1.43 | 3.89 | -0.18 | 1.62 | |
| BONDS | -0.08 | -0.06 | -0.03 | -0.05 | 0.04 | -0.54 | -0.04 | 0.08 | 0 |
| -1.84 | -1.24 | -1.32 | -1.9 | 0.8 | -5.88 | -1.27 | 2.05 | 1.45 | |
| GOLD | -0.16 | 0.17 | 0.02 | -0.14 | -0.08 | -0.59 | -0.11 | -0.06 | 0 |
| -1.13 | 1.12 | 0.19 | -1.85 | -0.47 | -2.06 | -1 | -0.55 | 0.05 | |
| Table Panel 19B VAR estimates of returns from JPY Carry trade (future and near end month), equity bond and commodity (Crude), optimal lag= 2 | |||||||||
| JPYt-1 | JPYt-2 | Et-1 | Et-2 | Bt-1 | Bt-2 | Ct-1 | Ct-2 | C | |
| JPY | 0.27 | 0.09 | -0.12 | -0.09 | -0.23 | 0.18 | -0.28 | -0.01 | 0.01 |
| 2.24 | 0.55 | -1.59 | -1.3 | -1.96 | 0.76 | -1.46 | -0.05 | 3.65 | |
| EQUITY | 0.08 | 0.02 | 0.06 | -0.01 | -0.04 | 0.36 | 0.17 | -0.04 | 0 |
| 1.01 | 0.14 | 1.05 | -0.16 | -0.5 | 2.27 | 1.3 | -0.34 | -0.63 | |
| BONDS | -0.08 | -0.07 | -0.04 | -0.05 | 0.03 | -0.8 | -0.16 | 0.18 | 0 |
| -1 | -0.64 | -0.72 | -1.1 | 0.42 | -5 | -1.19 | 1.44 | 0.58 | |
| CRUDE | -0.25 | 0.36 | 0.03 | -0.13 | -0.15 | -0.37 | -0.07 | -0.14 | 0 |
| -1.24 | 1.33 | 0.22 | -1.13 | -0.79 | -0.94 | -0.21 | -0.46 | -0.12 | |
References
Atanasov, V., & Nitschka, T. (2014). Currency excess returns and global downside market risk. Journal of International Money and Finance, 47, 268-285.
Indexed at, Google Scholar, Cross Ref
Bakshi, G., & Panayotov, G. (2013). Predictability of currency carry trades and asset pricing implications. Journal of Financial Economics, 110(1), 139-163.
Indexed at, Google Scholar, Cross Ref
Baur, D.G., & Lucey, B.M. (2010). Is gold a hedge or a safe haven? An analysis of stocks, bonds and gold. Financial Review, 45(2), 217-229.
Indexed at, Google Scholar, Cross Ref
Brunnermeier, M.K., Nagel, S., & Pedersen, L.H. (2008). Carry trades and currency crashes. NBER Macroeconomics Annual, 23(1), 313-348.
Indexed at, Google Scholar, Cross Ref
Buncic, D., & Tischhauser, M. (2017). Macroeconomic factors and equity premium predictability. International Review of Economics & Finance, 51, 621-644.
Indexed at, Google Scholar, Cross Ref
Campbell, J.Y., Serfaty-De Medeiros, K., & Viceira, L.M. (2010). Global currency hedging. The Journal of Finance, 65(1), 87-121.
Indexed at, Google Scholar, Cross Ref
Cheung, Y.W., Chinn, M.D., & Pascual, A.G. (2005). Empirical exchange rate models of the nineties: Are any fit to survive? Journal of International Money and Finance, 24(7), 1150-1175.
Indexed at, Google Scholar, Cross Ref
Christiansen, C., Ranaldo, A., & Söderlind, P. (2011). The time-varying systematic risk of carry trade strategies. Journal of Financial and Quantitative Analysis, 46(4), 1107-1125.
Indexed at, Google Scholar, Cross Ref
Dobrynskaya, V. (2014). Downside market risk of carry trades. Review of Finance, 18(5), 1885-1913.
Indexed at, Google Scholar, Cross Ref
Hördahl, P., Sobrun, J., & Turner, P. (2016). Low long-term interest rates as a global phenomenon.
Jurek, J.W. (2014). Crash-neutral currency carry trades. Journal of Financial Economics, 113(3), 325-347.
Indexed at, Google Scholar, Cross Ref
Jylhä, P., & Suominen, M. (2011). Speculative capital and currency carry trades. Journal of Financial Economics, 99(1), 60-75.
Indexed at, Google Scholar, Cross Ref
Lee, H.C., & Chang, S.L. (2013). Spillovers of currency carry trade returns, market risk sentiment, and US market returns. The North American Journal of Economics and Finance, 26, 197-216.
Indexed at, Google Scholar, Cross Ref
Lettau, M., Maggiori, M., & Weber, M. (2014). Conditional risk premia in currency markets and other asset classes. Journal of Financial Economics, 114(2), 197-225.
Indexed at, Google Scholar, Cross Ref
Liu, M.H., Margaritis, D., & Tourani-Rad, A. (2012). Risk appetite, carry trade and exchange rates. Global Finance Journal, 23(1), 48-63.
Indexed at, Google Scholar, Cross Ref
Lu, H., & Jacobsen, B. (2016). Cross-asset return predictability: Carry trades, stocks and commodities. Journal of International Money and Finance, 64, 62-87.
Indexed at, Google Scholar, Cross Ref
Menkhoff, L., Sarno, L., Schmeling, M., & Schrimpf, A. (2012). Carry trades and global foreign exchange volatility. The Journal of Finance, 67(2), 681-718.
Indexed at, Google Scholar, Cross Ref
Tse, Y., & Zhao, L. (2012). The relationship between currency carry trades and US stocks. Journal of Futures Markets, 32(3), 252-271.
Indexed at, Google Scholar, Cross Ref
Received: 31-Jan-2020, Manuscript No. AAFSJ-22-11039; Editor assigned: 31-Jan-2020, PreQC No. AAFSJ-22-11039(PQ); Reviewed: 14-Fab-2022, QC No. AAFSJ-22-11039; Revised: 17-Fab-2022, Manuscript No. AAFSJ-22-11039(R); Published: 24-Feb-2022