Research Article: 2018 Vol: 22 Issue: 1
Technical, Pure Technical and Scale Efficiency: A Non-Parametric Approach of Pakistans Insurance and Takaful Industry
Che Azlan Taib, School of Technology Management and Logistics, University Utara Malaysia
Muhammad Saleem Ashraf, Islamic Business School, University Utara Malaysia
Mohd. Shahril Bin Ahmad Razimi, Islamic Business School, University Utara Malaysia
Keywords
Insurance companies, Data Envelopment Analysis, Technical Efficiency, Scale Efficiency.
Introduction
In this modern era of advanced technology, financial sector becomes a backbone of each and every economy. The financial sector is playing its significant role in mitigating the risk factors but the risk is the main ingredient of most of the business ventures. On the other hand stock market provides the investment opportunities to its investors. The financial chaos of 2007-2008 changed the worldview of the financial market (Harrington, 2009). Thus, experts are compelled to think about the alternative system rather than the conventional one. Islamic financial system, considered as alternative system got more attention than the other alternatives which are available in the financial market. Islamic financial institutions have shown their resilience during the financial distress of 2007-2008. Financial gurus, experts, academicians and policymakers are keen to analyse the different dimensions of the Islamic financial systems and they have shown their interest in the development of the different products and innovations (Chapra, 2011). Currently most of the Islamic Financial Institutions are launching new products which are compatible with the prevailing conventional system; most of their products are asset-based or Shar?’ah compliant. Almost 20% annual growth of Islamic finance has been observed (Chapra, 2008).
In the current literature, the academicians and financial experts are trying to compare the performance of the Islamic and conventional financial institutions. A number of studies discussed this behaviour by using different methodologies and observed different findings. Quite a number of studies found that Islamic financial institutions are more efficient, for example, Azhar Rosly and Afandi Abu Bakar (2003) found for Malaysia, (El-Gamal and Inanoglu (2004); El?Gamal and Inanoglu (2005)) estimated for Turkey, El Moussawi and Obeid (2011) for GCC, Sufian and Chong (2008) observed more efficient than conventional institutions in Malaysia, Ul Haque and Mirakhor (1986) observed that these are more stable and contributing to the growth of the economy whereas Beck, Demirgüç-Kunt and Levine (2010) found Islamic financial institutions are comparatively cost effective.
It is well observed that Islamic banking industry is passed its infancy stage and moving towards its maturity, however, still Islamic insurance industry (Takaful) is passing the phase of infancy. The concept of cooperative risk sharing is the oldest form of insurance but the term and concept of takaful were first introduced in Sudan in 1979 and later on in Saudi Arabia. Now takaful is operating its business in more than 22 countries and getting popularity in other regions (Qureshi, 2011). Majma-al-Fiqh, the Grand Council of Islamic Scholars, Saudi Arabia, approved takaful as an alternate to insurance according to the shari’ah ruling in 1985 and Takaful industry has its global volume US $25 billion with only 305 takaful-retakaful operators and windows. However, it is worthwhile to note that the growth of takaful industry is 12% per annum which higher than the conventional insurance industry which is only 4% per annum ("Annual Islamic Financial Services Industry Stability Report", 2017).
At the time of independence in 1947, 84 insurance companies were operative in Pakistan but the insurance industry was nationalized in 1972 and merged into State Life of Pakistan. However there was a major breakthrough in the 1990s, the financial reforms took into place and these reforms allowed private and foreign companies to establish their business in the insurance sector (Malik, Malik & Faridi, 2011; "State Bank of Pakistan", 2005).
The Council of Islamic Ideology in Pakistan reviewed the model for Pakistan’s financial sector according to the shari’ah rulings, on 29th April 1992 (Khan, 2016) and the Government of Pakistan issued “Takaful Rules 2005″ on 3rd September 2005, an Islamic compatible takaful operational model. Since then, takaful industry established and currently, two family takaful and three general takaful firms are in operation. It attracts the new customers because of its shari’ah compliance ("Securities and Exchange Commission of Pakistan," 2016).
Although like other parts of the world efficiency analysis have been conducted in Pakistan accounting for Insurance sectors as Takaful sector has started in Pakistan in 2005 and it is an infant industry and the studies of the efficiencies including Technical, Pure Technical and Scale efficiencies are lacking for a responsible period of time for Pakistan. This study will try to fill the gap by taking data of Pakistani Insurance companies from 2007-2016 with panel-based comparative analysis further decomposing the sector into Conventional and Islamic.
The primary objectives of this paper are to present the efficiencies of Insurance sector by evaluating Technical, Pure Technical and Scale efficiencies using Data Envelopment Analysis (DEA) by taking data from the period 2007-2016 and also to find any difference of efficiency in Islamic and Conventional segments of these sectors.
Literature Review
The efficiency measurement for the financial sector is one of the most rapidly growing literature in the market. A number of efficiency studies for the insurance sector, in particular, have been conducted and primarily employed two different approaches, namely, the parametric and non-parametric approach. There are a number of studies measuring the efficiency of the insurance industry at a country level. A number of researchers estimated the efficiencies of the insurance industry of US. Gardner and Grace (1993) estimated the efficiency of the sample of 561 firms and found the inefficiencies for the different internal and external factors. Cummins and Xie (2013) estimated 781 property and liability of US insurance companies from 1993 to 2009 and found that the maximum firms are operating with a decreasing return to scale.
Some of the researchers studied the European insurance industry including Fecher, Kessler, Perelman and Pestieau (1993) who estimated the efficiency of life and non-life insurance companies of France for the period of 1984 to 1989 and found the non-life insurer more efficient than the life insurers. Cummins and Turchetti (1996) estimated the efficiency and productivity growth of Italian insurance industry through the production frontier by applying parametric (SFA) approach and found the efficiency level between 70 to 78%. Noulas, Lazaridis, Hatzigayios and Lyroudi (2001) and Cummins and Rubio Misas (2001) studied Greece and Spanish insurance industry simultaneously and found the firms operating with decreasing return to scale.
Some researchers made the comparison of the insurance companies of the US and other European countries. Rai (1996) measured the X-efficiencies of the insurance companies (life and non-life) of nine European countries (France Switzerland, United Kingdom, Italy, Netherlands, Germany, Denmark, Finland, Sweden,) one Asian (Japan) and US using the SFA technique between 1988-1992 and found the variation in the efficiencies on the basis of size, nature and location. Kasman and Turgutlu (2011) measured the efficiency of a group of countries by using the Stochastic Cost Frontier (SCF) covering the period 1995-2005 and found that small companies are more efficient than the large firms for the said countries.
Some researcher worked on Asian and African insurance industry including Alhassan and Biekpe (2015) and Barros and Wanke (2014) examined the technical efficiency and capacity issues of the companies of South Africa and Mozambique found high technical inefficiency. Huang and Eling (2013) analysed the behaviour of the insurance companies of Brazil, Russia, India and China (BRIC Economies) and found that India is less technical efficient whereas Brazil is maximum efficient amongst them. Hu, Zhang, Hu and Zhu (2009) studied the efficiency of the insurance sector in China over the period of 1999 to 2004 and found the relationship between ownership structure and efficiency. Firms are mixed efficient, in the beginning and at the last, they perform efficiently whereas in the middle they were less efficient.
The takaful is mostly being used in Muslim countries. Some of the researchers tried to calculate the efficiency of the takaful industry. Miniaoui and Chaibi (2014) presented a comparative analysis of GCC countries and Malaysia, from 20006 to 2009. They selected 12 takaful operators (three were from UAE, two from Saudi Arabia, two from Qatar, one from Bahrain and four from Malaysia) and found GCC market more efficient than Malaysia. Kader, Adams and Hardwick (2010) using DEA for evaluating the cost efficiency of 26 non-life takaful firms from the sample of 10 Islamic countries and Cost efficiency score was 0.70.
Some researcher computes the efficiency of insurance and takaful companies including Singh and Zahran (2013) who estimated the cost efficiency of both types of the insurance companies for the eight MENA countries, i.e., Bahrain, Egypt, Jordan, Kuwait, Qatar, Saudi Arabia and Tunisia. They concluded that takaful companies are less efficient due to Shari’ah compliant products. Janjua and Akmal (2015) compared the efficiency of both types of insurance (conventional and Islamic) companies operating in Pakistan over the period of 2006-2011. Saad (2012) examined the efficiency of conventional and Islamic insurance companies in Malaysia for 2007-2009 and concluded that the performance of takaful companies (Islamic Insurance Companies) was less than the average of the industry.
Methodology
Berger, Hunter and Timme (1993) defined that efficiency can be measured through the scale of average variable cost. Technical efficiency is the ratio of the input of the firm with reference to the input of fully efficient firm producing the same output which means the technical efficiency is the ability of a firm to produce output with the specified inputs (Cummins, Weiss, Xie & Zi, 2010). Technical efficiency can be observed from the production possibility frontier (PPF). If it is moving upward it implies that this is due to the technical efficiency. This shows the association between the units input and units output. As there is no need of the prices of the factors of production so the conditions of the market have no impact of technical efficiency (Barros & Mascarenhas, 2005; Bauer, Berger, Ferrier & Humphrey, 1998). Chan (2008) defined pure technical efficiency as the additional consumption of the input resources for a specified output due to the operational management. Pure Technical Efficiency is the ability of the management to save the input for producing a certain amount of output or to produce more output with a given level of input. According to Farrell (1957) and Kounetas and Tsekouras (2007) that Scale efficiency is defined as the parameter that which level of average productivity a firm can achieve on operating at optimum scale size. This is the point of time when the average productivity will be at its maximum level (Figure 1).
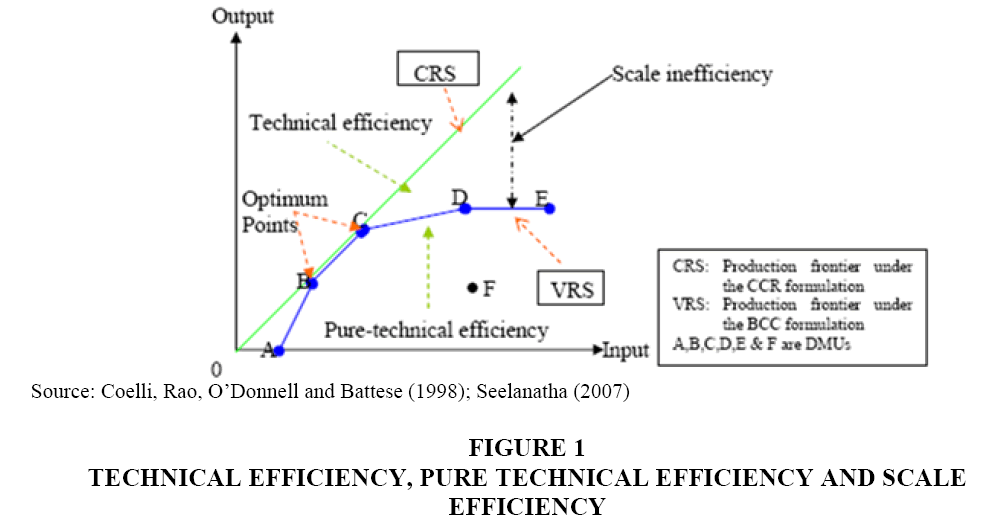
Figure 1: Technical Efficiency, Pure Technical Efficiency and Scale Efficiency
The different techniques are being used to measure the efficiency. Among them frontier efficiency is considered as the best one and has an advantage over other techniques. In the last few decades, a number of frontier approaches have been developed to measure the firm performance.
The two widely used techniques are parametric and non-parametric frontier techniques used in the financial sector. Parametric approaches are able to identify the functional relationship among the variable like cost, profit, output among the input, output and other factors. This implicitly considers the identification of production process and also consistent with the functional form of the production process which is explained by Cummins and VanDerhei (1979) as "consistent with the organization of production at the firm". However, these approaches have different assumptions about the nature of distribution and the error or stochastic term. SFA is the most popular technique among the parametric approach.
Farrell (1957) developed a mathematical model in 1957 by using single input-output technical for the measurement of technical efficiency. But the Data Envelopment Approach (DEA) based on mathematical programming was introduced by Charnes, Cooper and Rhodes (1978), later on known as CCR model. This model was developed for measuring the relative efficiency and taking the set of decision-making units (DMU) and having the identical set of input and output variables. DEA as a technique is based on the linear programming. It is applying for searching that decision-making unit (DMU) which shows the best practice performance, i.e., same inputs but more output or same output with the fewer units of input (Berger & Humphrey, 1997).
The DEA method, as a non-parametric technique, permits analysis of small sizes; it is especially useful when the sample size is limited, as Pakistan’s takaful and insurance industry fulfils this condition so it is feasible from the researcher’s point of view to apply this technique for the empirical testing of the hypothesis of this study. Other parametric methods, such as SFA, DFA and TFA, require large sample sizes in order to obtain better or more degrees of freedom for valid results. Compared to commonly used performance measurements, such as ratio and regression analysis, DEA focuses on the outliers. Specifically, DEA identifies units that achieve the best results. Therefore, DEA allows for the examination of best performance and their best practices and gives the efficiency score for each unit. It gives information on how each different firm perform. Hence, the DEA solution is unique for each DMU under investigation, which allows a direct comparison to be made against a peer or a combination of peers.
A non-parametric DEA is employed with variable returns to scale (VRS) assumption to measure input-oriented for technical efficiency of insurance industry of Pakistan. This methodology has been used by many studies (Al-Amri, 2015; Ismail, Alhabshi & Bacha, 2011; Saad, 2012; Zimková, 2015). DEA entails the construction of a non-parametric production frontier on the basis of the actual input-output observation in the sample as related to each firm’s efficiency measured in the sample (Coelli, 1996).
The results of measurement were calculated a fractional linear estimation of efficiency into a mathematical linear programming format. A technology efficiency (TE) by results that shows how much the firm achieve their outputs given assumptions inputs constant. To extend the measurement of pure technical efficiency (PTE) and scale efficiency (SE), the model from Banker, Charnes and Cooper (1984) which showed the convexity constraint of outputs become difference and very related to selected inputs. This approach ensures that the composite unit is of similar scale size as the unit being measured. The resulting efficiency of the model is always lesser or at least equal to one, meaning that DMUs selected with the lowest input or highest output levels are rated efficient. The BCC model allows are based on assumption variable returns to scale (VRS).
In many of the researchers conducted in the insurance and takaful industry, efficiency is an input-output equation. The objective of insurers and takaful is to produce a profitable business and maximize shareholder wealth, for takaful includes of policyholders benefit as well. The underwriter of insurance and takaful constantly strives to select certain types of insurable risk application by proposal given by policyholders. Underwriting profit also able to gain higher yield by select prospective insured according to the company’s underwriting standards and should end up with low claim expenses (Rejda, 2011). At the same time, the management team also engage in daily operations, such as accounting, auditing, marketing of agencies and brokerage services, legal, loss surveyor, etc. Management expenses use as inputs as these involve the company staff running everyday operations they should act as efficient as possible (Rejda, 2011). As result, there are three major inputs equity, general & management expenses and claim expenses. This selected input is in accordance with Biener, Eling and Wirfs (2016); Alhassan and Biekpe (2015); Al-Amri (2015); Zimková (2015); Ismail et al. (2011), etc.
The primary objective of insurers and takaful is to attain a positive investment income of premium collected. The insurance company and takaful operators collect premiums or contribution from policyholders, later should invest the fund collected normally in low-risk investments assets. This selected output is in accordance with Biener et al. (2016), Jaiyeoba and Haron (2015), Faruk and Rahaman (2015), Rahman (2015), Abduh, Omar and Tarmizi (2012), Al-Amri (2015), etc.
The study uses secondary data for the takaful and insurance industry obtained for the period from 2008 to 2016. The sample consists of fourteen insurance companies including State life insurance, Adamjee insurance, Alflah Insurance, Asia Insurance, Askari insurance, Atlas insurance, EFU-General insurance, EFU-Life insurance, Habib insurance, IGI insurance, Jublie Life Insurance, New Jublie insurance, Premier insurance and Shaheen insurance and five takaful operator, i.e., Takaful Pak, Pak-Qatar (General), Pak-Qatar (Family), Pak-Kuwait, Dawood Takaful having more than 80% (in terms of premium) of market share.
The period is chosen for the reason that although takaful operators start a business in 2005 all five takaful operators start a business in 2008. The data of insurance and takaful firms is taken from the annual financial statements collected from the concerned firms, Security Corporation of Pakistan (SECP) and state bank of Pakistan.
Results and Discussions
The technical efficiency of the insurance and takaful companies in Pakistan was estimated using DEA technique. It was further decomposed into pure technical and scale efficiency. The summary statistics regarding the technical efficiency are defined in Table 1 and the average results of technical, pure technical and scale efficiencies are defined in Table 2. As mentioned above Table 1 presents the technical efficiency scores which are measured on constant returns to scale. The average technical efficiency scores are ranged from 53% (2014) to 98% (2008) for the conventional companies. It is worthwhile to note that the technical efficiency scores were greater than 90% till 2009; generally, the scores were declining from 2010 to 2016 and approached to 56%.
>
| Table 1 Technical Efficiency Scores of Pakistani Insurance Companies: 2008-2016 |
|||||||||
| Company Name | 2008 | 2009 | 2010 | 2011 | 2012 | 2013 | 2014 | 2015 | 2016 |
| Adamjee Insurance Co. Ltd. | 1.00 | 1.00 | 0.82 | 0.39 | 0.41 | 0.61 | 0.45 | 0.51 | 0.46 |
| Alflah Insurance Co. Ltd. | 1.00 | 0.94 | 0.66 | 0.51 | 0.29 | 0.26 | 0.26 | 0.29 | 0.41 |
| Asia Insurance Co. Ltd. | 0.88 | 0.81 | 0.92 | 0.30 | 0.27 | 0.76 | 0.48 | 0.44 | 0.36 |
| Askari insurance | 0.99 | 1.00 | 1.00 | 0.50 | 0.36 | 0.26 | 0.25 | 0.30 | 0.37 |
| Atlas insurance | 1.00 | 0.89 | 0.76 | 0.71 | 0.81 | 0.78 | 0.81 | 0.86 | 0.73 |
| EFU-General insurance | 0.95 | 0.91 | 0.91 | 0.58 | 0.42 | 0.41 | 0.39 | 0.42 | 0.61 |
| EFU-Life insurance | 1.00 | 1.00 | 1.00 | 0.91 | 0.65 | 0.50 | 0.50 | 0.72 | 0.53 |
| Habib insurance | 0.95 | 1.00 | 0.91 | 0.59 | 0.65 | 0.62 | 0.70 | 0.53 | 0.46 |
| IGI insurance | 1.00 | 0.97 | 1.00 | 1.00 | 0.61 | 0.64 | 0.96 | 1.00 | 1.00 |
| Jublie Life Insurance | 1.00 | 1.00 | 0.92 | 0.93 | 0.81 | 0.67 | 0.73 | 0.63 | 0.91 |
| New Jublie insurance | 1.00 | 1.00 | 1.00 | 0.85 | 0.57 | 0.49 | 0.38 | 0.42 | 0.42 |
| Premier insurance | 1.00 | 1.00 | 0.74 | 0.81 | 0.28 | 0.30 | 0.31 | 0.31 | 0.24 |
| Shaheen insurance | 1.00 | 1.00 | 0.75 | 0.47 | 0.26 | 0.18 | 0.25 | 0.24 | 0.34 |
| State life insurance | 1.00 | 1.00 | 1.00 | 1.00 | 1.00 | 1.00 | 1.00 | 1.00 | 1.00 |
| Dawood Takaful. | 0.57 | 1.00 | 1.00 | 1.00 | 1.00 | 1.00 | 1.00 | 1.00 | 1.00 |
| Pak-Kuwait | 0.39 | 0.57 | 0.68 | 0.58 | 0.47 | 0.40 | 1.00 | 1.00 | NA |
| Pak-Qatar(Family) | 1.00 | 1.00 | 1.00 | 1.00 | 1.00 | 1.00 | 1.00 | 1.00 | 1.00 |
| Pak-Qatar(General) | 0.28 | 0.39 | 0.30 | 0.28 | 0.23 | 0.24 | 0.19 | 0.15 | 0.25 |
| Takaful Pak | 0.60 | 1.00 | 0.48 | 0.32 | 0.21 | 0.18 | 0.23 | 0.21 | 0.18 |
| Average (Conventional) | 0.98 | 0.97 | 0.88 | 0.68 | 0.53 | 0.53 | 0.53 | 0.55 | 0.56 |
| Average (Islamic) | 0.57 | 0.79 | 0.69 | 0.64 | 0.58 | 0.56 | 0.68 | 0.67 | 0.61 |
| Average (All) | 0.87 | 0.92 | 0.83 | 0.67 | 0.54 | 0.54 | 0.57 | 0.58 | 0.57 |
| Table 2 Average Technical, Pure Technical and Scale Efficiency |
|||||||||
| Technical Efficiency | Pure Technical Efficiency | Scale Efficiency | |||||||
| Year | Conventional | Islamic | All | Conventional | Islamic | All | Conventional | Islamic | All |
| 2008 | 0.98 | 0.57 | 0.87 | 1.00 | 0.88 | 0.97 | 0.99 | 0.62 | 0.89 |
| 2009 | 0.97 | 0.79 | 0.92 | 0.99 | 0.86 | 0.95 | 0.98 | 0.90 | 0.96 |
| 2010 | 0.88 | 0.69 | 0.83 | 0.95 | 0.92 | 0.94 | 0.93 | 0.73 | 0.88 |
| 2011 | 0.68 | 0.64 | 0.67 | 0.86 | 0.91 | 0.87 | 0.79 | 0.68 | 0.76 |
| 2012 | 0.53 | 0.58 | 0.54 | 0.78 | 0.90 | 0.81 | 0.69 | 0.62 | 0.67 |
| 2013 | 0.53 | 0.56 | 0.54 | 0.78 | 0.90 | 0.81 | 0.70 | 0.61 | 0.67 |
| 2014 | 0.53 | 0.68 | 0.57 | 0.80 | 0.88 | 0.82 | 0.68 | 0.74 | 0.69 |
| 2015 | 0.55 | 0.67 | 0.58 | 0.82 | 0.89 | 0.84 | 0.67 | 0.71 | 0.68 |
| 2016 | 0.56 | 0.61 | 0.57 | 0.77 | 0.89 | 0.80 | 0.73 | 0.66 | 0.72 |
It shows that there is a great scope for the inefficient companies to increase their output if they will operate at the same effective level of the most efficient company in the sample of the study. On average, the best practice company is State Life Insurance Company whereas premier insurance is least efficient. However, on the other hand, average technical efficiency scores of takaful operators in Pakistan range from 56% (2013) to 79% (2009).
It is interesting to note that the average technical efficiency scores of the takaful operators are increasing since 2009, then decreasing till 2003 and then increased to 57%. It shows on average there is instability in the technical efficiency of these operators. It may be due to the infancy stage of these operators or may be due to the internal and external shocks and still, these operators are not immune with the system and have not too much resilience power and could not able to absorb these shocks. Two companies, Dawood Takaful and Pak-Qatar (Family) were most efficient among the takaful operators. However, on average all, the conventional and Islamic insurance operators are producing under the production frontier and could not able to get the optimal level.
Table 2 presents the combined average efficiencies of the industry. If we will compare the average technical efficiency and average pure technical efficiency of all the operators, it is observed that average pure technical efficiency is improved during the study period. During all the years (2008-2106) the average pure technical efficiency is higher than the average technical efficiency, it shows that the managerial efficiency of the industry has been improved and the phenomenon of learning by doing works very well (Figure 2).
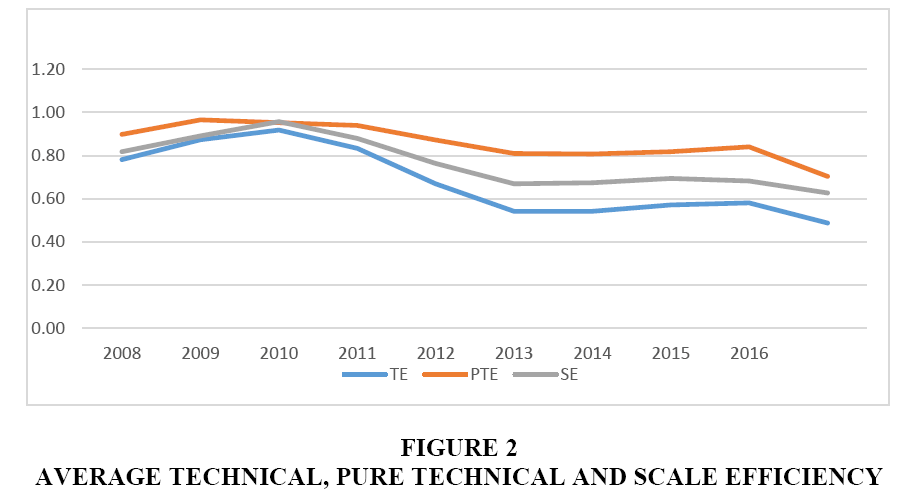
Figure 2: Average Technical, Pure Technical and Scale Efficiency
If we will see the conventional companies, then we can observe that average pure efficiency in 2008 was 100%, which implies that all the conventional insurance companies are able to attain pure efficiency during this year and decline with the passage of time and it reached to 77% in 2016. The pure technical efficiency of the takaful operators was 89% in 2016. Which shows that the takaful operator was performing well as pure efficiency is a concern in 2016 from their counterpart. It is may be due to the dedication and their religious orientation of the managers of takaful companies.
Average scale efficiency for all the operators (conventional and Islamic) is also not stable in the understudy period. It varied from 67% to 99% for conventional. For takaful operators, the scale efficiency was 90% in 2009 and declined to 66% in 2016. Average of pure technical efficiency is greater than the average of scale efficiency in the sample period. The inefficiency of all the insurance companies is more due to scale inefficiency than pure technical efficiency. Whereas, takaful operators are also inefficient due to scale inefficiency. Because of a number of issues like lack of liquidity, lack of optimal level of capital, could not able to fulfil the requirement of new technology and IT, less growth in providing the online services, etc. Takaful operators are also in their infancy stage which is also a major constraint in obtaining the scale efficiency.
Conclusion
The current study examined the technical efficiency, of the Islamic (Takaful) and conventional insurance industry of Pakistan applying the Data Envelopment Analysis. For the further analysis, the study tests the pure technical efficiency and scale efficiency for the examination of managerial inefficiency or the wrong choice of the firm about its scale of operation. It is observed from the estimated scores that managerial efficiency is higher than the technical efficiency. It means that takaful companies are technically inefficient and this inefficiency is due to the scale inefficiency. One can conclude that scale of operation of the takaful operators in Pakistan is not correctly selected. It is also noted that takaful companies are working under an increasing return to scale which implies that still there is scope for the takaful operators to increase this production and able to get the optimal scale of operation. This study suggests to the takaful companies in Pakistan should review their scale of operation and in this way the operators will be able to get their optimum scale of operation and also able to increase their pure technical efficiency.
References
- Abduh, M., Omar, M. & Tarmizi, R. (2012). Measuring the performance of insurance industry in Malaysia: Islamic vis-à-vis conventional insurance. Journal of Islamic Banking and Finance, 40-49.
- Al-Amri, K. (2015). Takaful insurance efficiency in the GCC countries. Humanomics, 31(3), 344-353.
- Alhassan, A.L. & Biekpe, N. (2015). Efficiency, productivity and returns to scale economies in the non-life insurance market in South Africa. The Geneva Papers on Risk and Insurance Issues and Practice, 40(3), 493-515.
- Annual Islamic Financial Services Industry Stability Report (2017). Islamic Financial Services Board. http://www.ifsb.org/docs/IFSB%20IFSI%20Stability%20Report%202017.pdf
- Azhar, R.S. & Afandi, A.B.M. (2003). Performance of Islamic and mainstream banks in Malaysia. International Journal of Social Economics, 30(12), 1249-1265.
- Banker, R.D., Charnes, A. & Cooper, W.W. (1984). Some models for estimating technical and scale inefficiencies in data envelopment analysis. Management science, 30(9), 1078-1092.
- Barros, C.P. & Mascarenhas, M.J. (2005). Technical and allocative efficiency in a chain of small hotels. International Journal of Hospitality Management, 24(3), 415-436.
- Barros, C.P. & Wanke, P. (2014). Insurance companies in Mozambique: A two-stage DEA and neural networks on efficiency and capacity slacks. Applied Economics, 46(29), 3591-3600.
- Bauer, P.W., Berger, A.N., Ferrier, G.D. & Humphrey, D.B. (1998). Consistency conditions for regulatory analysis of financial institutions: A comparison of frontier efficiency methods. Journal of Economics and business, 50(2), 85-114.
- Beck, T., Demirgüç-Kunt, A. & Levine, R. (2010). Financial institutions and markets across countries and over time: The updated financial development and structure database. The World Bank Economic Review, 24(1), 77-92.
- Berger, A.N. & Humphrey, D.B. (1997). Efficiency of financial institutions: International survey and directions for future research. European Journal of Operational Research, 98(2), 175-212.
- Berger, A.N., Hunter, W.C. & Timme, S.G. (1993). The efficiency of financial institutions: A review and preview of research past, present and future. Journal of Banking & Finance, 17(2-3), 221-249.
- Biener, C., Eling, M. & Wirfs, J.H. (2016). The determinants of efficiency and productivity in the Swiss insurance industry. European Journal of Operational Research, 248(2), 703-714.
- Chan, S.G. (2008). Bank efficiency in selected developing countries. Universiti Utara Malaysia.
- Chapra, M.U. (2008). Innovation and authenticity in Islamic finance. Paper presented at the Eight Harvard Conference in Islamic Finance, Massachusetts.
- Chapra, M.U. (2011). The global financial crisis: Can Islamic finance help? Islamic Economics and Finance, 135-142.
- Charnes, A., Cooper, W.W. & Rhodes, E. (1978). Measuring the efficiency of decision making units. European Journal of Operational Research, 2(6), 429-444.
- Coelli, T. (1996). A guide to DEAP version 2.1: A data envelopment analysis (computer) program. Centre for Efficiency and Productivity Analysis, University of New England, Australia.
- Coelli, T.J., Rao, D.P., O’Donnell, C.J. & Battese, G.E. (1998). An introduction to productivity and efficiency analysis. Springer Science: New York.
- Cummins, D. & Rubio, M.M. (2001). Deregulation, consolidation and efficiency: Evidence from the Spanish insurance industry. Working Paper Series, The Wharton School, University of Pennsylvania.
- Cummins, J.D. & Turchetti, G. (1996). Productivity and technical efficiency in the Italian insurance industry: Wharton School Center for Financial Institutions, University of Pennsylvania.
- Cummins, J.D. & VanDerhei, J. (1979). A note on the relative efficiency of property-liability insurance distribution systems. Foundations of Insurance Economics, 521-531.
- Cummins, J.D., Weiss, M.A., Xie, X. & Zi, H. (2010). Economies of scope in financial services: A DEA efficiency analysis of the US insurance industry. Journal of Banking & Finance, 34(7), 1525-1539.
- Cummins, J.D. & Xie, X. (2013). Efficiency, productivity and scale economies in the US property-liability insurance industry. Journal of Productivity Analysis, 39(2), 141-164.
- El-Gamal, M. & Inanoglu, H. (2004). Islamic banking in Turkey: Boon or bane for the financial sector. Paper presented at the Proceedings of the Fifth Harvard University Forum on Islamic Finance.
- El?Gamal, M.A. & Inanoglu, H. (2005). Inefficiency and heterogeneity in Turkish banking: 1990-2000. Journal of Applied Econometrics, 20(5), 641-664.
- El Moussawi, C. & Obeid, H. (2011). Evaluating the productive efficiency of Islamic banking in GCC: A non-parametric approach. International Management Review, 7(1), 10.
- Farrell, M.J. (1957). The measurement of productive efficiency. Journal of the Royal Statistical Society, 120(3), 253-290.
- Faruk, O. & Rahaman, A. (2015). Measuring efficiency of conventional life insurance companies in Bangladesh and takaful life insurance companies in Malaysia: A non-parametric approach. Management Studies and Economic Systems, 2(2), 129-144.
- Fecher, F., Kessler, D., Perelman, S. & Pestieau, P. (1993). Productive performance of the French insurance industry. Journal of Productivity Analysis, 4(1-2), 77-93.
- Gardner, L.A. & Grace, M.F. (1993). X-efficiency in the US life insurance industry. Journal of Banking & Finance, 17(2), 497-510.
- Harrington, S.E. (2009). The financial crisis, systemic risk and the future of insurance regulation. Journal of Risk and Insurance, 76(4), 785-819.
- Hu, X., Zhang, C., Hu, J.L. & Zhu, N. (2009). Analyzing efficiency in the Chinese life insurance industry. Management Research News, 32(10), 905-920.
- Huang, W. & Eling, M. (2013). An efficiency comparison of the non-life insurance industry in the BRIC countries. European Journal of Operational Research, 226(3), 577-591.
- Ismail, N., Alhabshi, D.S.O. & Bacha, O. (2011). Organizational form and efficiency: The Coexistence of family takaful and life insurance in Malaysia. Journal of Global Business and Economics, 3(1), 122-137.
- Jaiyeoba, H.B. & Haron, R. (2015). Technical efficiency of Nigerian insurance companies: A data envelopment analysis and patent growth curve modelling approach. International Journal of Data Envelopment Analysis, 3(2), 659-677.
- Janjua, P.Z. & Akmal, M. (2015). A comparative analysis of economic efficiency of conventional and Islamic insurance industry in Pakistan. Pakistan Business Review, 17(1), 21-44.
- Kader, H.A., Adams, M. & Hardwick, P. (2010). The cost efficiency of Takaful insurance companies. The Geneva Papers on Risk and Insurance Issues and Practice, 35(1), 161-181.
- Kasman, A. & Turgutlu, E. (2011). Performance of European insurance firms in the single insurance market. International Review of Applied Economics, 25(3), 363-378.
- Khan, A. (2016). Islamic insurance: Evolution, models and issues. Policy Perspectives: The Journal of the Institute of Policy Studies, 13(2), 29-61.
- Kounetas, K. & Tsekouras, K. (2007). Measuring scale efficiency change using a translog distance function. International Journal of Business and Economics, 6(1), 63.
- Malik, M.S. Malik, A. & Faridi, M.Z. (2011). An analysis of e-insurance practices in Pakistan: Current status and future strategies: The case of a state owned Pakistani company. International Journal of Business and Management, 6(2), 125.
- Md Saad, N. (2012). An analysis on the efficiency of takaful and insurance companies in malaysia: A non-parametric approach. Review of Integrative Business & Economics Research, 1(1), 33-56.
- Miniaoui, H. & Chaibi, A. (2014). Technical efficiency of takaful industry: A comparative study of Malaysia and GCC countries.
- Noulas, A.G., Lazaridis, J., Hatzigayios, T. & Lyroudi, K. (2001). Non-parametric production frontier approach to the study of efficiency of non-life insurance companies in Greece. Journal of Financial Management & Analysis, 14(1), 19.
- Qureshi, A.A. (2011). Analyzing the Sharia'ah compliant issues currently faced by Islamic insurance. Interdisciplinary Journal of Contemporary Research in Business, 3(5), 279-295.
- Rahman, M.A. (2015). Comparative study on the efficiency of Bangladeshi conventional and Islamic life insurance industry: A non-parametric approach. Asian Business Review, 3(4), 88-99.
- Rai, A. (1996). Cost efficiency of international insurance firms. Journal of Financial Services Research, 10(3), 213-233.
- Rejda, G.E. (2011). Principles of risk management and insurance: Pearson Education India. https://www.bookdepository.com/Principles-Risk-Management-Insurance.../97881317
- Securities and Exchange Commission of Pakistan. (2016). https://www.secp.gov.pk/media-center/annual-reports/, Anual Report 2016, 35-40.
- Seelanatha, S. (2007). Efficiency, productivity, change and market structure of the banking industry in Sri Lanka. Univeristy of Southren Queensland.
- Singh, A. & Zahran, Z. (2013). A comparison of the efficiency of Islamic and conventional insurers. Towers Watson Technical Paper No. 2100531.
- State Bank of Pakistan. (2005). Developments in the insurance sector. Pakistan Financial Sector Assessment 2005, 105-111.
- Sufian, F. & Chong, R.R. (2008). Determinants of bank profitability in a developing economy: Empirical evidence from the Philippines. Asian Academy of Management Journal of Accounting & Finance, 4(2).
- Ul Haque, N. & Mirakhor, A. (1986). Optimal profit-sharing contracts and investment in an interest-free Islamic economy.
- Zimková, E. (2015). Technical efficiency and super-efficiency of the insurance sector in Slovakia. Acta Universitatis Agriculturae et Silviculturae Mendelianae Brunensis, 63(6), 2205-2211.