Research Article: 2018 Vol: 22 Issue: 2
Technological Capital and Firm Financial Performance: Quantitative Investigation On Intellectual Capital Efficiency Coefficient
Abdulsattar Abdulbaqi Alazzawi, University of Bahrain
Makarand Upadhyaya, University of Bahrain
Hatem Mohamed EL-Shishini, University of Bahrain
Muwafaq Alkubaisi, University of Bahrain
Keywords
Intellectual Capital, Technological Capital, Regression Analysis, Analysis of Variance, Sample, firm Financial Performance.
Introduction
With the development of knowledge economy, the influence of intellectual capital on firm financial performance is more and more important. Generally, the firms do business and develop needing intellectual capital and knowledge innovation ability. Pulic (2000) put forward that VAICTM (Value Added Intellectual Coefficient) depended on calculating a financial index to intellectual capital components, finding the relationship between the intellectual capital and firms value. Most researchers analysed the impact of the intellectual capital on firm financial performance, but few of them analysed the impact of the R&D and knowledge rights on firm financial performance from the intellectual capital. This paper using the model of VAICTM and the demonstration example of the IT listed companies in BSE Ltd. (Bombay Stock Exchange), analyses the influence of the technological capital of the R&D fee and knowledge rights on firm financial performance from the intellectual capital.
Review
Intellectual Capital and Material Capital
Barney (1991) proposed that intellectual capital and material capital is the resources of the firms to create wealth and get an outstanding achievement. Intellectual capital is invisiblem, scarcity, irreplaceable. It is the resource of the firms to keep and improve their competitive advantage. Edvinsson & Malone (1997) put forward that intellectual capital was made up by human capital, innovating capital, process capital and customer capital. Pulic (2000 & 2004) gave an opinion that value-added intellectual coefficient (VAIC) included intellectual capital coefficient, structural capital coefficient and capital employed coefficient.
Intellectual Capital and Firm Financial Performance
Many researchers carried on the demonstration analysis of the intellectual capital and firm financial performance. Firstly, Bontis (1998) using principal component analysis and partial least squares given the point that intellectual capital could remarkably influence financial performance. Steven & Williams (2003) made demonstration analysis to find that human capital could not directly have effects on firm financial performance, but customer capital and structural capital can strongly influence on firm financial performance. Indian researchers firstly found out whether intellectual capital could make remarkably effect on firm financial performance in general. For example, Lia & Li (2004) applied correlation analysis and multiple stepwise regression methods by the sample of Indian IT listed companies to conclude that human capital could not directly have effects on firm financial performance, but structural capital could strongly influence on firm financial performance. Chen et al. (2004) designed intellectual capital evaluating model and index system by the sample from questionnaire investigation of high-tech enterprises in Thane (Mumbai), finding that it is a significant correlation relationship on intellectual capital and firm financial performance. Lately some researchers made an improvement on the intellectual capital independent variable; dependent variable and research methods. Fu (2007) integrated 24 variables of firm performance from factor analysis method by the research sample of Indian IT listed companies. He concluded by quintile regression that intellectual capital can strongly affect firm performance, but this effect became weaker and weaker by the growing achievement. He found that structure capital can make a positive function on good comprehensive performance firm, material capital can positively affect firm financial performance, but this effect became weaker and weaker by the growing achievement. Liu & Zhao (2013) using 15 index and principal component analysis, evaluated the value of firm intellectual capital. He found that intellectual capital could make a more positive effect on firm capital than material capital, but the market could not fully recognize this function.
Many papers mentioned the relationship of intellectual capital and firms focusing on the effect of firm overall performance, few papers focusing on specific performance. Yan & Ning (2008) discussed the relationship of financial capital and intellectual capital in the sample of firms in Mumbai, Thane and other areas. He concluded that financial capital was more important than intellectual capital by building 4 four nested models through the structured equation. Jiang & Wang (2009) argued the hypothetical model of the intellectual capital, organizational learning and enterprise innovation performance relationship by questionnaire investigating 78 firms and 555 staffs in Thane area. Very few researchers focus on analysing the influence of the firm’s financial performance and financing capacity.
Technological Capital and Financial Performance
Commonly technological capital has a significant effect on firm’s financial performance. More technology input can improve company products service performance to get higher profit. Cohen & Levinthal (1990) had a view that some company’s better understanding technology usually had stronger ability to get the newest knowledge and better human capital. Bollen et al. (2005) that intellectual property right could make a remarkable influence on firm performance, that indirectly influencing firm performance as a mediator variable. James researched in the area the effect of the intellectual property right to firms financing behaviour. He found that firms paid more attention to the intellectual property right to get more new loan and sell more product that was a benefit for the whole economy prosperous development. Technological capital was very important to the company, so the influence of the technology could not be ignored in intellectual capital value system. But few of researches existed about intellectual capital and firm financial performance talked about the influence of the intellectual capital of technological capital, that this paper is devoted to adding this direction researches.
In view of the papers existed analysis, this paper carries out to find the effect of VAICTM adding technological capital and the function of the technological capital to the firm financial performance. Based on this, this paper proposes 4 hypotheses in following:
Hypothesis 1: Human capital can make positive effect in firm financial performance;
Hypothesis 2: Structure capital can make positive effect in firm financial performance;
Hypothesis 3: Capital employed can make positive effect in firm financial performance;
Hypothesis 4: Technology capital can make positive effect that is indirect in firm financial performance.
Research Design
Sample Selecting and Data Sources
This paper selects the IT companies listed in 2011-2015 in Mumbai and BSE Ltd. (Bombay Stock Exchange) stock exchange as the research sample. Related data comes from reputed company annual reports. The industry is classified as ABC IT assortment, including ABC software and services (Internet software and services, information technology service, software), ABC technical hardware and equipment (communication equipment, computers and peripherals, electronic equipment, instruments and components, office electronic equipment), ABC semiconductor and semiconductor manufacturing equipment. To keep the data effectiveness, according to Steven related research, the companies which have negative HC and SC, the observed value in year labelled ST and observation point missing related variables should be get rid of. It can be concluded that there are 241 company samples; observed value in a year is obtained from closing price in 12.33 per year. Finally, there is 1189 statistical sample information.
Variable Selecting and Calculation
This paper draws lessons from the method of Pulic (2000) intelligence increment coefficient. This method comes from standard value-added efficiency measurement of firms’ internal capital and individual capital, which can easily calculate some related variables. This method also can be used widely in some related empirical research.
Dependent Variable Selected
This paper selects four dependent variables to measure firm financial performance. These four dependent variables are earnings per share growth (GEPS), gross profit margin (PM), Return on assets (ROA), Return on equity (ROE). Among these variable, GEPS can weigh the firm's profitability, PM can measure the firm professional ability, ROA and ROE can judge the ability of the return and operation of firms invested funds. Dependent variable calculating expressions following in Table 1.
| Table 1: Dependent Variable Calculating Expression | |
| Index variable | Original calculation formula |
|---|---|
| Earnings per share growth (GEPS) | (Earnings per share for the current period?Earnings per share)/Earnings per share*100% |
| Gross profit margin(PM) | Net profit from selling goods/Main business income *100% |
| Return on assets(ROA) | Earnings before interest and tax*2(initial total assets + final total assets*100% |
| Return on equity(ROE) | Net profit/Average stockholders' equity *100% |
Independent Variable Selecting
According to Pulic (2000 & 2004) proposing VAIC frame, human capital efficiency (HCE), structure capital efficiency (SCE) and capital employed efficiency. Intellectual capital is closely related to the firm's value added. View of the firms financing, value added (VA) is equal to
VA=OUT-IN=OP+EC+D+A
Value Added (VA) = Intellectual Capital (IC); Total Sales (OUT); Purchase Cost (IN); Operating Profit (OP); Employment Cost (EC); Depreciation (D); Amortization (A); Human capital (HC), Structure (SC), Capital employed (CE), Technological capital (TC) can be calculated as the following expression?
Human Capital(HC)=LExp.
Structural Capital(SC)=intellectual capital(IC)-Human Capital(HC)=VA-HC
Capital Employed(CE) = Book Value of Net Assets
Technological Capital =R&Dexpd+VIR
R&Dexpd is research and creation fee; VIR is the value of intellectual property right. According to Pulic (2000) calculated expression:
HCE=VA/HC
Efficiency coefficient of human capital (HCE) measures the efficiency of human capital in value added
SCE=SC/VA
Efficiency coefficient of structural capital (SCE) measures the efficiency of structural capital in value added.
Pulic proposed that there is inverse relationship between HCE and SCE. This higher of the efficiency coefficient of human capital, the low of the efficiency coefficient of the structure.
CEE=VA/CE
Efficiency coefficient of capital employed (CEE) measures the efficiency of capital employed in value added. Capital employed (CE) is equal to firms’ net asset book value:
TCE=TC/Book Value of the Common Stock
Efficiency coefficient of technological capital (TCE) measures the efficiency of firms’ technological capital.
Research Method and Model
We assumed that TCE as moderator variable has indirect effects on firms financial performance. When the relationship between variable Y and variable X is the function of variable M, M is moderator variable that variable M can influence variable Y and variable X. We can use hierarchical multiple regression models to examine the moderating effect. Long (2004) thinks the hierarchical partition of hierarchical regression can be divided by the relationship among the variables. The more fundamental effect exits in the independent variable, the higher hierarchical level is gotten. A high-level independent variable can make an effect on a low-level independent variable in the statistical analysis. Independent variable can be joined into the regression equation by the order gradually from high level to low level. So in this paper regression model, the first step is that the forecast of the dependent variable effect is to add the independent variable including moderator variable in the model. The independent variable in the first step is HCE, SCE, CEE and TCE. The second step is that TCE and other independent variable interaction term are added in the model if the effect is remarkable between interaction term and explained variable, so the adjuration is exited. The specific hierarchical relation following by Table 2.
| Table 2: Hierarchical Regression Model Of The Variables |
| Step 1 |
 |
| Step 2 |
 |
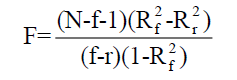
The examination of the interaction term R2 is used by F examination:
Empirical Results And Analysis
Descriptive Statistics and Correlation Analysis
The descriptive analysis of independent variable and dependent variable is presented in Table 3. From Table 3, we can find the average value of 3 independent variable HCE, SCE and CEE. Among these 3 independent variable, the average value of HCE is highest up to 1.117. It means that to the sample of selected firms human capital is more effective than structure capital and relational capital, firms intellectual capital can create more effective value than capital employed, human capital is the most important resource of value added. The average value of TCE to measure firms research and the intellectual right is low down to 0.0071. That means the selected sample of the technological capital IT listed companies in India. Among the dependent variable, the average value of PM is up to 39.1231. It means the gross profit margin is so high that he average enterprise income is very considerable.
| Table 3: Descriptive Analysis Of Variables | |||||
| Mean | Std. Deviation | Var. | Skewness | Kurtosis | |
|---|---|---|---|---|---|
| HCE | 1.127 | 0.13525 | 0.013 | 5.289 | 55.452 |
| SCE | 0.0938 | 0.07269 | 0.004 | 2.023 | 7.144 |
| CEE | 0.206 | 0.56617 | 0.318 | 22.581 | 632.989 |
| TCE | 0.0071 | 0.01063 | 0 | 16.6456 | 407.731 |
| GEPS | 11.6515 | 48.07924 | 2321.901 | 1.498 | 6.31 |
| PM | 39.1297 | 18.86792 | 358.094 | 0.853 | 0.46 |
| ROA | 8.5362 | 6.69014 | 45.031 | 2.29 | 10.215 |
| ROE | 12.0573 | 9.42122 | 88.787 | 2.359 | 10.794 |
Hierarchical Regression Model
We should select the mean-value or standard the forecast variable and adjusting variable. So we should decentralize HCE, SCE, CEE, TCE and regress twice in the order of hierarchy analysis. The result of hierarchy analysis is presented in Tables 5, 6, 7 & 8 respectively.
Table 4 shows the correlation analysis among the variables using the Person Correlation method to examine the significance in 2 tailed. According to Table 4, the efficiency coefficient of HCE and explained variable GERS, PM, ROA, ROE is relevant in 99% significance level. The correlation coefficients are 0.186, 0.133, 0.571 & 0.517 respectively. The efficiency coefficient of SCE is relevant to the explained variable GEPS, PM, ROA, ROE in significance level P<0.01.The correlation coefficients are 0.224, 0.161, 0.591 and 0.539 respectively. The efficiency coefficient of TCE and explained variable PM, ROE is relevant in significance level P<0.05. The correlation coefficient is -0.61, 0.064 respectively. TCE added in VAICTM is related to RM, ROE in the significance level P<0.01.The correlation coefficients are 0.123, 0119 respectively. TCE is relevant to ROA in the significance level P<0.05. The correlation coefficient is 0.074.
| Table 4: The Correlation Analysis Of Variable | |||||||||
| Variable | CE | SCE | CEE | TCE | GEPS | M | ROA | ROE | |
|---|---|---|---|---|---|---|---|---|---|
| HCE | Person Correl. | 1 | 00.953** | -0.121** | -00.0076** | 00.186** | 00.133** | 00.571** | 00.517** |
| Sig. (2-tailed) | ? | 0 | 0 | 0 | 0 | 0 | 0 | 0 | |
| SCE | Person Correl. | 00.953** | 1 | -0.154** | -0.091** | 00.224** | 00.161** | 00.591** | 00.539** |
| Sig. (2-tailed) | 0 | ? | 0 | 0.002 | 0 | 0 | 0 | 0 | |
| CEE | Person Correl | -0.121** | -0.154** | 1 | 00.169** | -0.034 | -0.061* | 0.01 | 00.064* |
| Sig. (2-tailed) | 0 | 0 | ? | 0 | 0.235 | 0.036 | 0.722 | 0.027 | |
| TCE | Person Correl | 0-0.076** | -0.091** | 0.169** | 1 | 0.02 | 0.123** | 0.074* | 0.119** |
| Sig. (2-tailed) | 0.008 | 0.002 | 0 | ? | 0.482 | 0 | 0.01 | 0 | |
| GEPS | Person Correl | 0.186** | 0.224** | -0.034 | 0.02 | 1 | 0.042 | 0.254** | 0.296** |
| Sig. (2-tailed) | 0 | 0 | 0.235 | 0.482 | ? | 0.147 | 0 | 0 | |
| PM | Person Correl | 00.133** | 0.161** | -0.061* | 0.123** | 0.042 | 1 | 0.415** | 0.275** |
| Sig. (2-tailed) | 0 | 0 | 0.036 | 0 | 0.147 | 0 | 0 | ||
| ROA | Person Correl | 00.571** | 0.591** | 0.01 | 0.074* | 0.254** | 0.415** | 1 | 0.922** |
| Sig. (2-tailed) | 0 | 0 | 0.722 | 0.01 | 0 | 0 | 0 | ||
| ROE | Person Correl | 00.517** | 0.539** | 0.064* | 0.119** | 0.296** | 0.275** | 0.922** | 1 |
| Sig. (2-tailed) | 0 | 0 | 0.027 | 0 | 0 | 0 | 0 | ||
Note: ** and * Correlation is significant at the 0.01 and 0.05 level (2-tailed).
Table 5 presents the indirect influence between TCE and firms earnings per share growth (GEPS). In step 1, the regression equations of dependent variable GEPS and independent variable HCE, SCE, CEE, TCE are all significant in statistics R2=0.060, F=18.838, P<0.001). HCE, SCE, CEE, TCE can explain firms financial performance at 6% explanation level. HCE and SCE make a significant effect on GEPS β=-0.297, P<0.001 and β=0.511, P<0.001), but CEE and TCE have a weak significant effect on GEPS. In step 2, the equation adding TCE still has remarkable statistical significance (R2=0.068, F=12.271, P<0.001). The standardized coefficient of interaction term HCE*TCE, SCE*TCE, CEE*TCE is 0.818, -0.831, -0.001 respectively. Only CEE*TCE is weak significant to GEPS. HCE*TCE and SCE*TCE both have a remarkable impact on GEPS. In step 2 equation, predictive variable and moderator variable can explain at 6.8% to the dependent variable. The level of the explanation in step 2 is higher than step 1. It means the moderating effect of TCE and intellectual capital have an impact on firms GEPS.
| Table 5: Summary Of Hierarchical Regression Analysis For Tce Predicting Ic EFFECTIVENESS | |||||||||
| Step and variable | B | SE B | Beta | T | Sig. | R2 | Adjust R2 | F | |
|---|---|---|---|---|---|---|---|---|---|
| HCE | -114.247 | 35.804 | -0.297*** | -3.191 | 0.001 | 0.06 | 0.057 | 18.838*** | |
| Step 1 | SCE | 328.986 | 60.305 | 0.511*** | 5.455 | 0 | |||
| CEE | 0.061 | 2.504 | 0.001 | 0.024 | 0.98 | ||||
| TCE | 200.768 | 130.77 | 0.044 | 1.535 | 0.125 | ||||
| HCE*TCE | 46 420.037 | 14 664.153 | 0.818** | 3.166 | 0.002 | 0.068 | 0.062 | 12.271*** | |
Note: Dependent variable is GEPS; 2. ***, **,* are P<0.01, P<0.05, P<0.1 respectively.
Table 6 explained variables are gross profit margin that shows the influence of TCE to firm gross margin. From the first regression result, the first regression equation in statistics is significant (R2=0.053, F=16.701, P<0.001). Independent variable HCE, SCE, CEE, TCE can explain dependent variable PM at 5.3% explanation ability. All these 4 independent variables have a remarkable impact on PM, but only CEE is significant at P<0.1 while HCE, SCE and TCE are both significant at P<0.01.CEE make a weak significant effect on firm gross profit. From the second regression result, the equation adding TCE as moderator variable is still remarkable in statistics (R2=0.093, F=17.269, P<0.001). In the second regression equation, predictive variable and moderator variable can explain at 9.3% to dependent variable. The level of the explanation in step 2 is higher than step 1. It means the moderating effect of TCE has impact on intellectual capital. The coefficient of 3 interaction term is remarkable, PM is affected by SCE*TCE and CEE*TCE oppositely at P<0.01 while HCE*TCE positively P<0.1.
| Table 6: Summary Of Hierarchical Regression Analysis For Tce Predicting Ic Effectiveness | |||||||||
| Step and variable | B | E B | eta | T | ig. | 2 | Adjust R2 | F | |
|---|---|---|---|---|---|---|---|---|---|
| HCE | -34.567 | 14.157 | -0.228** | -2.442 | 0.015 | 0.053 | 0.05 | 16.701*** | |
| Step 1 | SCE | 97.469 | 23.846 | 0.384*** | 4.088 | 0 | |||
| CEE | -1.862 | 0.99 | -0.055* | -1.88 | 0.06 | ||||
| TCE | 268.865 | 51.708 | 0.149*** | 5.2 | 0 | ||||
| HCE*TCE | 9 998.910 | 5 700.792 | 0.447* | 1.754 | 0.08 | 0.093 | 0.087 | 17.269*** | |
| Step 2 | SCE*TCE | -20 249.294 | 7 445.279 | -0.718*** | -2.72 | 0.007 | |||
| CEE*TCE | -294.13 | 60.866 | -0.168*** | -4.833 | 0 | ||||
Table 7 shows the result that TCE as moderator variable has an effect on firms ROA. In step one regression, the regression equation is remarkable in whole (R2=0.373, F=175.947, P<0.001). Only HCE in 4 independent variable makes a weak remarkable influence on ROA, the other independent variables SCE, CEE, TCE have a remarkable effect on ROA, the coefficients are β=0.565, P<0.001, β=0.084, P<0.001, β=0.115, P<0.001 respectively. We can find that the coefficients are positive that means these three variables have a positive impact on ROA. In step 2 regression, the regression equation is still remarkable in whole (R2=0.403, F=113.882, P<0.001). In the first regression, the independent variables can explain the dependent variables up to 37.3%. While in the second regression equations the ability to explain the independent variables on dependent variables has grown up to 40.3%. It means that the moderating effect on TCE to HCE, SCE and CEE has a remarkable impact on dependent ROA. In the second regression, HCE*TCE and SCE*TCE make a significant influence on ROA in P<0.01 level, while CEE*TCE can only make a weaker effect on ROA in P<0.1 level.
| Table 7: Summary Of Hierarchical Regression Analysis For Tce Predicting Ic Effectiveness | |||||||||
| Step and variable | B | SE B | Beta | T | Sig. | R2 | Adjust R2 | F | |
|---|---|---|---|---|---|---|---|---|---|
| HCE | 2.771 | 4.082 | 0.052 | 0.679 | 0.497 | 0.373 | 0.37 | 175.947*** | |
| Step 1 | SCE | 50.746 | 6.875 | 0.565*** | 7.382 | 0 | |||
| CEE | 1.011 | 0.285 | 0.084*** | 3.542 | 0 | ||||
| TCE | 73.404 | 14.908 | 0.115*** | 4.924 | 0 | ||||
| HCE*TCE | 12 524.834 | 1 637.963 | 1.582*** | 7.647 | 0 | 0.403 | 0.399 | 113.882*** | |
| Step 2 | SCE*TCE | -16 461.438 | 2 139.193 | -1.648*** | -7.695 | 0 | |||
| CEE*TCE | -30.308 | 17.488 | -0.049* | -1.733 | 0.083 | ||||
In Table 8 we can see the indirect effect on TCE to firms ROE. In Table 8, the equation in steps 1 and 2 has remarkable influence that has statistical significance. In step 1 regression, we can have the result that R2=0.334, F=148.841, P<0.001. In step 2 regression, we can find that R2=0.380, F=103.679, P<0.001. In whole, HCE, SCE, CEE, TCE can explain the effect on ROA up to 33.4%; while in step 2 regression equations adding moderating effect, the explanation can reach to 38%. In step 1, only HCE variable cannot make a valid effect on ROA, the rest SCE, CEE, TCE can make a positive effect on ROA in P<0.01 remarkable level. In step 2, interaction term HCE*TCE and SCE*TCE can make a remarkable effect on ROA in P<0.01 level, while CEE*TCE have a weak impact on ROA.
| Table 8: Summary Of Hierarchical Regression Analysis For Tce Predicting Ic Effectiveness | |||||||||
| Step and variable | B | SE B | Beta | T | Sig. | R2 | Adjust R2 | F | |
|---|---|---|---|---|---|---|---|---|---|
| HCE | -1.008 | 5.904 | -0.013 | -0.171 | 0.865 | 0.334 | 0.332 | 148.841*** | |
| Step 1 | SCE | 73.811 | 9.944 | 0.585*** | 7.423 | 0 | |||
| CEE | 2.154 | 0.413 | 0.127*** | 5.217 | 0 | ||||
| TCE | 133.572 | 21.563 | 0.149*** | 6.194 | 0 | ||||
| HCE*TCE | 21 543.870 | 2 342.899 | 1.938*** | 9.195 | 0 | 0.38 | 0.377 | 103.679*** | |
| Step 2 | SCE*TCE | -28 568.463 | 3 059.844 | -2.036*** | -9.337 | 0 | |||
| CEE*TCE | -27.469 | 25.014 | -0.031 | -1.098 | 0.272 | ||||
In conclusion, the efficiency coefficient of human capital (HCE) has a negative impact on firm’s earnings per share growth (GEPS) and gross profit margin (PM) but has no significant impact on ROA and ROE. The cash paid for the staffs which are the index selected for human capital is opposite relevant to the firm's cost and profits. So hypothesis 1 is not true. Hypothesis 2 is true that the efficiency coefficient of structure capital (SCE) has a positive influence on firms GEPS, PM, ROA, ROE. Hypothesis 3 is also true that the efficiency coefficient of capital employed (CEE) makes a positive effect on firm’s financial performance. In the second regression result, TCE can indirectly influence the firm financial from the efficiency coefficient of HCE, SCE, CEE. So technology capital can have a positive impact on firm financial performance and this effect is indirect. So hypothesis is true.
Conclusion And Expectation
In this paper, we supply the frame VAICITM put forward by Pulic (2000). (HCE, SCE, CEE) which adding TCE and analyse the effect on the firm financial performance by HCE, SCE, CEE, TCE adopting the hierarchical regression method. We can conclude that the impact on firms by human capital is indirect and weak significant, but structure capital, capital employed and technology capital is remarkable and positive to influence the firm’s financial performance. The impact on firm’s financial performance by TC through HC, SC, CE is adjusting. Technology capital indirectly makes an effect on firm financial performance. It means that higher quality human capital, better customer relationship and richer firm capital employed, more technological capital employed by firms to get more intellectual property right which can be more beneficial to firm financial performance to enhance competitiveness.
As for firms, the firm managers should pay more attention to intellectual capital than material capital because better intellectual capital can improve firm financial performance. Meanwhile, as for IT firms, the managers should increase the technology capital investment because the intellectual property and R&D investment can finally improve the firm financial performance. To raise the technological research level, we should improve the firm’s intellectual capital firstly. As for government, the government should encourage the firms to input more technological capital. The firms should enhance their own comprehensive strength first and then they can have extra capital to research. So the government should provide better public service to facilitate the firm which can get the resource that the firms need.
This paper exists several limitations as following. Firstly, the selected sample is Indian IT firms which can make the result restrictive. So the other researchers can select other industries and regions to research that maybe have limitation results. Secondly, the observation values come from second-hand data that may exist deviation. Thirdly, to analyse the firm financial performance, we selected 4 dependent variables which cannot totally show the firm performance. The other researchers can expand the selected dependent variable range, which can have a more solid conclusion.
References
- Barney, J.B. (1991). Firm resources and sustainable competitive advantage. Journal of Management, (17), 99-120.
- Bollen, L., Vergauwen, P. & Schnieders, S. (2005). Linking intellectual capital and intellectual property to company performance. Management Decision, 43(9), 1161-1185.
- Bontis, N. (1998). Intellectual capital: An exploratory study that develops measures and models. Management Decision, 36(2), 63-74.
- Bontis, N., Keow, W.C. & Richardson, S. (2000). Intellectual capital and business performance in Malaysian industries. Journal of Intellectual Capital, 1(1), 85-100.
- Chen, J., Xie, H. & Zhu, C. (2004). Measuring intellectual capital: A new model and empirical study. Journal of India University of Geosciences (Social Sciences Edition), 4(6), 27-31.
- Cohen, W.M. & Levinthal, D.A. (1990). Absorptive capacity: A new perspective on learning and innovation. Administrative Sciences Quarterly, 35(1), 39-67.
- Edvinsson, L. & Malone, M.S. (1997). Intellectual capital: Realizing your company true value by finding its hidden brainpower. New York: Harper Business Press.
- Fu, C. (2007). The effect of the intellectual capital on the competitive advantage of the enterprises-evidence from Indian IT listed company. Contemporary Finance & Economics, (4), 68-74.
- James, S., Yingmei, C. & Chaopeng, Wu. (2014). Does enforcement of intellectual property rights matter in India? Evidence from financing and investment choices in the high-tech industry. The Review of Economics and Statistics, 96(2), 332-348.
- Jiang, T. & Wang, J. (2009). Analysis on the relationships among intellectual capital, organizational learning and performance of enterprise innovation. Science Research Management, 30(4), 44-50.
- Lia, M. & Li, F. (2004). Empirical analysis of corporate intellectual capital and corporate performance. Journal of Chongqing University (Nature Science Edition), 27(12), 134-138.
- Liu, Y. & Zhao, X. (2013).The effectiveness study of intellectual capital in driving business value-creation-based on the comprehensive appraisal of intellectual capital. Journal of Central University of Finance & Economics, (1), 41-46.
- Long, L. (2004). The application of hierarchical regression method on social science. Educational Research and Experiment, (1), 51-56.
- Pulic, A. (2000). VAIC: An accounting tool for IC management. International Journal of Technology Management, 20(5), 702-714.
- Pulic, A. (2004). Intellectual capital: Does it create or destroy value? Measuring Business Excellence, 8(1), 62-68.
- Steven, F. & Williams, S.M. (2003). Intellectual capital and traditional measures of corporate performance. Journal of Intellectual Capital, 4(3), 348-360.
- Yan, J. & Ning, M. (2008). Financial capital and intellectual capital: Which one is more important for corporation's value creating. Accounting Research, (7), 49-55.