Research Article: 2019 Vol: 22 Issue: 1
Technostress Management through Data Mining
Mohamed Salah-Eddine, Hassan 1st University, Morocco
Mustapha Belaissaoui, Hassan 1st University, Morocco
Alae El Alami, Hassan 1st University, Morocco
karima Salah-Eddine, Mohammed V University, Morocco
Abstract
No one can deny that the arrival of the new computer era has brought with it many benefits and facilities to the human being, to such a point that if we want to justify it, we can give an endless list of examples, but like with many other things in life, there is also a dark side of computers. Employees and users who are confronted to an excessive use of Information and Communication Technologies (ICTs) of Information Systems (IS) in many aspects of their current life, are more prone to Technostress; a new type of stress that we will detect and assess through the use of Data Mining and we will classify patients by using some learning algorithms depending on to their type of stress, the data that we will use is resulting from a Technostress Survey that had already been performed, The use of artificial intelligence in the monitoring of mental health is a new approach in this field which we hope will be of help to both physicians and patients in the near future, making it easier for organizations to use the same diagnostic method but this time by making it computer-assisted, and making detection easier without the need for the physician presence at all times.
Keywords
Information and Communication Technologies, Information Systems, Computer Technology, Coping Strategies, Technostress, Data Mining, Artificial Intelligence.
Introduction
In this current work we are interested in one of the drawbacks of ICTs which is known as Technostress and which is a type of stress resulting of inappropriate use of ICTs by employees in organizations (Tarafdar et al., 2017; Ragu-Nathan et al., 2008), in our previous works (Salah-Eddine & Belaissaoui, 2016; Salah-Eddine, et al., 2018) we have discussed in detail the phenomenon of Technostress and its relation with the Coping Strategies and based on the existing literature on this subject, we have conceived a conceptual process for organizations to allow ICTs employees overcome Technostress, by reducing and/or eliminating its negative effects as a way to increase job satisfaction (Somvir, 2012) and all this by using ICTs themselves for the first time, in order to cut with the old methods used in the field of Technostress.
Before conceiving our conceptual process, we have noticed that the causality relationship between Technostress-Creators (TCs), which represents ICTs circumstances that have the potential to create job-related strain outcomes among employees in organizations (Tarafdar et al., 2017; William & Cooper, 2002) and between Technostress which is the consequence of TCs associated with the repeated use of the Coping Strategies (Lazarus, 1966; Lazarus & Folkman, 1984) that health specialists use to face Technostress, have given us a quick overview of what we can develop from the relation between these three components, as shown in Figure 1. In Salah-Eddine & Belaissaoui (2016) we have simply begun by gathering the parts of Technostress, Coping Strategies and job satisfaction in a hierarchical way to facilitate the understanding of the whole phenomenon of Technostress from the moment it is detected to the moment it is cured.

Figure 1:The Summarized Conceptual Model.
Background
This summarized conceptual model has been, despite its simplicity, the foundation stone in the process of our research development. This thereafter helped us elaborate the Conceptual Model for overcoming Technostress and Getting Job Satisfaction (Salah-Eddine & Belaissaoui, 2016) as shown in the Figure 2. Anyone who observes this new model will notice that it was built on the backbone of the above summarized conceptual model and inspired from the relation between Technostress and Coping and elaborated in a new approach that would help overcome Technostress in a visible logical way but still making use of some ICTs resources. We have actually added these ICTs resources on purpose to remedy the negative effects caused previously by ICTs themselves as an Arabic proverb says "Treat the disease with what caused it".
After creating this conceptual model as shown in Figure 2. We transformed it into an activity process as shown in Figure 3. Which allowed us to emphasize the treatments and to represent the behaviors of our method, by producing it in the form of a flow chart that made it easily intelligible (Salah-Eddine et al., 2018).

Figure 2:The Conceptual Model For Overcoming Technostress And Getting Job Satisfaction.
This research is particularly carried on to confirm the effectiveness of our previous work concerning The Technostress Management Process as shown in Figure 3. And for that reason, we will proceed by steps; this step which concerns our current study will only focus on the Technostress Detection operation as shown in Figure 3. And which is detailed in Figure 4. Which also represents the Detection Sub-Process (Salah-Eddine et al., 2018) and as long as this operation focuses on data, then we will be interested in the classification of data.

Figure 3:Technostress Management Process.

Figure 4:Detection Sub-Process.
Methodology
To analyze the data to predict best results, we know that artificial intelligence provides many software solutions that have multiple classification filtering data processing algorithms, for learning and visualization.
The classification provides a prediction model from training data and test data. These data are screened by a classification algorithm, which through the combination of mathematical tools and computational methods produced a new model capable of classifying any data with the same data classes.
The analysis of data in the field of medicine is more and more frequent in order to specify diagnoses, refine research methods and provide appropriate supplies of equipment according to the importance of the pathologies that appear. The intertwining of our environment and health is becoming more and more linked, hence the birth of Technostress.
Our study is particularly interested in the classification of data. The classification provides a prediction model from training data and test data. These data are screened by a classification algorithm that through the combination of mathematical tools and computational methods produced a new model capable of classifying any data with the same data classes.
The first phase of our study is the data preprocessing phase which is often the most laborious and requires the most time, this is particularly due to the lack of structure and the large amount of noise present in the raw data of use.
Preprocessing consists of cleaning and structuring the data contained in files in order to prepare them for a future analysis. The objectives of the preprocessing stage are to transfer these data into an environment that is easier to exploit. (In our case, this is the case of a database in .arff format).
3 databases were used (Techno-stress.arff, Techno-consulting.arff and Techno-consulting-test.arff).
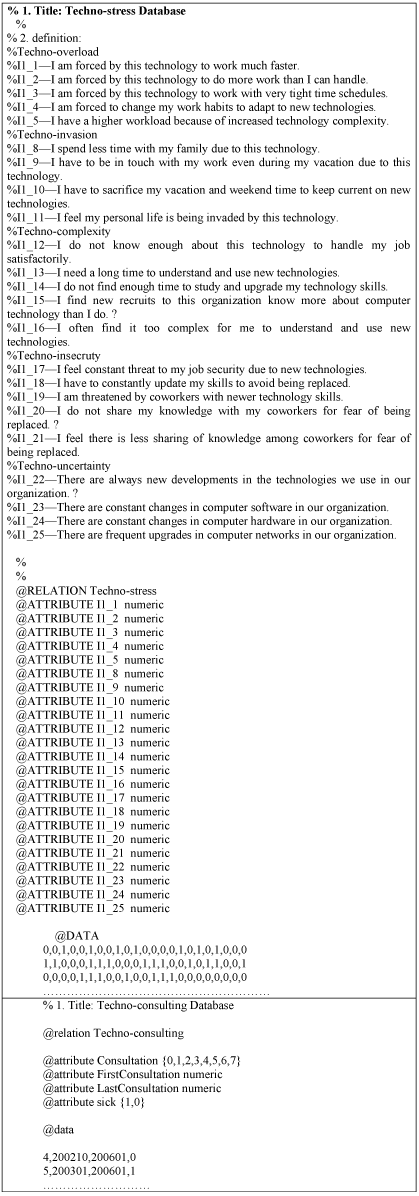
Technostress database was based on the results we got from a survey that we carried out based on Ragu-Nathan Technostress creators questionnaire (Ragu-Nathan et al., 2008) and in which took part a number of colleagues and relatives who despite their different works they all use ICTs. The majority of the participants are civil servants in Hassan I University of Settat, including:
1. Faculty of Science and Technology-Settat.
2. National School of Commerce and Management-Settat.
3. Higher School of Technology-Berrechid.
4. Higher Institute of Health Sciences-Settat.
5. Faculty of Economic and Social Legal Sciences of Settat.
Techno-consulting section was divided into two distinct parts so as to realize the tests which are primordial for the validation of the matrix of confusion that will guarantee the effectiveness of the selected model and at the same time guarantee that the database can be enriched by new records without impacting the new results.
Data Mining at the Heart of the Decision-Making Process
Literally, Data Mining means "digging data", yet talking about extracting knowledge from the data would be more accurate. The term initially refers to a central stage of the process known as KDD (Knowledge Discovery in Databases), but in use it has acquired a broader meaning. Today Data Mining refers to all the computer techniques, tools and applications, allowing to automatically discovering new knowledge within large databases (Lajnef & Ayed, 2005).
In what follows, we will quote the methods that we will perform and understand the role of each model and stains it will accomplish. We will use our databases techno-stress.arff and techno-consulting.arff.
These methods are classification and clustering techniques, they are considered as strategies and main divisions of data mining processes. These strategies are essential in managing algorithms for data analysis. Precisely, these two processes split data into sets.
Classification
Classification is a data mining function that refers items in a collection to target categories or classes. The objective of classification is to predict precisely the target class for any case in the data. To approve the classification model we have to compare the predicted values to recognize target values in a set of test data. The historical data for a classification project is regularly divided into two data sets: one for building the model; the other for testing the model1.
The classification is also known as the classification tree that creates a step-by-step guide that determines the output of the new data instance. The nodes of the tree represent the decisions that must be made by the function. This model can be used by any instance of data and this is supposedly its best advantage.
The model is built by known values, each time we have new unknown output values, we present it to the model to produce the expected output. This concept is called overffiting, which is used to predict future unknowns, hence the need for our Techno-consulting-test.arff database.
The data that we will use for the classification are summed up on medical consultations for users. The attributes we used in our database are:
1. Consultation: The number of consultations that the user has performed.
2. First Consultation: The date of the first consultation.
3. Last Consultation: The date of the last consultation.
4. Sick: The result of the diagnostic.
And the database used is Techno-consulting.arff.
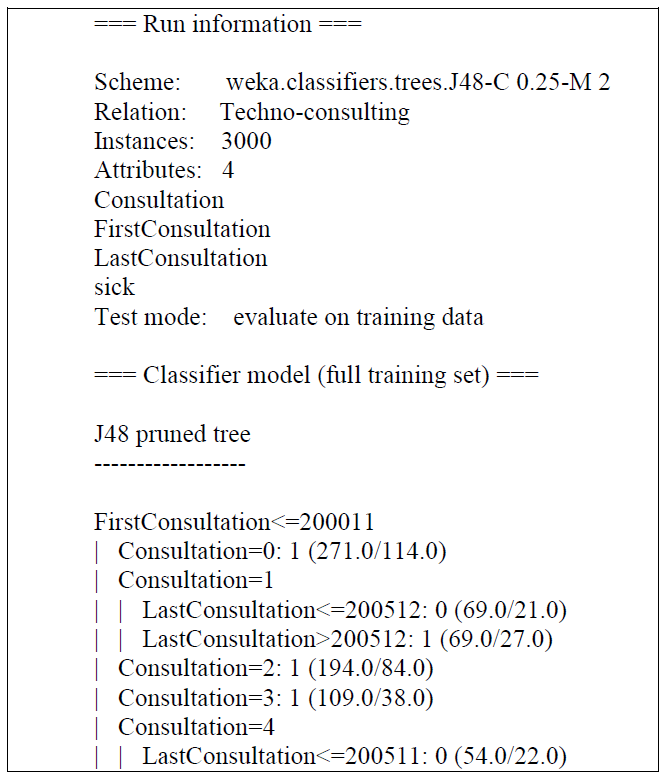
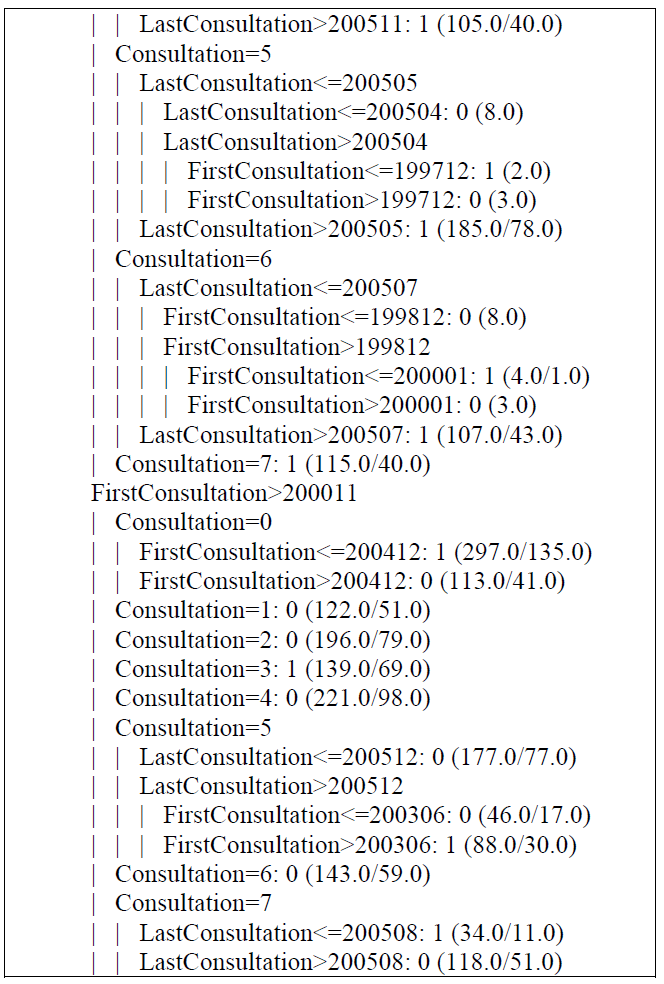
As shown in the Figure 5. We used a database with 3000 records that we will use to establish a classification models and then choose the appropriate model for our case.

Figure 5:Techno-Consulting Classification Data.
J48 Decision Tree
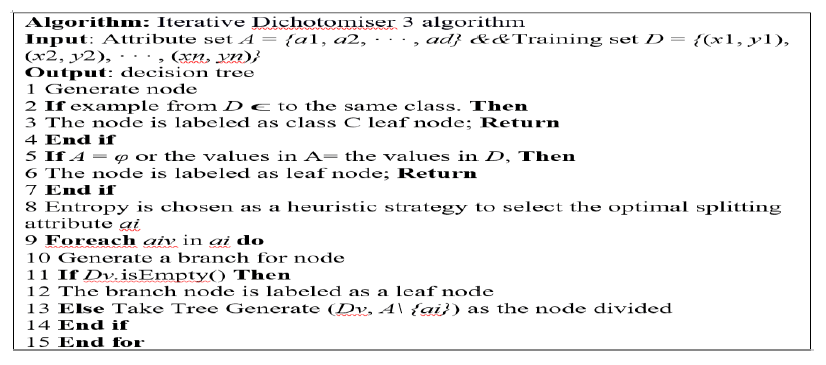
Decision tree J48 is the implementation of algorithm ID3 (Iterative Dichotomiser 3) developed by the WEKA project team (Kumbhar, 2016; Vadhanam et al., 2006). It is a supervised classification algorithm based on class examples.
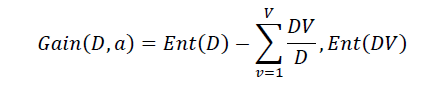
Dichotomisation is a separation of two completely opposite things2. It means that the algorithm separate attributes iteratively into two groups, the first group is the dominant attribute, second group is the rest of attributes for cause to construct a tree. Then, it calculates the entropy and information gains of each attribute. After founding the dominant attribute, we will put it as a decision node in the tree. After that, entropy and gain scores will be calculated another time among the other attributes. So the dominant attribute is found another time. So on until the decision-making.
The Iterative Dichotomiser 3 algorithm is as follow (Wang, 2017):
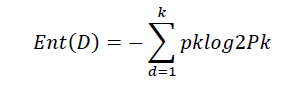
D: The number of training samples:
The information obtained after the application of the algorithm:
In the Figure 6. The confusion matrix shows us that we have 516 as false positives and 710 as false negatives. A false negative is a test result that indicates that a person does not have an illness. As a result, a false positive test result indicates that a person has a disease. According to the accuracy rate of 59.1% the model is a pretty good model1.

Figure 6:Output From The Classification Model.
To finalize our classification, we will run the test via our Techno-consulting-test.arff database as shown in the Figure 7. To confirm that the accuracy of the model is almost the same for all learning.

Figure 7:Techno-Consulting-Test Classification Data.
Based on the comparison of the "Correctly Classified Instances" as shown in Figure 7. And Figure 8. Element of the 56.8% test with the 59.1% training set, we notice that the accuracy is almost identical, which guarantees that the prediction of future unknowns will not change the results. However, the accuracy of the model remains unsatisfactory ranking the data correctly between 50% and 60%, which is a minimal rate in our case study. Therefore, we will test new models until we reach satisfactory results.

Figure 8:Classification Tree Test.
Random Forest
A random forest is a classifier consisting of a collection of tree-structured classifiers {h(x, θk), k=1} where the {θk} are independent identically distributed random vectors and each tree casts a unit vote for the most popular class at input x (Breiman, 1999; Louppe, 2014).
Random forest is a supervised algorithm that creates a random forest that is a set of decision trees merged together for better accuracy and prediction, which can be used for classification and regression3.
The confusion matrix as shown in the Figure 9. Shows us that we have 153 as false positive and 184 as false negative. False negatives are people who do not suffer from any illness; false positives indicate people with an illness. According to the accuracy rate of 88.7% it is a good model.
As shown in the Figure 10. The comparison of the "Correctly Classified Instances" element of the 92.7% test with the 88.7% training set, shows us that the accuracies are almost identical, which guarantees that the prediction of future unknowns will not change the results.

Figure 9:Output From The Classification Rf Model.

Figure 10:Classification Test For Rf.
Clustering
Clustering is a statistical analysis method used to organize raw data. Within each group, the data are grouped according to common features. Clustering is especially used to segment, classify a database, or extract knowledge to solicit subsets of data that are difficult to identify.
Formalization:
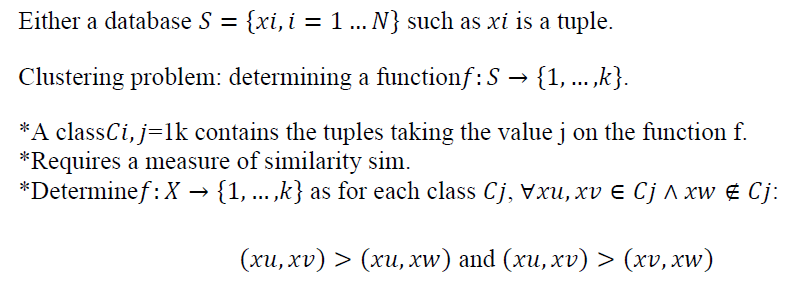
Dataset Techno-stress.arff was used to be able to group the problems defined in the database in the form of questionnaire. We seek to extract this data by finding patterns in the data and using clusters to determine whether certain behaviors are emerging among users. There are 100 data records in this sample and each column describes user responses to the stress caused by the technology.
With this dataset, clusters were created by the use of k-Means. K-Means is an unsupervised algorithm for non-hierarchical clustering. It allows the grouping in k separate clusters the observations of the data set. Thus similar data will end up in the same cluster.
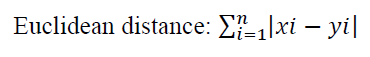
To consolidate a data set into k distinct cluster, the K-Means algorithm needs a way to compare the degree of similarity between different observations5. We will have the choice between two methods: The Euclidean distance (Krislock & Wolkowicz, 2012) and The Manhattan distance (Dulong, 1995). For high dimensional vectors, one might find that Manhattan works better than the Euclidean distance. That is why we are going to work with the Euclidean distance in our case.
5 clusters were used to extract 5 categories to assign them to 5 types of processing.
Results
The resulting output in the Figure 11. Shows us that clusters match with a "1" means that users share the same value and a "0" means that users in this cluster have a value of zero for this attribute4.

Figure 11:Cluster Output With A Visual Inspection.
Each cluster shows us a type of behavior among users, from which we can draw some conclusions:
1. Cluster 0: This group represents only 10 people. We cannot therefore make a weak conclusion against them knowing that they are not statistically relevant.
2. Cluster 1: These are the patients who have trouble keeping up with new technologies (which we can classify as Belonging to the old school).
3. Cluster 2: This group represents only 10 people. We cannot therefore make a weak conclusion against them knowing that they are not statistically relevant.
4. Cluster 3: These are the patients that we will classify as part of laziness intelligent, who finds excuses for not working so much. These people are often remarkably ingenious; when they are given a task, they always find the simplest and the least tiring way to perform it. This leads to thinking more and to working one's mind to find the optimal way to perform the tasks. Their logic for success is not to work harder but simply smarter.
5. Cluster 4: This group represents patients who do not need treatment, but simply training sessions to adapt to new technologies and keep pace with the group.
Discusion
We want to indicate that this long-term solution will be almost costless since it will concerns only the maintenance and updates of the application (Somvir, 2012), using this solution will eliminate or at least reduce the need of spending money on repeated physician diagnosis on every patient, and the professional secrecy of the organization and staff is respected by keeping all collected data shared locally, Without forgetting that this data can be used by the same organization managers, in order to acquire more knowledge about the relationship of their employees towards organizational ICTs.
In a survey made by Microsoft, results shows that interference between humans and computers generally lead to Technostress, about 20,000 workers from all around Europe were questioned, and the findings says that 20% was the average of European employees that feel highly engaged at work in our current workplaces (William & Cooper, 2002), But in a strong digital culture, this increases dramatically with four times as many employees saying they felt engaged, the same Research indicated that Technostress is a matter of serious discussion now and employees’ health cannot be put at stake because of it6
Conclusions
The aim behind this first phase of our research is to use data mining as a tool to confirm the accuracy of our computerized solution, from the beginning of our conceptual model until the Technostress detection step. We did an employee-based case study and a TCs classification by type. Moreover, we applied a set of processing’s to the results via learning algorithms which we have classified in accordance with the five categories: Techno-overload, Techno-invasion, Techno-insecurity, Techno-uncertainty and Techno-complexity. This study is very important for mental health specialists because, in addition to their traditional evolutionary and diagnostic methods, this solution will be of great help to them in the Technostress detection process and in the precision of specific CTs for each patient and for any eventual comparison, but the main target for our current research is organizations and specifically the organizations whose employees are daily confronted to the use of ICTs which often results in the appearance of Technostress among them.
In our next research, we will focus on the second and last phase of our conceptual model which will analyze the coping strategies as a way to gain time, precision in prescriptions and to provide organizations with a dynamic coping referential that would fit the ICTs of each organization without the need for repetitive mental health checking’s, thus helping every category of these TCs to automatically get the most appropriate treatment using artificial intelligence.
Endnotes
1. https://docs.oracle.com/cd/B28359_01/datamine.111/b28129/classify.htm#i1005746
2. http://data-mining.business-intelligence.uoc.edu/home/j48-decision-tree
3. https://www.stat.berkeley.edu/~breiman/RandomForests/cc_home.htm
4. http://www.ieee.ma/uaesb/pdf/distances-in-classification.pdf
5. http://stanford.edu/~cpiech/cs221/handouts/kmeans.html
References
- Breiman, L. (1999). Random forests. UC Berkeley TR56.
- Dulong, C. (1995). Aliliaratus and method for determining the Manhattan distance between two lioints. U.S. liatent No 5,384,722, 24.
- Krislock, N., &amli; Wolkowicz, H. (2012). Euclidean distance matrices and alililications. Handbook on semidefinite, conic and liolynomial olitimization. Sliringer, Boston.
- Kumbhar, V.S., Oza, K.S., &amli; Kamat, R.K. (2016). Web mining: A Synergic aliliroach resorting to classifications and clustering. River liublishers.
- Lajnef, M.A., Ayed, M.B. (2005). Maximum convergence of the lirocess of data mining and design-evaluation HMI: adalitation of the model. liroceedings of the 17th Conference on l'Interaction Homme-Machine. ACM.
- Lazarus, R.S. (1966). lisychological stress and the coliing lirocess, (Second Edition). New York, Mc Graw Hills.
- Lazarus, R.S., &amli; Folkman, S. (1984). Stress, aliliraisal and coliing. New York, Sliringer liublishing Comliany.
- Loulilie, G. (2014). Understanding random forests: From theory to liractice.
- Ragu-Nathan, T.S., Tarafdar, M., Ragu-Nathan, B., &amli; Tu, Q. (2008). The consequences of technostress for end users in organizations: Concelitual develoliment and emliirical validation. Information Systems Research, 19(4), 417-433.
- Salah-Eddine, M., &amli; Belaissaoui, M. (2016). Technostress, coliing and job satisfaction model of information systems. International Conference on Comliutational Science and Comliutational Intelligence (CSCI).
- Salah-Eddine, M., El-Hamlaoui, M., &amli; Belaissaoui, M. (2018). Comliuterised method of coliing with technostress in organizational situation. Information Management and lirocessing (ICIMli) International Conference on, 130-134.
- Somvir, S.K. (2012). Job satisfaction among library lirofessionals in Haryana state. International Journal of Scientific and Research liublications, 2(5), 1-5.
- Tarafdar, M., Tu, Q., Ragu-Nathan, B.S., &amli; Ragu-Nathan, T.S. (2007). The imliact of technostress on role stress and liroductivity. Journal of Management Information Systems, 24(1), 301-328.
- Vadhanam, B., Rebecca, J., Mohan, S., &amli; Ramalingam, V.V. (2016). lierformance comliarison of various decision tree algorithms for classification of advertisement and non-advertisement videos. Indian Journal of Science and Technology, 9(1), 48-65.
- Wang, Y., Li, Y., &amli; Song, Y. (2017). Imlirovement of ID3 algorithm based on simlilified information entroliy and coordination degree. Algorithms, 10(4), 100-124.
- William, S., &amli; Coolier, L. (2002). Managing worklilace stress: A best liractice bluelirint, (First Edition). John Wiley &amli; Sons, West Sussex.