Research Article: 2022 Vol: 28 Issue: 1S
Term Structure of the Corporate Bonds: Empirical Case of Kazakhstan
Aida Tatibekova, Turan University
Citation Information: Tatibekova, A. (2022). Term structure of the corporate bonds: empirical case of Kazakhstan. Academy of Entrepreneurship Journal, 28(S1), 1-14.
Abstract
This paper aims to investigate the challenges of estimating the yield curve of corporate bonds in Kazakhstan. The author suggests a method of constructing a yield curve of corporate bonds in the Kazakh debt market with low liquidity. The research covers the period from January 2014 to December 2018, with a sample of 397 corporate bonds with maturities varying from 1 year to 30 years. To estimate the term structure of corporate bonds, a parsimonious model (Nelson & Siegel) and a stochastic factor model (Vasicek) were applied on a 60-days smoothing period, which includes days with no trades on various segments of the curve. The findings of this paper indicate that both estimation models demonstrated the ability to adequately reflect interest rate movements and estimated continuous and smooth yield curves of Kazakh corporate bonds. However, Nelson & Siegel model had better indicators of the yield curve flexibility and was not quite sensitive to the constraint of low liquidity of the local debt market. The results of this study comply with the expectations hypothesis of the term structure of interest rates, implying that an inverted yield curve occurs when short-term bond rates had higher rates than those with longer maturities. Our results could be helpful for local market participants when planning bonds issue and for investors when choosing investment strategies.
Keywords
Term Structure, Corporate Bonds, Yield Curve, Liquidity, Parsimonious Model.
Introduction
Term structure of interest rates lies in the heart of asset pricing and can be used as an important indicator of the current state of capital market. Numerous researches have been conducted to investigate methods of estimating term structure of interest rates. The term structure of interest rates is also known under the term of “yield curve”. A yield curve is commonly used to graphically describe behavior of interest rates of the bonds with different maturities. Subject to shape, the yield curve helps determine current and future state of economy through investors' expectations about interest rates.
Current conditions of the local capital market are essential when estimating the yield curve of corporate bonds. According to FTSE Russel (2017), Kazakhstan has been classified as "frontier" markets since 2017. This classification provides important guidelines of capital markets standards for global investors in terms of infrastructure, access of foreign investors to the market, dealing system, liquidity, operating costs, effective market pricing of the bonds, etc. Countries with frontier markets often struggle with low market liquidity and have shortcomings in trading mechanism and market infrastructure. Kazakhstan’s local capital market in particular is constrained by low market liquidity. This could be explained with preference of Kazakh companies to get funding through banks, not capital market as both banks and capital markets compete for same local companies. Additionally, recent sharp decrease in market liquidity could be related to consolidation on the investor side, when a number of private pension funds have been absorbed by the single state pension fund in Kazakhstan in 2014 (Niyazbekova, 2014).
Bearing this in mind we examined trade frequency of Kazakh corporate bonds for the period of 2014 to 2018 using yields to maturity and number of trades in the secondary market. Over this five-year period 397 bonds and 9230 transactions were examined, except for trades in foreign currency and perpetual bonds. After exceptions, 4976 trades remained in the sample. The results show that the most traded corporate bonds are bonds with maturities ranging from 3.5 to 4.5 years with trading frequency of 17.6%, which implies 44 deals with a bond over the last 250 days (Table 1).
| Table 1 Trade Frequency of Corporate Bonds | |||
| Maturity (years) | Number of trades | Trade frequency % | Average yield to maturity % |
| 1 | 2 | 3 | 4 |
| 0 – 1 | 1230 | 13,6 | 10,7 |
| 1. - 1,5. | 527 | 17,2 | 9,7 |
| 1,5. - 2,5. | 1004 | 14,8 | 9,9 |
| 2,5 - 3,5. | 514 | 12 | 11 |
| 3,5 - 4,5. | 389 | 17,6 | 11,2 |
| 4,5 - 5,5. | 339 | 6,4 | 10,5 |
| 5,5 - 6,5. | 109 | 7,6 | 11,4 |
| 6,5 - 7,5. | 171 | 6,8 | 10,7 |
| 7,5 - 8,5. | 86 | 4,8 | 9,7 |
| 8,5 - 9,5. | 167 | 10,8 | 9,7 |
| 9,5 - 10,5. | 182 | 8,4 | 9,7 |
| 10,5 - 11,5. | 11 | 1,2 | 10,1 |
| 11,5 - 12,5. | 28 | 5,2 | 6,6 |
| 12,5 - 13,5. | 4 | 1,2 | 10 |
| 13,5 - 14,5. | 16 | 1,2 | 11,5 |
| 14,5 - 15,5. | 103 | 5,6 | 5,6 |
| 15,5 - 16,5. | 16 | 3,2 | 8,6 |
| 16,5 - 17,5. | 3 | 1,2 | 13,2 |
| 17,5 - 18,5. | 0 | 0 | 0 |
| 18,5 - 19,5. | 0 | 0 | 0 |
| 19,5 - 20 | 0 | 0 | 0 |
| (+) 20 | 77 | 8% | 6,6 |
| Total | 4976 | ||
Kazakh investors prefer to trade corporate bonds with maturities up to 5 years. Less trades were made with medium term bonds. And fewer trades were made with long term bonds as investors keep the strategy of holding bonds to maturity. All in all the trading activity with corporate bonds in 2014-2018 was quite positive (Figure 1).

Figure 1 Number of Corporate Bonds Trades
However, analyzing average trades per day, the outlook becomes less optimistic. In 2014, on average, there were only 6 trades per day, with 397 issuers listed on Kazakh Stock Exchange. For example, as of 11 of April, 2014 two trades were made with corporate bonds on the Kazakh Stock Exchange: 1 trade with corporate bonds of Tsesna Bank with maturity of 5 years, 1 trade with corporate bonds of ATF Bank with maturity of 6 years. Therefore on this particular day the yield curve of interest rates of corporate bonds was fragmentary at two points – 5- and 6- years maturities (Figure 2).

Figure 2 Number of Trades in Local Debt Market in 2014-2018
The results show a low level of liquidity in the secondary local corporate debt market. Low liquidity negatively affects the quality of Kazakh corporate bonds pricing. For instance, as of 5th of January, 2020 according to KASE Methodology of securities valuation (Kazakhstan Stock Exchange, 2020a) out of 258 active issues only 20 issues of global bonds had current market quotes (Bloomberg quotes). The rest of the corporate bonds denominated in Kazak tenge were classified as “illiquid bonds” due to absence of trades for the last 10 days. So that on that particular day practically all corporate bonds in Kazak tenge were illiquid and had no market quotes (Kazakhstan Stock Exchange, 2020b).
Literature Review
Theories of the Term Structure of Interest Rates
The research framework for this study applies fundamental theories and methods of estimating term structure. The term structure of interest rates reflects essence of asset pricing in capital markets. Theoretical literature on term structure of interest rates comprises a number of theories such as liquidity preference, expectations hypothesis, segmented markets hypothesis, preferred habitat theory and others.
The theory of liquidity preference assumes that investors are risk-averse and will request a premium for the bonds with longer maturities. The yield curve would have a rising slope.
The expectations hypothesis implies that forward rates, as expectations of future spot rates, have an important role in the yield curve construction. The hypothesis theory assumes that long-term interest rates could help forecast short-term interest rates. In this case, ignoring any risks, an expected cumulative return of the short-term bonds equals to the total return of the long-term bonds. However empirical studies show that this theory overestimates the role of future short-term rates, which may be caused by risk premium. Nevertheless, the expectations hypothesis is quite useful in the short end of the yield curve due to the lower risk premium.
The theory of segmented markets hypothesis implies that slope of the yield curve is subject to supply and demand at various segments of the yield. The theory assumes that there are many investors in the debt market for each maturity of the bonds. As a result, the shape of the yield curve depends on supply and demand at various maturities across the yield curve.
Preferred habitat theory can be viewed as a type of segmented markets hypothesis and assumes that investors have specific preferences in maturity. However, investors might change their maturities once the bond yields rise enough to compensate for such a change (Nymand-Andersen, 2018).
The yield curve plots interest rates of the bonds with various residual maturities as shown in Figure 3. The yield curve changes the shape due to the movements in the market. The yield curve may have its own slope, curvatures and level. For instance, level changes show the way interest rate vary with equal amount at each maturity levels. The changes in slope show changes in the short or long ends of the yield curve by different amounts. The curvature of the yield curve refers medium end of the curve, and results in increase in humps of the shapes.

Figure 3 Yield Curve
As a rule, the yield curves have upward-slope, suggesting that long-term bonds have higher yields compared to short term bonds, since the longer investors hold the bonds the higher the expected risk premium. If one assumes a risk-free bond with known maturity and coupon payments, interest rates at various time are known, the bond price can be written as shown below.
 (1)
(1)
where C – coupon, N – debt repayment value, S – interest rates, M – bond maturity.
The main assumptions relate to the credit risk that could be neglected and that the interest rate could be defined by inflation and real interest rates expectations.
If an investor prefers to hold the bonds to maturity, discount rate would be equal to the yield-to-maturity. Thus, the yield-to-maturity can be viewed as discount rate applied to the sum of present value of all the future cash flows so that it equals to the price of the bond.
Methods of Estimating Term Structure of Interest Rates
Anderson et al. (1996) suggested splitting methods of estimating term structure of interest rates to the following groups:
1) Spline-based methods used for estimating the yield curve by smoothing data of the bond yields;
2) Parsimonious methods, that imply fitting exponential approximation discounting function on bond prices;
3) Stochastic methods that allow specific assumptions related to change of variables of state and methods of pricing assets through state of equilibrium or arbitrage.
Each method applied in the above groups may give various forms of the yield curve, therefore the choice of estimation method depends on final purpose of application.
Spline-based method This method was initially suggested by H. McCulloch (1971) with discounting function is estimated by regression splines. The method is based on splitting the yield curve across all maturities into separate segments joined at knot points. McCulloch found that discount function could be approximated with cubic splines with smooth estimated yield curve of forward rates.
Fisher, Nychka and Zervos (1994) suggested a method, which fits a cubic spline instead of regression spline to the forward rate function and imposes a “so-called” roughness penalty. This penalty is constant across all maturities, as a result the knots strengthen, and this reduces fluctuations of the rates. The required number of nodes could be up to one third of all bonds in the sample, besides, the knot should be located so that equal number of bonds would be maturing between the two adjacent nodes. As roughness penalty intensifies internal relationship between spline parameters, and the number of parameters go down.
However, Bliss (1996) in his research found out that continuous application of roughness penalty could result in incorrect estimation of the short-term bonds. Thus, this method does allow flexibility needed in the short-term segment of the yield curve.
Waggoner (1997) uses a method of cubic splines for approximation of the yield curve of forward rates. Advancement of this model is that he suggested using a penalty that changes over maturities. Waggoner also suggested a three-leveled step-wise function for the smoothing parameter. Such approach decreases fluctuation amplitude and retains flexibility at the short-term segment of the yield.
Anderson и Sleath (2001) extended the model of Waggoner’s model with functional form of roughness penalty. Waggoner used 5 smoothing parameters for estimation of the yield curve. Anderson and Sleath suggested a more advanced penalty function that changes across the maturities and is estimated by three parameters.
Parsimonious method of estimation of the yield curve of interest rates generates monotonic forms of the curve in the shape of hump or S-shape.
Parsimonious modelling is a widespread method of estimating the term structure of the spot rates. This method uses only one parameter function for description of all spot rates across the maturities of the long-term bonds. The key difference from spline-based method is that parsimonious method requires minimal number of parameters, which in turn smoothens the yield curve.
Parsimonious model suggested by Nelson and Siegel (1987) implies fitting exponential approximation function on bond yields. Among key advantages of the model one may note the simplicity of application and straight forward economic interpretation of the model parameters, such as short-, medium- and long-term segments of the yield of the forward rates. Nelson and Siegel suggested a theoretical form of the yield curve, based on the empirically tested yield curve, with monotonic or convex forms.
Svensson (1994) suggested an extension of Nelson & Siegel model for the Central Bank of Sweden to improve flexibility of the yield curves and increase quality of fitting the estimated rates to the underlying interest rates. In particular, Svensson added one variable (exponent) and increased degrees of freedom of the yield curve. However, Svensson’s model may have two extremums, which in turn, makes the model less stable.
Stochastic method of estimation stochastic methods are based on the assumption of the random nature of variations of interest rates. The model includes several stochastic factors that explain the movement of interest rates. There are three large categories of stochastic models: factor models, equilibrium models, and non-arbitrage models. The models differ from one another by the type of variable of the bond yield (internal or external).
The stochastic model for estimation of interest rates developed by O. Vasicek (1977) is the first model for estimation of term structure of interest rates, widely used to value options, futures and fixed income instruments. Interest rates (spot rates) vary in the frame of continuous Markov process.
The rate is defined by a Wiener process, which assumes that interest rates tend to the mean. It remains the benchmark model up to this day due to its simplicity and the ability to easily estimate bond prices. The drawback of the model refers to impossibility of using negative rates; however, in the emerging markets this term is not a problem, since all prices are positive.
Methods of estimation of bond prices in Kazakhstan. According to KASE valuation methodology, market price of corporate bonds is based on aggregate price of the average prices for the period, best bid price and best ask price. In the absence of market yields of the corporate bonds spreads of the corporate bond yields to the risk-free rates (z-spread) (Kazakhstan Stock Exchange, 2020a).
Material and Methods
Data Setting
The sample of the corporate bonds include the following:
- the bonds issued by corporate issuers in the national currency Tenge;
- the bonds with fixed coupon interest and with a specific maturity;
- the sample does not include bonds with floating coupon bonds, including inflation-linked coupon bonds, perpetual bonds;
- the bonds included in the official listing lists of the Kazakhstan Stock Exchange;
- residual maturities of bonds are from 6 months to 30 years;
- sampling period of the bonds is 60 days ("smoothing period") prior to the valuation date
The data on yield to maturity of the corporate bonds in the national currency tenge is obtained from reliable sources like Kazakhstan Stock Exchange (2020b).
Model Specifications
The yield curve is estimated using rates modeling algorithm that minimizes the sum of the quadratic difference between the bond yields estimated from the yield curve and the actual bond yields observed in the market. The bond yields are calculated using the formula of the International Association of Securities Markets for bonds with a fixed coupon payment with a one-time payment of the principal debt:
 (2)
(2)
Where,
P = gross price of the bond based on the results of the previous day
g = annual interest rate, in percent
k = first/next coupon payment in percentage
h = number of coupon payments per year
n = number of coupon payments before repayment of debt
f1 = fraction of the number of calendar days from the valuation date to the first / subsequent coupon p
f2 = fraction of the number of calendar days from the last coupon payment date to debt maturity date
C = cost of principal
v = discount factor. v =1/(1+y), where y = the required rate of return at maturity, calculated h times a year.
The price is calculated using the continuous interest rate method. The price is calculated using the market interest basis of actual days / 360 days or actual days / actual days, subject to the bond type. No tax or coupon adjustments applied
Nelson & Siegel Model
The Nelson Siegel model used in the yield curve estimation algorithm is a parametric model that applies a functional form to the spot rate. The forward rate curve f (t) is given by the following equation:
 (3)
(3)
This model estimates behavior of the yield curve of the forward rates. The parameters of this model can be interpreted as follows:
β0 – is the long-term asymptotic value of the function f (t) over the estimation period and must be positive.
β1 – is the spread between long-term and short-term rates, so the sum β0 + β1 is equal to the short-term rate (the rate at zero maturity).
τ1 defines the hump or U shape of the first bend of the yield curve.
β2 determines the amplitude and direction of the bend shape of the yield curve.
A continuous yield curve of spot rates r(t) is estimated by integrating the forward rate curve:
 (4)
(4)
Thus, this regression equation can be estimated using the least squares method. The model parameters are determined by minimizing the squares of the deviation of theoretical prices from the observed ones, and the function takes the following form:
 (5)
(5)
Where N – the number of bonds;
k – serial number of the bond;
Pk – market price of the bond;
n – number of cash flows of the bond;
i – serial number of such a cash flow
This method allows to estimate the yield curve using just a few parameters representing long-term rates, the shape and bends of the yield curve, as opposed to spline-based models that constrain the forward rate yield curve from taking unwanted shapes.
Vasicek Model
Stochastic model assumes that information about the term structure of interest rates is contained in one stochastic factor - the instantaneous interest rate r (t) in risk-neutral environment. The value of the instant rate (spot rate) is the only variable in the model that determines the term structure of rates. All expectations are based on information about all yields that have taken place to date. Thus, the conditional expectations of the rate values are based on the current spot rates level. The model makes three basic assumptions:
1. The rate movement is fully consistent with the continuous diffusion process. The model stipulates the condition that the interest rate tends to its mean in the long run. The short-term rate returns to level b at a rate of a, and the quantity σdz is a normally distributed superimposed stochastic variable (rate returns to its mean, Ornstein-Uhlenbeck process):
According to Vasicek model, the risk-neutral process for the instantaneous interest rate r is determined by the following expression:
dr=a(b-r)dt + σdz (6)
where a, b и σ are constant variables
b – mean value of the rate in the long run
σ – constant variance parameter
а – the drift parameter, shows the rate of return to the mean value in the long run
2. Estimation of the bond price to maturity is done at the moment of time t of the stochastic rate process {r(τ),t ≤ τ ≤ T}.
3. The market is efficient, assuming access to information for all investors and rational behavior of investors.
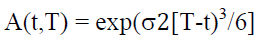
Let us denote the price of the bond P (t, T), with the maturity date T at moment of time t. Vasicek showed that you can use the bond price equation:
 (7)
(7)
To obtain the following expression for the price in period t rate with zero-coupon rate that pays interest in period T:
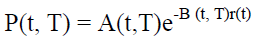 (8)
(8)
In this equation, r (t) is the value of r at a time period t:
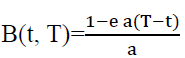 (9)
(9)
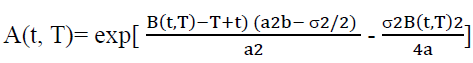 (10)
(10)
 (11)
(11)
From equation 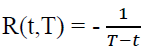 ln P(t, T), zero rate at time t for period (T-t):
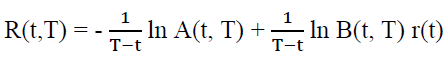 (12)
(12)
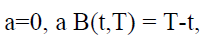
Thus, the above equation shows that the whole term structure of interest rates at time t can be determined as a function of r (t) once the variables a, b, and σ have been determined. At the same time, the shape of the estimated yield curve can be convex upward or downward.
Results
Descriptive Statistics
The sample data collected from January 2018 to December 2018 has been used to estimate the yield curves of corporate bonds on 60-days smoothing period. Descriptive statistics on the sample data for the yield curve estimation for period from November 2018 to December 2018 are shown in Table 2.
| Table 2 Statical Data on the Yield Curve | |||||||
| No. | Mean | Median | Max. | Min. | Std. dev. | skewness | Kurtosis |
| maturity | 6,062314 | 4,335350 | 26,45600 | 1,001200 | 5,062021 | 1,875078 | 6,732502 |
| Yield | 10,34615 | 11,50000 | 18,06600 | 2,467200 | 3,419210 | -0,610969 | 2,438485 |
According to Figure 4 below an average maturity of corporate bonds in Kazakh debt market in the end of 2018 was 6 years, and the median maturity exceeded 4 years. The minimum circulation period of corporate bonds was 1 year, and maximum - 26 years, respectively. In the whole, the corporate bonds are fully represented in Kazakh debt market across all maturities of the yield curve from 1 to 26 years.

Figure 4 Distribution of Bond Maturities
With regard to statistical data on bond yields, the following can be noted. The distribution of returns is not normally distributed and has two extremes at 4% and 12% (Figure 5). In our opinion, such an abnormal distribution of yields is due to the appearance of two extremes of yields which is most likely associated with the purchase of the bonds of state-owned companies by a large institutional investor at a non-market price. According to the statistics obtained, the average yield on corporate bonds in 2018 was 10%, according to the median - 11%, the maximum yield was 18%, the minimum yield was 2.5%, respectively.

Figure 5 Distribution of Bond Yields
Thus, estimated data on the yield of the bonds allow us to draw a practical conclusion that the Kazakh corporate debt market is clearly segmented in terms of yields into quasi-state companies and commercial companies.
Estimation Results
The yield curve for interest rates of Kazak corporate bonds has been modelled using Nelson & Siegel model and Vasicek model.
There are two approaches used in the academic literature to assess the performance of the term structure. The first one is the flexibility of the yield curve, while the second one refers to the smoothness of the yield curve, and one needs to reach a trade-off between the two. A number of statistical indicators can be calculated for the flexibility (goodness-of-fit) of the estimated yield curve, namely, root mean squared error (RMSE), coefficient of determination (R2) and adjusted coefficient of determination (R2 adjusted).
The RMSE shows the estimated value of the standard deviation of a random component in the data (Mathwork, 2021). The lower the RMSE value, the better the model fits the yield curve data and, accordingly, generates a more accurate and flexible curve of the corporate bonds.
The R2 coefficient is another indicator of compliance of the estimated bond yields with the underlying data. It defines correlation between the model estimates and the underlyingvariables. The higher the R2 coefficient, the smaller the difference between the observed and estimated data and the better the quality of fitting of the yield curve. Adding new variables improves the R2 coefficient, however it may in some cases result in decrease in the model quality. We calculated the adjusted R2 coefficient to define how reliable the correlation of the model variables. The estimated coefficients (RMSE, the R2 and adjusted R2) are below in the Table 3.
| Table 3 Coefficients RMSE, R2 And Adjusted R2 For 2018 | ||||||||||||
| 1/1/2018 | 2/1/2018 | 3/1/2018 | 4/1/2018 | 5/1/2018 | 6/1/2018 | 7/1/2018 | 8/1/2018 | 9/1/2018 | 10/1/2018 | 11/1/2018 | ||
| RMSE | Nelson | 0.0258 | 0.0291 | 0.0323 | 0.0293 | 0.0286 | 0.0253 | 0.0238 | 0.0237 | 0.0238 | 0.0241 | 0.023 |
| Vasicek | 0.0256 | 0.029 | 0.0321 | 0.0302 | 0.0286 | 0.0253 | 0.0238 | 0.0237 | 0.0238 | 0.0241 | 0.023 | |
| R2 | Nelson | 0.3704 | 0.3538 | 0.3552 | 0.3295 | 0.2511 | 0.4366 | 0.4943 | 0.3818 | 0.3325 | 0.6381 | 0.6695 |
| Vasicek | 0.3763 | 0.3592 | 0.3658 | 0.2923 | 0.2505 | 0.4357 | 0.4916 | 0.3816 | 0.333 | 0.6378 | 0.6691 | |
| Adjusted R2 | Nelson | 0.3193 | 0.3235 | 0.3102 | 0.2916 | 0.219 | 0.3982 | 0.4554 | 0.3571 | 0.308 | 0.6228 | 0.6579 |
| Vasicek | 0.3257 | 0.3292 | 0.3215 | 0.2523 | 0.2183 | 0.3972 | 0.4525 | 0.3568 | 0.3086 | 0.6225 | 0.6576 | |
The coefficients for 2018 on Vasicek model and Nelson & Siegel model are presented in the Table 4. Nelson & Siegel model scored lower RMSE and higher R2 and adjusted R2 coefficients compared to Vasicek model.
| Table 4 Scores on RMSE, R2 and Adjusted R2 For 2018 | |||||||||||||
| RMSE | Nelson | 0 | 0 | 1 | 0 | 0 | 0 | 0 | 0 | 0 | 0 | 1 | |
| Vasicek | 1 | 1 | 1 | 0 | 0 | 0 | 0 | 0 | 0 | 0 | 0 | 3 | |
| R2 | Nelson | 0 | 0 | 0 | 1 | 1 | 1 | 1 | 1 | 0 | 1 | 1 | 7 |
| Vasicek | 1 | 1 | 1 | 0 | 0 | 0 | 0 | 0 | 1 | 0 | 0 | 4 | |
| Adjusted R2 | Nelson | 0 | 0 | 0 | 1 | 1 | 1 | 1 | 1 | 0 | 1 | 1 | 7 |
| Vasicek | 1 | 1 | 1 | 0 | 0 | 0 | 0 | 0 | 1 | 0 | 0 | 4 | |
| Total | Nelson | 15 | |||||||||||
| Scores | Vasicek | 11 | |||||||||||
Based on the above we can draw a conclusion that Nelson & Siegel model provides better fitting of the yield curve in the Kazakh corporate bond market compared to Vasicek model.
Discussion
The estimated yield curve for corporate bonds in Kazakh debt market had a negative slope by the end of 2018. In Figure 6, there is an upward slope in the short end of the curve and flatter slope in the medium and long end of the curve. This kind of behavior of the yield curve can be interpreted as speculative investor interest in short-term and medium-term bonds compared to longer term bonds.

Figure 6 The Yield Curve of Kazakh Corporate Bonds in 2018
The estimated yield curve of corporate bonds on the Kazakh debt market had a negative slope in November and December 2018. The expectations hypothesis of the term structure of interest rates explains that an inverted yield curve occurs when short-term rates of the bonds got higher than rates on long-term bonds. This usually happens when inflation goes up, and central bank raises its base rate which causes subsequent increase in the short-term rates.
Intuitively, the inverted nature of the yield curve can also be explained by the speculative characteristics of the bondholders. In practice, issuers of corporate bonds regularly pay coupon interest, while problems may arise during the period of debt repayment, since non-payment risks increase by moment of principal debt repayment approaches. To generate coupon income, investors may purchase medium and long-term bonds and sell them before maturity to avoid credit risk.
Conclusion
Building the yield curve using data of the market with low liquidity is quite difficult, but possible with some assumptions. We included the bond yields from previous periods in the sample due to low trading activity and a small number of observed bond prices. When estimating the yield curve for markets with low liquidity we used a 60-day smoothing period which includes days with no trades at various ends of the yield curve.
In this paper, we present estimates of yield curve of Kazakh corporate bonds in 2018 using Nelson & Seigel model and Vasicek model. Both models demonstrated the ability to adequately reflect rate movements and generated similar yield curves.
Vasicek model makes good interpretation of the interest rate fluctuations. Nelson & Seigel model has much better indicators of the yield curve flexibility and was not quite sensitive to such a strong constraint as low liquidity of Kazakh debt market. As a result, we estimated a continuous and smooth yield curve of the corporate bonds using Nelson & Siegel model. The model ensured the stability of the yield curve so that minor changes in interest rates in one section of the curve did not cause significant changes in sections of the yield curve. In our opinion, the estimated yield curve of Kazakh corporate bonds based on Nelson & Siegel model would allow issuers to plan their funding from capital market at acceptable market prices. Besides, the results estimated above indicate this study complies with the expectations hypothesis of the term structure of interest rates, implying that an inverted yield curve occurs when short-term rates of the bonds got higher than rates on long-term bonds.
References
Anderson, N.M., Deacon, A., & Derry, A. (1996). Estimating and interpreting the yield curve. New York, NY: Wiley, 25.
Bliss, R.R. (1996). Testing term structure estimation methods (No. 96-12a). Working Paper.
Fisher, M., Nychka, D.W., & Zervos, D. (1995). Fitting the term structure of interest rates with smoothing splines.
FTSE Russel. (2017). FTSE country classification process. Retrieved from https://research.ftserussell.com/products/downloads/March_2017_Country_Classification_Update.pdf
Kazakhstan Stock Exchange (2020a). Methodology of securities valuation. Retrieved from https://kase.kz/files/normative_base/met_ocen_zb.pdf
Kazakhstan Stock Exchange (2020b). Trading report of the Kazakhstan Stock Exchange. Retrieved from https://kase.kz/ru/#trade_info_period
Mathwork (2021). Modeling with MATLAB. Support section. Retrieved from https://www.mathworks.com/help/curvefit/evaluating-goodness-of-fit.html
Niyazbekova, Sh.U. (2014). Current state of stock market of Kazakhstan. Journal of Naukovedenie, 1(1), 45-50.
Nymand-Andersen, P. (2018). Yield curve modelling and a conceptual framework for estimating yield curves: evidence from the European Central Bank's yield curves (No. 27). ECB Statistics Paper.
Svensson, L. E. (1994). Estimating and interpreting forward interest rates: Sweden 1992-1994