Research Article: 2021 Vol: 25 Issue: 2
Testing the Conditional Volatility of Saudi Arabia Stock Market: Symmetric and Asymmetric Autoregressive Conditional Heteroskedasticity (Garch) Approach
Jumah Ahmad Alzyadat, Dar Aluloom University
Ala’a Adden Abuhommous, Mutah University
Huthaifa Alqaralleh, Mutah University
Abstract
The study aims to investigate the presence of conditional volatility in the Saudi Arabia stock market returns. The daily closing equity market price indices for Saudi stock exchange (Tadawul) covered the period Sep. 2017 to Sep. 2020. The sample was carefully chosen to present only the significant event affecting the stock market, specifically, the COVID-19 pandemic. The study applies the nonlinear GARCH-class models along with the best fitting distribution accounting for the skewness and excess kurtosis in return modeling. The estimation results reveal evidence of an inverted asymmetric effect during the calm time before COVID-19 pandemic. However, strong evidence of news effect was detected as the health crisis began.
Keywords
Saudi Stock Market, Conditional Volatility, GARCH, COVID-19 Pandemic, Stock Market Returns.
Introduction
The issue of stock market volatility has always been a great importance to financial market participants, researchers and even the public, volatility is often associated with the concept of risk. In the context of a financial crisis, terms such as forecasting volatility or managing risk are among the most important topics in the financial world today. Financial market volatility has historically played a critical role in financial decision-making and volatility forecasts have important applications in areas such as asset pricing, risk management, hedging strategies, and portfolio allocation, as well as forecasting of value at risk (VaR) and optimum capital charges (Miron & Tudor, 2010).
Volatility is one of the most important characteristics of stock markets and financial markets in general. It is directly related to the uncertainty in the market affects the investment decision of institutions and individuals, option pricing, expected future value, and financial market regulation. The study of the volatility of stock returns is also one of the fundamental issues in modern financial economics research; volatility is measured through rate of return variance or standard deviation. Although different models and approaches are available and applied, not all of them work equally with all stock markets or all stocks, so forecasting all market fluctuations is difficult work (Bhowmik & Wang, 2020).
Literature in stock returns and volatility analysis applied autoregressive conditional heteroscedasticity models (ARCH), generalized autoregressive conditional heteroskedastic models (GARCH), Autoregressive Moving Average (ARMA) model, mean absolute deviation (MAD), root mean squared error (RMSE), mean absolute error (MAE), mean squared error (MSE), normalized mean squared error (NMSE), Classic historical volatility (VolSD) method. And Exponential smoothing and Exponential weighted moving average (EWMA) model. Saudi Arabia plays a major role in the oil markets, however not much are known about the Saudi stock exchange market (Tadawul), which is the only stock exchange in the country and the main stock exchange among the countries of the Gulf Cooperation Council.
The Saudi stock exchange market was established in 2007; it offers trading of Islamic stocks and bonds known as Sukuk and has nearly 200 companies listed for trading. The Saudi stock market (Tadawul) considered one of the strongest and largest stock markets in the Gulf and the region. During the year 2019, the Saudi Arabian Oil Company (ARAMCO), was listed in the stock market, as the largest listing in the world, as this contributed to deepening the Saudi stock market by increasing the number of companies and increasing trading activity and values. The year 2019 witnessed an increase in the general index of Saudi stock prices by 7.2 percent compared to 2018 (Saudi central bank, 2020). The year 2020 witnessed an increase in the general index of Saudi stock prices by 3.58 percent compared to 2019 (Saudi Stock Exchange, 2020). Therefore, this study aims to investigate the presence of conditional volatility in the Saudi Arabia stock market returns. The latter will be achieved through adopting the nonlinear GARCH-class models along with the best fitting distribution accounting for the skewness and excess kurtosis in return modeling.
Literature Review
Several studies applied both symmetric and asymmetric GARCH family models to estimate or forecast the volatility of daily returns in stock markets in different countries both developed and emerging stock markets: McMillan, et al. (2000) analyzed the performance of a variety of UK FTA All Share and FTSE100 stock index volatility. Ng & McAleer, (2004) tested and predicted the asymmetric volatility in the S&P 500 composite index and the Nikkei 225 index. Rousan & Al-Khouri, (2005) investigated the volatility of the Jordanian stock market using Amman Stock Exchange Composite Index (ASE). Michael & Christopher, (2006) forecasted return volatility using Standard and Poor's 500 index data for 1983-2004. Frimpong & Oteng-Abayie, (2006) forecasted volatility on Ghana Stock Exchange. Kovacic (2007) investigated the behavior of stock returns in Macedonian Stock Exchange, Hamadu & Ibiwoye (2010) modeling stock price returns of Nigerian insurance stocks. Miro & Tudor, (2010) focused on US and Romanian stock return. Kumar & Dhankar, (2010) used the daily opening and closing prices of S&P 500 and NASDAQ 100 to investigate the presence of conditional heteroskedasticity in US stock market returns, Further; the study also analyzes the relationship between stock returns and conditional volatility, and standard residuals.
Goudarzi & Ramanarayanan, (2011) used BSE500 stock index as a proxy of Indian stock market to study the asymmetric volatility. Angabini & Wasiuzzaman, (2011) used Kuala Lumpur composite index KLCL to investigate the change in volatility of Malaysian stock market. Gabriel, (2012) forecasted the volatility of BET index return in Romania. Panait & Slavescu, (2012) compared the volatility of high (daily) and low (weekly, monthly) frequencies for seven Romanian companies traded on Bucharest Stock Exchange and three market indices. Abdalla & Winker, (2012) modeled and estimated Stock market volatility in Khartoum Stock Exchange KSE and Cairo, Alexandria Stock Exchange, CASE from Egypt. Obaid & Suliman, (2013) estimated stock returns volatility of Khartoum Stock Exchange (KSE) Index. Hou (2013) examined the volatility of the Chinese stock markets. Gokbulut & Pekkaya, (2014) analyzed the mean return and conditional variance of Turkish Financial Markets. Al Rahahleh (2014) Investigated volatility forecasts used data from Qatar Stock Exchange (QSE) index. Koima et al. (2015) estimated volatility of Kenyan stock markets returns. Jianguo & Qamruzzaman, (2016) predicted volatility of stock return in Dhaka stock exchange (DSE). Cheteni (2016) estimated volatility of the stock returns in the Johannesburg Stock Exchange FTSE/JSE Albi index and the Shanghai Stock Exchange Composite Index. Hansen & Huang, (2016) applied the model to 27 stocks and an exchange traded fund that tracks the S&P 500 index. AL-Najjar (2016) investigated the behavior of stock return volatility for Amman Stock Exchange (ASE). Ndwiga & Muriu, (2016) explored the volatility pattern of Kenyan stock market based on daily closing prices of NSE Index. The study confirmed the existence of a positive and significant risk premium. Moreover, volatility shocks on daily returns at the Kenyan stock market are transitory. Maqsood et al. (2017) estimated the volatility of returns in Kenyan stock market. Luo et al. (2017) analyzed the mean return and conditional variance of SSE380 index.
Naseem et al., (2018) modeled the volatility of Pakistani stock market. Amudha & Muthukamu, (2018) examined the leverage effect that explained the asymmetric volatility of the automobile stocks listed in the Indian stock market. Chimrani et al. (2018) examined the volatility of Pakistan stock exchange (PSX) of 11 sectors. Abdelhafez (2018) forecasted volatility of Egyptian Stock market. Bonga (2019) modeled the volatility of the Zimbabwean stock market used monthly return series. Magweva & Sibanda, (2020) used the S&P500 to examine the volatility of the infrastructure sector in emerging markets. Glosten et al. (1993) used the modified GARCH-M model showed that monthly conditional volatility may not be as persistent. Engle, (2001) used ARCH and GARCH models to provide an example of measuring risks that are the input to a variety of economic decisions. Patev & Kanaryan, (2003) applied GARCH-M (1,1) with Student T distributed errors to investigate the impact of both recent news and old news on the conditional volatility, And applied EGARCH-M (1,1) with GED distributed errors to examine the asymmetric effect in four Central European stock market indexes. Patev et al. (2009) revealed that the EWMA with t-distributed innovations and the EWMA with GED distributed innovations evaluate the risk of the Bulgarian stock market. Matei et al. (2019) proposed a class of bivariate GARCH models that includes estimates of daily, day and night fluctuations. Models have been experimentally tested to confirm whether using night volatility information improves estimation of daily fluctuations.
The results indicated that an improvement in prediction using bivariate GARCH models compared to those that do not include estimates of night fluctuations. Aliyev et al. (2020) employed EGARCH and GJR-GARCH to estimate the volatility of nonfinancial, innovative and hi-tech focused stock index, the Nasdaq-100. The study found that the volatility shocks on the index returns are quite persistent. Furthermore, the findings showed that the index has leverage effect, and the impact of shocks is asymmetric, whereby the impacts of negative shocks on volatility are higher than those of positive shocks of the same magnitude. As for the Saudi financial market, there are many studies that have been carried out to estimate and forecast volatility of Saudi Arabia stock market using daily closing prices on the general market index (Tadawul All Share Index; TASI) used symmetric and asymmetric (GARCH) model. Abdalla (2012) provided strong evidence of the persistence of time varying volatility, the asymmetric GARCH models show a significant evidence for asymmetry in stock returns. Al Freedi et al. (2012) found that AR(1)-GJR GARCH model with student-t outperform the other models during and before the local crisis (2006), while AR(1)-GARCH model with GED has a better performance after 2006 period. Kalyanaraman (2014) showed that a linear symmetric GARCH (1,1) model is adequate to estimate the volatility of the stock market also; Saudi stock market returns characterized by volatility clustering and followed a non-normal distribution. Mhmoud & Dawalbait, (2015) showed that the asymmetric GARCH models with a heavy tailed error distribution better than the symmetric GARCH model to estimate and forecast volatility of Saudi stock market. Al Rahahleh & Kao, (2018) suggest that the Asymmetric Power of ARCH (APARCH) model is the most accurate model in the GARCH for forecasting the volatility of both the Tadawul All Share Index (TASI) and the Tadawul Industrial Petrochemical Industries Share Index (TIPISI) for petrochemical industries in the context of petrochemical industries. Shaik & Syeda, (2019) indicated that the symmetric and asymmetric GARCH models are comfortable to capture the Intraday return volatility of Saudi stock market.
Assous et al. (2020) investigated the effectiveness of six of the main international indices in estimating the movement of the Saudi Stock Exchange Index (TASI). The results showed that the SP500, NIKKEI, CAC40 and HSI indices are the most relevant variables for TASI estimation. Kang et al. (2009) investigates the volatility of the three crude oil prices Brent, Dubai, and West Texas Intermediate (WTI) using conditional volatility models. Concluded that the CGARCH and FIGARCH models are useful for modeling and forecasting the volatility of crude oil prices.
Methodology
Investigating the impact of the stylized fact of financial data is a continuing concern within the financial analysis literature especially in the context of transitory shocks to the stock market variables. Traditionally, these stylized have been addressed by the so-called asymmetrical GARCH-type models (Corbet & Katsiampa, 2018; Alqaralleh et al. 2020).
As highlighted to the introduction, the present study looks for fresh insights into the links between the Covid-19 pandemic and the model for testing volatility that is selected. Therefore, the following nonlinear GARCH-class models along with the best fitting distribution accounting for the skewness and excess kurtosis in return modeling are used.
Suppose that a Tadawul stock index returns on day (rt) and follows a white noise process such as
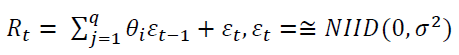 (1)
(1)
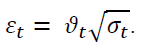 (2)
(2)
Following the seminal work of Hentschel (1995), the news impact in the return can be driven by allowing for both shifts (η1j) and rotations (η2j) to account for both small shocks (defined as asymmetry) while rotation drives large shocks. Various sub-models can be obtained from the model in equation 3. Higgins & Bera, (1992) proposed the nonlinear GARCH (NGARCH) model, in which a small shock is not different from large one, i.e. δ=λ. The NARCH model is obtained from equation 3 by setting λ=δ=2 and η1j=η2j=0.
 (3)
(3)
Ding et al. (1993) present the Asymmetric Power ARCH Model (APARCH) which delivers a general class of volatility models that well reveal Fat tails, Excess kurtosis, the Taylor effect, and Leverage Effects. Such a model as APARCH (1,1) can be expressed by equation 3 by applying the following conditions λ=δ, η2j=0 and |η1j |≤1. Among the nonlinear GARCH models, the GJR GARCH (1,1) model introduced by Glosten et al. (1993) can be derived when λ=δ=2 and η2j=0. Finally, Engle and Ng, (1993) propose the Nonlinear Asymmetric GARCH (NAGARCH) model in which the rotation parameter is eliminated, τ2=0 and δ=λ=2. Following the literature in this regard, the Generalized Hyperbolic Distribution (GHYP) is incorporated to brock down the standardizing and estimating density function. As highlighted by Alqaralleh et al. (2020) “This distribution is introduced to finance as a more realistic model for returns series in Eberlein (2001), Eberlein and Prause (2002).”.
Data And Estimation Results The stock market data under consideration have been drawn from the daily closing equity market price indices for Saudi stock exchange (or known as Tadawul) covered the period Sep. 2017 to Sep. 2020. The sample was carefully chosen to present only the significant event affecting the stock market, specifically, the COVID-19 pandemic. It is worth noting that the returns are calculated as the difference between the logarithms of the price index. Further, the missing data are bypassed by assuming them to equal the average of the recorded previous price and the next one. The descriptive statistics provides evidence that the return series is not only non-normally distributed with higher standard deviation, but also exhibits excessive kurtosis. Therefore, the nonlinear-GARCH models are suitable for modeling the volatility in this case. For the purpose of this study, the sample was split in two subperiods: the first with ?=551 including data from Sep. 20, 2017 to Dec 31, 2019, and the second subperiod including a sample of ?=167 including observations from Jan., 2nd 2020 to Sep. 17, 2020. For more robustness, a various type of nonlinear GARCH models and error distributions was adopted to obtain further in-depth information on the Tadawul market behavior.
The latter lead to leading to a total of 15 models estimated using a maximum likelihood. A comparison of these models was drawn on AIC(Akaike Information Criterion) and BIC(Bayes information criterion) to evaluate these models. Interestingly, specification results indicated that a GHYP distribution is best fitted specification for the innovation terms in almost all nonlinear GARCH considered in this study. Moreover, evidence suggest that there is a significant autocorrelation in the index return series discovered through the Q-statistic and thus an AR(1), specification was used following Ewing and Malik (2010). The results obtained from the nonlinear GARCH models are summarized in Table 1 and Table 2 for the time before and during the COVID-19 pandemic, respectively. What stands out in the bottom of these tables is that the validity of the reported results is guaranteed. In specific, the estimated parameters are stable over the time since the null hypothesis of zero variance of the error term is generally not rejected. These Results is further supported by sign bias tests of Engle and Ng, (1993) for misspecification of conditional volatility models that allows testing for the impact of positive and negative shocks on volatility not predicted by the model. In all cases, the nullity is generally not rejected as such there is no evidence that sign of the shocks play an important role in predicting the variable.
| Table 1 Estimation Nonlinear Garch Models for the Stick Market Indexes Under Consider Before the Covid-19 Outbreak | ||||
| NGARCH | NAGARCH | APARCH† | GJR-GARCH | |
| AR(1) | -0.157** | 0.046 | - 0.353** | 0.399** |
| -0.038 | -0.217 | -0.208 | -0.239 | |
| MA(1) | 0.339** | 0.17 | 0.185* | 0.203** |
| -0.137 | -0.215 | -0.027 | -0.143 | |
| α | 0.284* | 0.079** | 0.261** | 0.053** |
| -0.046 | -0.039 | -0.013 | -0.036 | |
| β | 0.739** | 0.763* | 0.723** | 0.829* |
| -0.24 | -0.027 | -0.238 | -0.019 | |
| γ | 0.659 | - | 0.873* | - |
| -0.78 | - | -0.021 | - | |
| δ | - | 1.117** | 1.024* | 0.972 |
| - | -0.603 | -0.173 | -0.65 | |
| Shape | 2.014* | 1.533** | -0.084 | 0.577** |
| -0.797 | -0.675 | -0.077 | -0.292 | |
| Skew | -0.094* | -0.363 | 0.868* | -0.771 |
| -0.012 | -0.854 | -0.036 | -2.92 | |
| Information Criterion | ||||
| Akaike | -8.452 | -8.492 | -8.943 | -8.495 |
| Bayes | -8.374 | -8.413 | -8.873 | -8.417 |
| Misspecification | ||||
| ARCH Lag[P] P | [0.285] | [0.346] | [0.621] | [0.642] |
| Weighted Ljung-Box P | [0.129] | [0.574] | [0.435] | [0.272] |
| Nyblom stability test | 5.592 | -6.007 | 2.315 | -3.582 |
| Sign Bias Test P | [0.180] | [0.281] | [0.465] | [0.495] |
| Note: Stat. between [] refer to p-values, † indicate the best fitted model as suggested by the information criterion., Sign. codes: ‘*’ 1%, ‘**’ 5%, ‘***’ 10%. |
||||
| Table 2 Estimation Nonlinear Garch Models for the Stick Market Indexes Consider During the Covid-19 Outbreak. | ||||
| NGARCH | NAGARCH† | APARCH | GJR-GARCH | |
| AR(1) | -0.596* | -0.560* | -0.596* | -0.603* |
| -0.013 | -0.091 | -0.087 | -0.093 | |
| MA(1) | 0.717* | 0.693* | 0.716* | 0.720* |
| -0.014 | -0.076 | -0.075 | -0.077 | |
Turning to the estimated results, broadly speaking almost all the variables are significant and have the expected sign. Further, it appears that the Tadawul stock return highly persistent since the magnitude of the estimated parameters β is relatively high. Similarly, the parameters of skew and shape (where applicable) are significant. Put in order, Panel A of Table 1 indicate the presence of Taylor effect in the return. Surprisingly, an inverted asymmetric effect was found during this time. This effect can be explained with herding of uninformed investors if prices go up and contrarian behavior of informed investors if prices go down.
The picture is changed during the COVID-19, in which NGARCH with a GHYP is the best fitted model, suggesting that the return series have a semi-heavy tail (introduce heavier tails and skewness) and, thus highly prone to news effect. Results in Panel A of Table 2 implies that the Covid-19 outbreak increased persistence in the stock market since the estimated parameters ? is greater in magnitude than the one in Table 1. Moreover, the leverage term (γ) are negative during this pandemic time, suggesting an unequal response to market innovations. That is to say, a positive return has less influence on future volatility than do negative returns.
Conclusion
In this study, we investigate the presence of conditional volatility in the Saudi Arabia stock market returns. The main novelty of our paper lies in distinguishing between regular time and during the Covid-19 pandemic. In other words, we show how the stock market return prone to news effect. To this end, the stock market data under consideration have been drawn from the daily closing equity market price indices for Saudi stock exchange (or known as Tadawul) covered the period Sep. 2017 to Sep. 2020. The sample was carefully chosen to present only the significant event affecting the stock market, specifically, the COVID-19 pandemic. The estimation results reveal evidence of an inverted asymmetric effect during the calm time before COVID-19 pandemic. However, strong evidence of news effect was detected as the health crisis began.
Acknowledgment
The authors extend their appreciation to the Deanship of Post-Graduate and Scientific Research at Dar Al Uloom University for funding this research.
References
- Abdalla, S.Z.S. (2012) Modelling stock returns volatility: Empirical evidence from Saudi stock exchange. International Res earch Journal of Finance and Economics, 85, 166-179.
- Abdalla, S.Z., & Winker, P. (2012). Modelling stock market volatility using univariate GARCH Models: Evidence from Su dan and Egypt. International Journal of Economics and Finance, 4(8), 161-176.
- Abdelhafez, M.E.M. (2018). Using GARCH models for modelling and forecasting volatility an empirical study of the Egy ptian Stock Market. European Journal of Social Sciences, 57(2), 167-178.
- Al Freedi, A., Shamiri, A., & Zaidi Isa, Z. (2012) A study on the behavior of volatility in Saudi Arabia stock market using s ymmetric and asymmetric GARCH Models. Journal of Mathematics and Statistics, 8(1), 98-106.
- Al Rahahleh, N. & Kao, R. (2018) Forecasting volatility: Evidence from the Saudi Stock Market. Journal of Risk and Finan cial Management, 11(4), 84.
- Al Rahahleh, N. (2014). Modeling and forecasting equity market volatility: An Empirical Evidence. Journal of Applied Stati stical Science, 22(3/4).
- Aliyev, F., Ajayi, R., & Gasim, N. (2020). Modelling asymmetric market volatility with univariate GARCH models: Eviden ce from Nasdaq-100. The Journal of Economic Asymmetries, 22, e00167.
- AL-Najjar, D. (2016) Modelling and estimation of volatility using ARCH/GARCH Models in Jordan's stock market. Asian Journal of Finance & Accounting, 8(1), 152-167.
- Alqaralleh, H., Abuhommous, A.A., & Alsaraireh, A. (2020). Modelling and forecasting the volatility of cryptocurrencies: A comparison of nonlinear GARCH-Type Models. International Journal of Financial Research, 11(4).
- Amudha, R., & Muthukamu, M. (2018). Modeling symmetric and asymmetric volatility in the Indian stock market. Indian J ournal of Finance, 12(11), 23-36.
- Angabini, A., & Wasiuzzaman, S. (2011). GARCH models and the financial crisis-A study of the Malaysian. The Internatio nal Journal of Applied Economics and Finance, 5(3), 226-236.
- Assous, H.F., Al-Rousan, N., AL-Najjar, D., & AL-Najjar, H. (2020). Can international market indices estimate TASI’s Mo vements? The ARIMA Model. Journal of Open Innovation: Technology, Market, and Complexity, 6(2), 27.
- Bhowmik, R., & Wang, S. (2020). Stock market volatility and return analysis: A systematic literature review. Entropy, 2(5), 522.
- Bonga, W.G. (2019). Stock market volatility analysis using GARCH family models: Evidence from Zimbabwe stock excha nge. MPRA Paper, 94201.
- Cheteni, P. (2016). Stock market volatility using GARCH models: Evidence from South Africa and China stock markets. Jo urnal of Economics and Behavioral Studies, 8(6), 237-245.
- Chimrani, C.R., Ahmed, F., & Panjwani, V.K. (2018). Modeling sectoral stock indexes volatility: Empirical evidence from Pakistan stock exchange. International Journal of Economics and Financial Issues, 8(2), 319-324.
- Corbet, S., & Katsiampa, P. (2018). Asymmetric mean reversion of Bitcoin price returns. International Review of Financial Analysis, 71, 101267.
- Ding, Z., Granger, C.W., & Engle, R.F. (1993). A long memory property of stock market returns and a new model. Journal of Empirical Finance, 1(1), 83-106.
- Eberlein, E. (2001). Application of generalized hyperbolic Lévy motions to finance. In Lévy Processes,319-336.
- Eberlein, E., & Prause, K. (2002). The generalized hyperbolic model: financial derivatives and risk measures. In Mathemati cal Finance—Bachelier Congress 2000, 245-267.
- Engle, R. (2001). GARCH 101: The use of ARCH/GARCH models in applied econometrics. Journal of Economic Perspect ives, 15(4), 157-168.
- Engle, R.F., & Ng, V.K. (1993). Measuring and testing the impact of news on volatility. The Journal of Finance, 48(5), 174 9-1778.
- Ewing, B.T., & Malik, F. (2010). Estimating volatility persistence in oil prices under structural breaks. Financial Review, 45
- (4), 1011-1023.
- Frimpong, J.M., & Oteng-Abayie, E.F. (2006). Modelling and forecasting volatility of returns on the Ghana stock exchange using GARCH models. MPRA Paper, 593.
- Gabriel, A.S. (2012). Evaluating the forecasting performance of GARCH models evidence from Romania. Procedia Social and Behavioral Sciences, 62, 1006-1010.
- Glosten, L.R., Jagannathan, R., & Runkle. D.E. (1993) On the relation between the expected value and the volatility of the n ominal excess return on stocks. Journal of Finance, 8(5), 1779-1801.
- Gokbulut, R.I., & Pekkaya, M. (2014). Estimating and forecasting volatility of financial markets using asymmetric GARCH models: An application on Turkish financial markets. International Journal of Economics and Finance, 6(4), 23-35.
- Goudarzi, H., & Ramanarayanan, C.S. (2011). Modeling Asymmetric Volatility in the Indian Stock Market. International J ournal of Business and Management, 6(3), 221-231.
- Hamadu, D., & Ibiwoye, A. (2010). Modeling and forecasting the volatility of the daily returns of Nigerian insurance stocks.
- International Business Research, 3(2), 106-116.
- Hansen, P.R., & Huang, Z. (2016). Exponential GARCH modeling with realized measures of volatility. Journal of Busines s & Economic Statistics, 34(2), 269-287.
- Hentschel, L. (1995) . All in the family nesting symmetric and asymmetric GARCH models. Journal of financial economics, 39(1), 71-104.
- Higgins, M.L., & Bera, A.K. (1992). A class of nonlinear ARCH models. International Economic Review, 33(1), 137-158. Hou, A.J. (2013). Asymmetry effects of shocks in Chinese stock markets volatility: A generalized additive nonparametric approach. Journal of International Financial Markets, Institutions and Money, 23, 12-32.
- Jianguo, W., & Qamruzzaman, M. (2016). Estimating Stock Market Volatility with Asymmetric Arch, GARCH and Expan ded GARCH Models. GARCH and Expanded GARCH Models.
- Kalyanaraman, L. (2014) Stock Market Volatility in Saudi Arabia: An application of univariate GARCH Model. Asian Soci al Science, 10(10), 142-152.
- Kang, S.H., Kang, S.M., & Yoon, M.Y. (2009). Forecasting volatility of crude oil markets. Energy Economics, 31(1), 119-1 25.
- Koima, J.K., Mwita, P.N., & Nassiuma, D.K. (2015). Volatility estimation of stock prices using Garch method. European J ournal of Business and Management, 7(19), 108-113.
- Kovacic, Z. (2007). Forecasting volatility: Evidence from the Macedonian stock exchange. MPRA Paper, 5319.
- Kumar, R., & Dhankar, R.S. (2010). Empirical analysis of conditional heteroskedasticity in time series of stock returns and asymmetric effect on volatility. Global Business Review, 11(1), 21-33.
- Luo, L., Pairote, S., & Chatpatanasiri, R. (2017). GARCH-type forecasting models for volatility of stock market and MCS t est. Communications in Statistics-Simulation and Computation, 46(7), 5303-5312.
- Magweva, R., & Sibanda, M. (2020). Modeling and forecasting the volatility of returns in the infrastructure sector in emergi ng markets. Eurasian Journal of Business and Economics 13(25), 37-52.
- Maqsood, A., Safdar, S., Shafi, R., & Lelit, N.J. (2017). Modeling stock market volatility using GARCH models: A case stu dy of nairobi securities exchange (NSE). Open Journal of Statistics, 7, 369-381.
- Matei, M., Rovira, X., & Agell, N. (2019). Bivariate volatility modeling with high-frequency data. Econometrics, 7(3), 41.
- McMillan, D., Speight, A., and Apgwilym, O. (2000). Forecasting UK stock market volatility. Applied Financial Economic s, 10(4), 435-448.
- Mhmoud, A.S., & Dawalbait, F.M. (2015). Estimating and forecasting stock market volatility using GARCH models: Empi rical evidence from Saudi Arabia. International Journal of Engineering Research & Technology, 4(2), 464-471.
- Michae, W.B., & Christopher, S.J. (2006). Volatility forecasting with range-based EGARCH models. Journal of Business & Economic Statistics, 24(4), 470-486.
- Miron, D., & Tudor, C. (2010). Asymmetric conditional volatility models: Empirical estimation and comparison of forecasti ng accuracy. Romanian Journal of Economic Forecasting, 13(3), 74-92.
- Naseem, S., Mohsin, M., Zia-ur-Rehman, M., & Baig, S.A. (2018). Volatility of Pakistan stock market: A comparison of Ga rch type models with five distribution. Amazonia Investiga, 7(17), 486-504.
- Ndwiga, D., & Muriu, P.W. (2016). Stock returns and volatility in an emerging equity market. Evidence from Kenya. Europ ean Scientific Journal, 12(4), 79-98.
- Ng, H.G., & McAleer, M. (2004). Recursive modelling of symmetric and asymmetric volatility in the presence of extreme o bservations. International Journal of Forecasting, 20(1), 115-129.
- Obaid, S., & Suliman, A. (2013). Estimating stock returns volatility of khartoum stock exchange through GARCH Models.
- Journal of American Science, 9(11), 132-144.
- Panait, I., & Slavescu, E.O. (2012). Using GARCH-IN-mean model to investigate volatility and persistence at different freq uencies for Bucharest Stock Exchange during 1997-2012. Theoretical & Applied Economics, 19(5), 55-76.
- Patev, P., & Kanaryan, N.K. (2003). Stock market volatility changes in Central Europe caused by Asian and Russian financi al crises. Tsenov Academy of Economics Department of Finance and Credit, Working Paper, (03-01).
- Patev, P., Kanaryan, N., & Lyroudi, K. (2009). Modelling and forecasting the volatility of thin emerging stock markets: the case of Bulgaria. Comparative Economic Research, 12(4), 47-60.
- Rousan, R., and Al-Khouri, R. (2005). Modeling market volatility in emerging markets in the case of daily data in amman s tock exchange 1992-2004. International Journal of Applied Econometrics and Quantitative Studies, 2(4), 99-118.
- Shaik, A., & Syeda, A. (2019). Intraday return volatility in Saudi Stock Market: An evidence from tadawul all share index. Management Science Letters, 9(7), 1131-1140.