Research Article: 2021 Vol: 24 Issue: 6S
The Analysis of the Regional Economic Potential of 10 Regencies in the Central Highlands of Papua Province (La-Pago Customary Area)
Mesak Iek, University of Cendrawasih
Abstract
This study aimed to identify the leading sectors in ten regencies in Papua province's central highlands (La-Pago customary area) that are expected to drive regional economic growth. To measure the macroeconomic performance of regencies in the La-Pago Customary area of Papua Province, the researcher used several data analysis methods, including; Dynamic Location Quotient (DLQ) and Shift-Share Analysis (SSA). The primary sector (Agriculture, Forestry, and Fisheries) as well as government administration and defense, and mandatory social security, are generally sectors that foster economic development and contribute to the well-being of the people in the La-Pago Customary area. The economic sectors with the fastest growth occur as a result of policies and programs. It is critical for local governments, particularly in Papua province, to reorganize policies and work programs that strengthen the primary sector, including agribusiness system. The government needs to collaborate with ten regency governments to support the sectors that drive economic growth.
Keywords:
Regional Economic, Economic Growth, Papua Province's
Citation Information:
Lek, M. (2021). The analysis of the regional economic potential of 10 regencies in the central highlands of Papua province (LA-PAGO customary area). Journal of Management Information and Decision Sciences, 24(S6), 1-19.
Introduction
Economic growth is a key indicator of a region's development success (Reniati et al., 2020). Regional economic growth is a critical factor driving regional development and is expected to have an overall multiplier effect on various aspects of regional residents' lives. This economic growth explains why some regions experience faster growth than others that remain stagnant (Sjafrizal, 2008; 2009). Economic growth is generally defined as the process of economic change that occurs in the economy of a region or country over time in the form of an increase in production capacity, which is accomplished through an increase in national or regional income. Rapid economic growth is associated with a large number of persons engaged in productive commercial activity (Primandari & Dahlia, 2020). Economic growth is also a term that refers to the process of economic change that occurs in a country's economy over a specified period toward better economic conditions. It is based on the process of boosting the production of products and services through the economic activities of the community (Nairobi et al., 2021). Meanwhile, economic growth in the regional economy is synonymous with increasing production capacity, accomplished through increased national income.
Economic development is critical, and thus until now, the development process planned and implemented by developed and developing countries has had as its primary objective achieving high economic growth in addition to development in other fields. As a result, each country or region within a country always establishes its own economic growth targets. Economic development is one of the benchmarks for assessing a region's development across various economic sectors and indirectly describes the region's level of economic change (Saerofi, 2005, in Vivi Erlinda Thio Putri & Made Kembar Sri Budhi). For instance, Indonesia consistently presses each region (region) to establish annual economic growth targets because rapid regional economic growth will increase the number and variety of job opportunities, which is expected to gradually improve the community's welfare (Sjafrizal, 2008; Lincolin, 2002; Dadi, 2011). As a result, studying the structure and determinants of regional economic development becomes critical for provincial, regency, and city governments. In Indonesia, this economic development is critical for promoting and accelerating regional development and improving social welfare. The region or territory in question is a province in Indonesia, along with the regions that comprise it. Each region's capacity for development can be influenced by a variety of interrelated and influencing factors. Increasing the efficiency in local governments and producing and distributing public goods will boost economic growth and social welfare (Aryadi et al., 2021). These factors must be thoroughly investigated and detailed, including the magnitude of each variable or factor affecting a region's economic growth.
This situation exists in the Papua province, where the concept of development is based on five traditional areas: Mamta/Tabi, Saireri, Lapago and Meepago, and Ha-Anim, with development achievements varying between these regions. The Lapago region, in particular, faces unique challenges compared to other regions, including challenging access, which has a detrimental effect on the region's development. This is demonstrated by BPS data from Papua Province (2019), which indicates that the province's poor population increased to 926.63 thousand people in 2019, up from 917.63 thousand people in 2018. The Lapago customary area had a poor population of 462.81 thousand people in the same year (2019). This data demonstrates that the LaPago area contributed nearly 50% to the poor population in Papua province in 2019. Starting with this data on the number of poor people, a unique policy strategy is needed to promote development that addresses the root causes of the region's problems, most notably encouraging regional economic growth based on the region's potential. Economic development can contribute to a higher standard of community life, and the critical factor is identifying the leading sectors as the engine of the economy in the La-Pago area. Because this leading sector, with adequate investment support, has the potential to grow faster than other sectors. According to Rachbini (2001), investment opportunities are expected to stimulate the potential of each region's leading sectors because they are critical to a region's economic development and do not necessarily refer to their geographical location. Economic prospects are economic opportunities belonging to regions and should be developed to grow and develop into an economic driving engine that increases people's income.
Study Objective
The purpose of this study is to identify the leading sectors in ten regencies in Papua province's central highlands (La-Pago customary area) that are expected to drive regional economic growth.
Theoretical Study
In theory, there are two widely used concepts of regional development and others that can be used in conjunction with them: 1. The economic basis concept presupposes that demand for inputs can increase in lockstep with the expansion of demand for output produced by the leading sector in a growing area. Thus, regional exports are a critical factor in regional development, according to this sector-based theory. 2. The concept that assumes differences in rate of return are more likely to be influenced by differences in the environment or infrastructure than by an imbalance in the capital-labor ratio. According to this view, regions that are less developed do not lack economic potential, but rather because productivity has not been maximized. As a result, investment in sound infrastructure will spur growth in the basic sector, which serves as the engine of the regional economy. There are, however, few empirical studies that employ this second concept (Ernan, et al., 2011). Economic potential in a region refers to the ability of natural resources owned by the region to be developed in such a way that they grow and develop and even add economic value, thereby providing a source of livelihood for the region's local communities. According to Widodo (2006), leading sectors can stimulate growth in other sectors, both those that provide inputs and those that consume their outputs. Gunnar Myrdal, like many others before him, stated that when an area begins to grow and develop, a trickle-down effect occurs, in which people, human capital, and physical capital (infrastructure, finance, machinery, and so on) from other regions are attracted to the growth center (trickle down effect). As a result, the leading sector is frequently associated with comparisons, whether regional, national, or international. In the international context, a sector is said to be superior if it is capable of competing with other countries in the same sector. Meanwhile, at the national level, a sector can be categorized as a leading sector if the sector in an area is able to compete with the same sector produced by other regions, both in the national and domestic markets. A region will have a superior sector if it can overcome competition from other regions in the same sector in order to produce exports (Suyanto, 2000). The leading sector in an area is closely related to the GRDP data of the area concerned.
The leading sector is capable of stimulating growth in other sectors, both those that supply inputs and those that use their outputs as inputs in the manufacturing process. As a critical component of regional economic development, the leading sector does not simply refer to geographic location; it is a sector that spans multiple economic sectors and is capable of moving the economy as a whole. The characteristics of advantageous sectors are as follows: (1) This sector experiences rapid economic growth. (2). This sector has a sizable distribution network. (3). This sector has a high degree of inter-sectoral connectivity, both forward and backward. (4). This sector is capable of generating significant added value. The basic economic model states that a region's economic growth is determined by its exports, which can be in the form of goods and services, including labor, but can also be spent by foreign residents on immovable goods, such as those related to geography, climate, historical heritage, and tourist destinations, to name a few (Tarigan, 2014; Sugeng, 2001). The Location Quotient (LQ) is a frequently used method for determining whether a sector is fundamental or non-fundamental. LQ compares the sector's role in a given area to the sector's role nationally or provincially (Tarigan, 2014). The sector being compared in the regions must be identical to the sector being compared at the national or provincial level, and the timing of the comparisons must also be identical.
Previous Research
Numerous studies demonstrate that the leading sector in a region is capable of driving economic growth and enhancing the welfare of its residents, for example, research conducted by Nurlanova, et al., (2009) on the topic: Evaluation of Economic Potential and Level of Concentration in Kazakhstan's Regions concluded that: the critical factor in the regional economy (region) is concentration. In Kazakhstan, however, what is occurring is product specialization and new knowledge that results in product distribution, thereby reducing reliance on raw materials from other regions. Additionally, Suryahadi, et al., (2009) found that while the growth of economic activity and other social services in rural areas can help alleviate poverty, growth of the service sector in urban areas has a more significant impact on poverty. The agricultural sector made a significant contribution to poverty reduction, and it was also discovered that the agricultural sector in rural areas significantly reduced rural poverty, which was the primary cause of poverty in Indonesia. Additionally, it was discovered that the service sector has a sizable impact on poverty reduction. As a result, both urban and rural areas, including the newly developed La-Pago area, are increasingly driven by the service sector in order to accelerate poverty alleviation.
Nasir M. conducted a study with the title: Analysis of the Effect of the Economic Sector Having an LQ Value>1 on Improving the Welfare of Urban Communities in North Sumatra. The results of this study found that several sectors have LQ values>1 that affect the welfare level of urban communities in North Sumatra, among others: the building sector, the trade sector, the transportation sector, and the service sector. These sectors can improve the welfare of the people of cities in North Sumatra Province.
The same study was also carried out by Wafiyulloh Mubarrok, with the topic: Analysis of Leading Sector-Based Regional Development and Its Development Strategy (Case Study of Ogan Komering Ulu Regency in 2010-2014. This study shows that the leading sectors in Ogan Komering Ulu Regency include the electricity and gas procurement sector and the construction sector are the leading sectors both at the provincial and regency levels because they have high growth compared to other economic sectors. Shift Share analysis shows that Ogan Komering Ulu Regency experiences fluctuations every year. Overlay analysis results show that the agriculture, forestry, fisheries, and other service sectors are the leading sectors in Ogan Komering Ulu Regency. Furthermore, a study conducted by Vivi E. Thio Putri and Made Kembar Sri Budhi with the topic: Analysis of the Existence of the Regency/City Economic Sector in Bali Province, with a quantitative approach (LQ and Linear Trend) with the independent variable the rate of economic growth in Bali 2013-2018 and the independent variable GRDP of the Province of Bali 2013-2018. This study found that the Agriculture, Forestry, and Fisherie; Mining and excavation; Water Supply, Waste Management, Waste and Recycling; Construction; Processing industry; Transportation and Warehousing; Provision of Accommodation and Food and Beverages; Wholesale and Retail Trade, Car and Bicycle Repair are the basic sectors in 4 regencies in Bali Province, namely: Jembrana, Badung, Klungkung, and Karangasem Regencies and simple regression calculations show significant results that there is a positive relationship between economic growth and economic potential.
Fretes (2018), conducted a study entitled: Analysis of Leading Sector (LQ) Economic Structure (Shift Share) and Projection of Gross Regional Domestic Product of Papua Province 2018. Using secondary data with analysis tools; (1). Location Quotient (LQ), (2). Shift-share Analysis and (3) Projection. The analysis results found seven leading sectors (basic): Mining and Excavation; Electricity and Gas Procurement; Construction; Transportation and Warehousing; Corporate services; Government Administration, Defense, Social Security; Health Services and Social Activities. (b). The largest part of the economic structure of Papua Province is the Processing Industry of 2259.90, while the smallest is Drinking Water, Waste Management, and Waste of 3.2. Proportional Shift has eight negative sectors. Differential Shift has six negative sectors. (c). The projection of the Papua Province's 2018 Gross Regional Domestic Product is 167,351.61 billion rupiahs. This latest study proves that there are several leading sectors in general in Papua and have not shown leading sectors based on the La-Pago customary area in the mountainous region.
Through an analysis of real and accurate data, it is determined that potential regional sectors will make it easier for local governments, both provincial and regency and city, to plan programs and activities to promote economic growth and thus increase local residents' income. If this is done correctly, the level of welfare for the people in the area will improve and prosperity will be realized, which is exactly what we want in the La-Pago customary area of Papua province.
Research Methodology
Scope
The research scope was determined by reviewing the literature, including 2011 and 2019 Gross Regional Domestic Product (PDRB) data based on 2010 Constant Prices obtained from Statistics Indonesia (BPS) and Bank Indonesia reports. The study focuses on the indigenous community of La-Pago.
Research Sites
The area used as the location of this research is the La-Pago Indigenous area which consists of 10 regencies spread across the regions of the central highlands, namely: (1) Jayawijaya Regency, (2) Lanny Jaya, (3) Tolikara, (4) Pegunungan Bintang, ( 5) Yahukimo, (6) Nduga, (7) Puncak Jaya, (8) Puncak, (9) Yalimo, and (10) Mamberamo Tengah
Data Collection Technique
Secondary data, specifically data and information about development performance as measured by the 2010 Constant Price GRDP, were required for this study. The data were based on the business sector from 2011 to 2019. It was to understand better the economic shifts that have occurred over the last nine years and to identify sectors with the potential to develop in mountainous areas. Additionally, the researchers limited the data to 2019 only because the final year of 2020 was a year in which the Indonesian economy experienced a severe contraction due to the global financial crisis. 19. A literature search was used to collect data for this study.
Data Analysis Tools
To measure the macroeconomic performance of regencies in the La-Pago Customary area of Papua Province, the researcher used several data analysis methods, including; Dynamic Location Quotient (DLQ) and Shift-Share Analysis (SSA).
Dynamic Location Quotient (DLQ) Method
This DLQ method made use of data on GDP changes over a nine-year period, from 2011 to 2019. This model was used to identify sectors that have the potential to grow as economic drivers in the Lapago Customary area by comparing changes in sectors in ten regencies in the Lapago region to changes in the same sector in Papua province. The fundamental data set is the 2010 GRDP at constant prices. The following formula can be used to conduct the analysis:
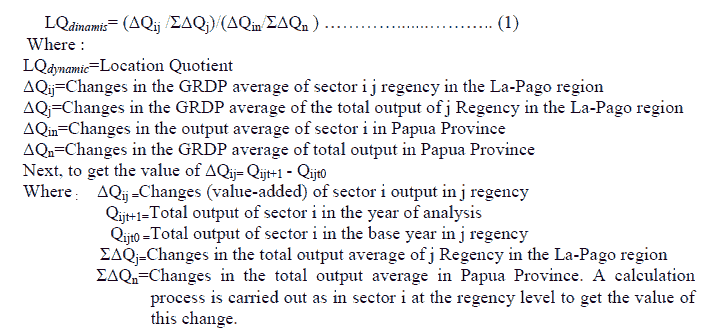
Where: if;
DLQi>1, it means that the potential of sector i in specific regencies is greater than the sector's overall potential at the provincial level in Papua.
DLQi<1, it means that the potential for sector advancement is less developed at the regency level than at the provincial level.
DLQi=1, it means that the potential for sector i development in the Lapago area is the same as the development of the same sector at the provincial level.
(Yuwono in Nazipawati, 2007; Titisari, 2009)
Shift-Share Analysis Method
The shift-share method is used to analyze economic sector performance in ten regencies in the central highlands region in order to determine which sectors have competitive advantages and specialization. This technique measures growth as a change in regional variables over time, including changes caused by regional growth's influence on industry mix, competitive advantage, and competition.
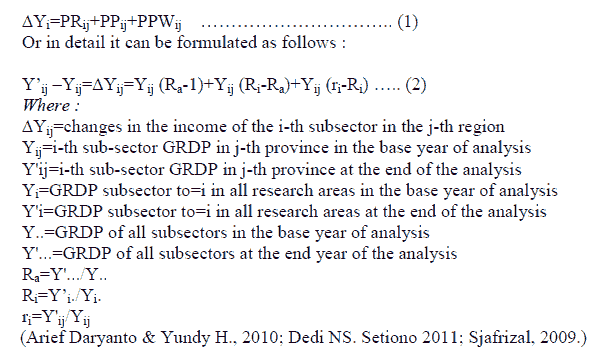
The shift-Share analysis is divided into three (3) decomposition variables which are components of Yj deviation, namely: (1) Regional Growth Component (PR), where Regional Share (PR) : [yi (Yt/Y0 – 1)]=is a component of regional economic growth caused by external factors, namely: increased regional economic activities due to national policies that apply to all regions (2) Components of Proportional Growth (PP), Proportionality Shift (Mix Shift)- (PP): [yi (Yit/Yio) – (Yt/Y0)]=component of regional economic growth caused by a good economic structure of a region, which specializes in fast-growing sectors such as the industrial sector and (3) Regional Share Growth Component (PPW). Differential Shift- (PPW) : [yi (yi/yio ) – (Yit/Yi0)]=components of regional economic growth due to regional specific competitive conditions. This element of growth is a regional competitive advantage that can encourage regional export growth so that the following equation can be shown:
Analysis Results
The La-Pago Customary area consists of 10 regencies, namely: Yahukimo, Pegunungan Bintang, Tolikara, Nduga, Lanny Jaya, Mamberamo Tengah, Yalimo, Puncak, Puncak Jaya and Jayawijaya Regencies, with the largest dominant contribution from government administration, defense and social security sectors by 21.96 percent, followed by the construction sector by 20.36 percent and the Agriculture, Forestry and Fisheries sector by 20.15 percent. This means that economic growth in the La-Pago Indigenous area is driven more by these three (3) main sectors and is supported by two (2) other sectors. This is understandable given the area's recent development following the implementation of special autonomy in Papua. Two (two) sectors, namely automobile and motorcycle repair and transportation and warehousing, can be developed in accordance with regional characteristics. While the drinking water sector contributed the least, waste management, waste and recycling contributed 0.014 percent, and electricity and gas procurement contributed 0.034 percent (Figure 1).

Figure 1: Percentage Of Contribution Per Sector To The Economy Of The La-Pago Customary Area 2019 (Central Mountains Region Of Papua Province)
Source: BPS Papua Province 2019 processed in 2021
Determination of Economic Sectors that have a Location Quotient (LQ)>1
In addition to using the contribution of the sector to the formation of the regency's GRDP, the Location Quatient (LQ) approach can also be used to measure which sectors can have an influence/contribution to the level of community welfare in 10 regencies in the La-Pago Indigenous area, the following can be analyzed using the added value of the economic sector with the Dynamic Location Quatient (DLQ) approach, where the economic sector has a DLQ greater than one (1) which can improve the welfare of the people in the mountainous region of La-Pago. This can happen because the sector can be produced by the local community efficiently and the production results in meeting the needs of the local community but can also be exported to meet the demands of people outside the region. The exported products have an impact on increasing income for the local community and this means that it can encourage the growth of investment made by the community and is expected to increase the demand for capital goods and labor, which in turn has an impact on improving the welfare of the people in the region. Determination of the economic sector that has a DLQ coefficient>1, can be determined using the Location Quation (LQ) formula approach using the 2010 constant price Gross Regional Domestic Product (GRDP) data based on regional economic sector data. So that the economic data of certain sectors in the regency is compared with the economic data of certain sectors at the provincial level to get the LQ value.
Based on the results of calculations carried out in 10 regencies in the La-Pago customary area using the added value of GRDP based on 2010 constant prices, analysis data from 2011 to 2019 found several sectors with a DLQ value >1. Analysis of the data in Table 1 shows that the economic sector that has a DLQ value greater than one in 10 regencies in the mountainous region of La-Pago shows 2 sectors, namely: Agriculture, Forestry and Fisheries and the fields of Government Administration, Defense and Social Security that are economic sectors, which have a DLQ value >1 almost evenly distributed in 10 regencies, except for Jayawijaya and Mamberamo Tengah regencies which have DLQ values in the Agriculture, Forestry, and Fisheries sectors smaller than 1, specifically 0.71 and 0.84. This means that, in general, these two sectors drive economic growth and are able to improve the welfare of the people in the La-Pago Indigenous area. Furthermore, if measured by regency, it appears that Jayawijaya regency has 11 sectors that have a DLQ> 1 value, namely: information and communication sector (2.59), Electricity and Gas Procurement (2.59), Corporate Services (2.56), Industrial Processing (2.46), Transportation and Warehousing (2.12), Financial Services and Insurance (2.13), Provision of Accommodation and Food and Beverages (1.86), Real Estate sector (1.66), Mining and Excavation (1.31), Wholesale and Retail Trade sector; Car and Motorcycle Repair (1.53), Government Administration, Defense and Mandatory Social Security (1.06) as well as several potential sectors such as other service sectors and Health Services and Social Activities. These economic sectors are the driving sectors of economic growth that have improved the welfare of the people in the Jayawijaya regency for the last 9 years. Jayawijaya Regency is also a regency whose economic sectors have the highest DLQ>1 value in the La-Pago Indigenous area. Then followed by Lanny Jaya Regency, 7 sectors have a DLQ>1, meaning that there are 7 economic sectors as drivers of economic growth in Lanny Jaya Regency for the last 9 years, namely: Agriculture, Forestry, and Fisheries; Real Estate sector; mining and excavation sector; educational service sector, health service sector and social activities; and real estate sector. While the regency that has the least economic sector as an economic driving sector is Puncak Regency, only 3 sectors as the driving force of the regional economy, namely: Agriculture, Forestry and Fisheries, Government Administration Sector, Defense and Mandatory Social Security, mining and excavation sector, real estate sector, and the construction sector, this is reasonable because this regency is a newly created regency whose territorial access is challenging to reach and the topography of the area is challenging to develop efficiently. The results of this DLQ show that the economic development from the non-base sector to the basic sector or vice versa follows the age of development of a regency area. This is in line with the Neoclassical model, which assumes that the movement of production factors at the beginning of the growth process in an area is always not smooth. This condition is because production factors are always concentrated in more developed areas because they have adequate infrastructure that can facilitate business processes (Nasir M. 2015). This condition is seen in Jayawijaya Regency, an economic sector with a DQL value>1 compared to other regencies in the Lapago mountainous area. as shows in Table 1.
| Table 1 Dynamic Lq Values Per Sector In 10 Regencies In The La-Pago Indigenous Mountains Region |
||||||||||
|---|---|---|---|---|---|---|---|---|---|---|
| Sector | Dynamic LQ based on Per-Regency Average Growth in La-Pago Indigenous Territories | |||||||||
| DLQ | ||||||||||