Research Article: 2020 Vol: 24 Issue: 3
The Application of The Logistic Model in Analyzing the Risk of Bankruptcy of Small and Medium Enterprises (SMEs): A Case Study
Dao Thi Thanh Binh, Hanoi University
Bui Thi Thu Loan, Hanoi University of Industry
Vu Thi Kim Anh, Trade Union University
Abstract
Using the data of 46 unlisted small and medium enterprises divided into two categories, consisting of 23 bankrupted and non-bankrupted enterprises, the study examined some aspects of bankruptcy risk prediction based on the logistic regression model to identify the most important financial factors related to viability of small businesses. The most notable findings of the study are that businesses in suburban areas are at a higher risk of bankruptcy than firms concentrated in the central districts. The age of enterprises also affects the risk of bankruptcy. For financial indicators, the research results show that economic profitability, firm size, revenue growth and sales to capital investment are important and meaningful factors related to forecasting the exhaustion. Small businesses truly face financial crises in the context of the transition economy, developing along with the young financial market in Vietnam today. Based on the research results, some limitations and further research directions are also proposed.
Keywords
Bankruptcy Prediction, SMEs, Financial Ratios, Financial Distress, Logistic Regression Analysis.
Introduction
Financial difficulty prediction during operation always receives the attention of researchers, businesses, credit institutions and management agencies. Bankruptcy prediction models are one of the useful tools to help those interested to monitor the health of banks, financial institutions and businesses. Based on the predictions of the financial exhaustion risk of businesses, credit institutions or suppliers can estimate the values and assess credit ratings, thereby considering loaning decisions and whether to expand or limit credits by each business.
One of the classic studies building up the foundation for future bankruptcy prediction models was the analysis of financial ratios carried out by Beaver (1967). The research result has shown financial indicators significant in differentiating between bankrupt and non-bankrupt businesses. However, the development of bankruptcy prediction models has received the attention since 1968 with Altman’ Z score model, using discriminant analysis. The following studies, with necessary modifications for the private business and non-manufacturing sector (Altman, 1999), has contributed in preserving the practical scientific meaning of the Z score bankruptcy prediction model until present day. The most recent studies (Lian et al, 2016; Almany, 2015; Tian, 2017 and Alaka et al, 2018) were still focusing on proposing the solutions for the model to be better applied on each economic circumstance/context or using more modern analysis techniques to reduce the error of type II in prediction (classifying the company as bankruptcy when it does not fail) as well as increasing the accuracy in prediction a longer time before.
Recent bankruptcy forecasting techniques focus the analysis on the use of artificial intelligence applications (AI) in forecasts with machine learning models, intensive machine learning or artificial neural network. However, the warning of risk can reduce the effectiveness in analyzing and interpreting results because of the excessive complexity of the model given by Laitinen (2000). This issue truly needs to be considered when analyzing data in emerging economies, in which research and related research materials are limited. Then, the logistic regression analysis model may be a more suitable choice because:
1. This model overcomes the limitations of linear multivariate regression analysis model.
2. It increases interpretation capacity of analysis results in the context of limited research in a specific research context.
The approach of this study is to use a composite model between failed businesses and businesses that fail through the use of financial indicators primarily. Based on the confirmatory evidence of the Z score model, it is considered appropriate to predict bankruptcy potentials and measure the current situation in emerging markets (Zaabi & Obaid, 2011; Almamy, 2015). The research results indicate that the financial ratios of profitability, revenue growth, net sales to total capital (SOCI) and asset turnover are considered the most important indicators in bankruptcy forecast.
The following contents of the article are arranged as follows: Part 2 presents an overview of literature review; the sections 3 and 4 present the research methodology and empirical results in turn; and the section 5 provides conclusions, policy implications and future research directions.
Literature Review
The documents involving bankruptcy date back to the 1930s with the very first studies using financial ratios in analysis (Fitzpatric, 1932). This method was still applied during the 1960s, in the well-known study of Bevear (1967), named univariate analysis techniques. Although this analytical method has certain limitations, these studies have contributed significantly in pointing out that, in most case, while successful companies show favorable financial ratios, failed businesses indicate signs of financial distress. In other words, when comparing between successful companies and failed companies, the latter often shows many weaknesses during the period of 4 to 5 years before bankruptcy. These judgments are the premises for establishing subsequent models of bankruptcy prediction.
The preliminary study by Altman (1968) used the multivariate analysis model in bankruptcy prediction. This study shows five selected variables in the list of research variables that play an important in the prediction of corporate failure, named the Z- score model. These variables include: Working capital / Total Assets; Retained earnings on total assets; Profit before tax and interest on total assets; Market value of equity on the book value of the total capital and asset turnover. Based on the application of Z score model, subsequent studies performed by Altman et al (1995), Altman (2000) continued to confirm the science of the model, but also suggested the necessity of adjustment for different economic sectors, economic context and different time segments. Based on this approach, studies have expanded the original Z- score model by providing evidence of the role of cash flow ratio during the financial crisis period (Almamy et al, 2015). In addition, the findings given by Liang et al (2016) in their study emphasized the role of liquidity and profitability indicators. Using the data on an international level, the results given by Tian & Yu (2017) indicates that three variables including Retained earnings / Total assets, total debt / total assets and short-term debt / revenue is possible to forecast well in the Japanese market, while the equity ratio on total capital is the appropriate choice for different methods in failure prediction for European countries.
Thus, despite the recognition of the role the Z -score model plays in predicting bankruptcy, the results lack similarities between different economic institutions. This observation is consistent with the suggestions of Altman (2000) and Liang et al (2016). Therefore, even the research model given by Altman et al (1995); Zaabi & Obaid (2011) on predicting financial distress of companies in emerging economies can also be difficult to represent and apply to the context of the Vietnamese economy due to the differences in accounting practices, enterprise characteristics changing over time and existing studies using listed firm sample may not represent small and medium enterprises that do not use capital from the stock market.
In terms of research methods, the use of discriminant analysis in most existing studies since initial Altman study (1968) overcomes the weaknesses of univariate analysis. However, when using a linear multivariate model to predict the bankruptcy of companies, the discontinuous characteristics of the dependent variable can lead to certain limitations by heteroscedasticity test to the model's noise class and this method does not take into account the constraint that the probability must lie between {0; 1} besides the problems of the normal distribution and the assumption of linear relationship between independent variables with dependent variables (Gujarati, 2011). The solution is the logistic model. In fact, some current studies tend to apply artificial intelligence (AI) in analyzing data by using modern methods such as machine learning or neural network. These methods, on one hand, can help improve the probability of earlier prediction before bankruptcy with higher classification accuracy (Liang et al, 2016; Tian & Yu, 2017). On the other hand, it is also possible to limit the interpretation of the results by the complex characteristics of the technique using analysis (Laitinien, 2000), especially for the samples studied with a limited number of observations because of the unavailability of data.
Based on the argument given above, along with the fact of the absence of relevant studies in Vietnam, which can provide information on identifying vulnerable businesses, the question is which financial indicator can help identify small and medium-sized (unlisted) companies that are at risk of bankruptcy with appropriate analytical methods. Answering this question is also our research goal.
Hypotheses
Some studies of Beaver and Altman are developed, extended and modified throughout the models and alternative variables that have suggested and inspired next researchers to point out the range of the forecasts with specific context of firms which needs to be further clarified to enhance the performance or / and applicability of the forecasts. In the case of small-scale corporations, other alternatives can enhance the performance of forecasts (Altman, 1983, Zavgren, 1983 and Altman, 2000) because of the best suitable for the characteristics of the specified firms. However, since the pioneered studies conducted by Edmister (1972), Keasey & Watson (1987), the number of studies has been a negligible quantity. As mentioned above, the most recent studies, except those published from Laitinen's study (1991) related to forecast the risk of small businesses’ bankruptcy, are mainly focused on forecasting techniques (using machine, artificial intelligence) rather than considering the financial variables of alternative forecast to ensure multidimensional and development in research on this issue as suggested by Altman. Meanwhile, Laitinen (1991) suggested that the bankruptcy of small businesses or fledgling businesses could be predicted by observing the alleged signs that were relevant to the economic situation of companies with characterized by regressions in measurable financial ratios. Due to the difference in financial potential between small companies and larger companies, the ratios associated with the typical bankruptcy process were often caused by the shock of inability to pay debts (Karels & Prakash, 1987; Laitinen (1991).
Variables in our research model are closer to the studies of Laitinen (1991) than some existing studies (Altmant, 2000) because the information on transactions on the market is not available in research data set. As explained above, with the characteristics of small businesses in the context of the transition economy, our main concern is to focus on debt utilization and the ability to generate revenue to ensure the cash flow in payment rather than typical elements of large enterprises. Therefore, the financial ratios selected in the model are based not only on the relevant documents, but also on the characteristic’s consistency of small businesses (for example, when considering the target of retained earnings on total assets, it does not make much sense for small businesses in developing countries, businesses often report losses or scale of retained earnings is not worth). Therefore, the proposed variables are a combination of variables in Altman and Laitinen’s research. In addition, we consider both the age and location of the business. We propose the following research hypotheses:
Earnings before interest and depreciation measure the real profitability of assets, regardless of the taxes, debts as well as the way to calculate depreciation. To a certain extent, this index reflects the cash flow of the business. This is an important indicator to predict bankruptcy risk because the existence of the business is essentially based on the profitability of the assets. This is an indicator outperforming the cash flow scale, according to Altman. Adjusting for small businesses, we do not examine the scale of cash flow separately. We combine cash flow into this indicator by eliminating the effects of depreciation. Therefore, this indicator is used in the study. The concept of "bankruptcy is the insolvency of due debts" will occur when the business is unprofitable. Therefore, in accordance with most studies, we hypothesize as follows:
H1: Earnings before interest and depreciation are inversely related to the business’s bankruptcy.
The ability to generate cash flow and meet financial obligations are the basic signs for an initial identification of a company's existence. If the business is insolvent, the bankruptcy / shutdown is possible. Concerning to this criterion, while Altman (1968) argued that working capital was a better alternative to solvency (short-term) indicators because these indicators are trending with a failed company, the study of Hall (1994) emphasized the role of cash flow and the ability to pay debts affecting the existence of businesses. This result was also consistent with the finding of the role of cash flow in the study of Almamy et al (2016). Based on this suggestion, we examine both financial indicators simultaneously to examine more fully the effect of liquidity to the bankruptcy of small businesses. Therefore, we hypothesize that:
H2: Liquidity (ability to generate cash flow and ability to meet short-term financial obligations) has a negative relationship with the bankruptcy of small businesses.
According to Laitinen, small and fast-growing businesses often have to use more debt to finance the growth. As a result, businesses were under more pressure to pay their debts in order to survive, especially in the case of businesses with little earnings, fast growth with slow capital had to spend more budget to pay for financial obligations. This behavior could lead to a vicious cycle that resulted in bankruptcy (Laitinen, 1991). Increasing in revenue is the goal of any business because this is the basis for generating cash flow and making profits. In the case of small businesses, earning growth is also an opportunity to expand the accumulative capacity to develop the firms, hence, this was a basis for enterprises to survive and develop. As a result of these considerations, we hypothesize that, in the context of other constant factors, firms have higher growth, the lower bankruptcy.
H3: Growth has a positive relationship with the bankruptcy of small businesses
Most businesses had to use debt to finance assets. However, high debt levels while the cash flow is not enough to cover the debt were always a risk of financial exhaustion and one of the main causes of corporate bankruptcy (Karels & Prakash, 1987; Beaver, 1966) because increased financial obligations made businesses face more debt and default risk (Laitinen, 1991). For small businesses, this problem was exacerbated by insufficient revenue to offset the funding needs of the business. Besides, the velocity of capital is also an important factor reflecting operational capacity of the enterprise. Enterprises with weak capital efficiency, slow capital turnover will put pressure on cash flow as well as profitability. These are the two aspects that we put into the group showing the sustainability of the business operations.
H5: Firm's sustainability is negatively related to firm's bankruptcy.
Smaller businesses were considered to be riskier than larger ones because they can only specialize in an area with low marginal revenue because they cannot diversify business operating in key industries. Regarding the asymmetric problem, small businesses were also assessed as enterprises with the ability to select projects with higher risks than large enterprises (Scheer, 1993).
H5: Firm size is negatively related to the bankruptcy of small businesses.
In addition, regarding the risks of high competition risk in concentrated business locations, we also initially consider the competitive environment through controlling the location of the company's business operations with the proposed hypothesis H6 is as follows:
H6: Central-based businesses are at a higher risk of bankruptcy than businesses located far from the center.
Methodology and Research Model
Variables and measured
Table 1 present the financial ratios used to measure for independent variables in the model, classified into 6 categories with 8 variables to be tested, in which we control the location that firms in the sample be metropolitan and suburban areas, in order to test whether the business location of the firm can be a factor influencing to the firm bankruptcy probability?.
| Table 1: Variables and Measure | ||
| Categories | Variables | Measure |
|---|---|---|
| 1.PROFITABILITY | ROE | Profitability = (Net profit + interest expenses + depreciation)/Equity |
| 2.LIQUIDITY | CFNS | Dynamic Liquidity (cash flow to net sales) = (Net profit + depreciation)/Net sales |
| CR | Quick ratios (cash flow) = (Current Assets –Inventory)/ Current debt | |
| 3.GROWTH | SG | Growth: Rate of annual growth in net sales = Net sales in year t/ Net sales in year t-1 |
| 4. SUSTAINABILITY | CFOD | Solidity (Cash flow to total debt) = (Net profit + depreciation)/ Total debt |
| SOCI | Net sales to total capital = Net sales/ Total capital in the end of the year | |
| 5. FIRM SIZE | SIZE | Firm size = Logarithmic sales |
| 6. LOCATION | LCN | A binary variable takes the value of 1 if the firm located in metropolitan, other takes the value 0. |
Samples
The data model initially consisted of 40 bankrupted enterprises, selected using the convenient sample collecting method. These were enterprises having closed their tax codes. However, after examining the quality of the data, this sample set was decreased down to 23 enterprises in order to ensure that the data contained information of the financial reports of 5 years preceding the cease of operation. Next, the study collects another 23 small and medium enterprises currently in business. These enterprises are distributed in districts pretty much corresponding to those in the previous set of samples.
The final data used in this study includes 46 small and medium enterprises. These enterprises were registered at the Hanoi Department of Planning and Investment and they submitted annual financial statements at the Hanoi Tax Department as prescribed. The financial statements used for the analysis were collected including 2 groups of 23 small and medium sized enterprises that have operated at the present time and 23 enterprises that have been classified in group bankruptcy by the Hanoi Tax Department and completed the closing of the tax code with 115 observations in each group. In order to ensure the target of analysis and avoid biases in terms of business cycle effects, these enterprises have full financial statements for 5 consecutive years at the time of data collection and financial reports for 6 years before the time to close the tax code.
The quantity of enterprises is not high in the study. However, with the difficulties presented during the process of collecting data from bankrupted enterprises, the number of 46 enterprises in the current model is considered optimal in the study. The size of the model also agrees to the majority of relevant studies (Altman, 1986).
For convenience, with the main purpose of examining the financial parameters in the model outlining factors affecting the probability of bankruptcy for enterprises, as well as controlling the impact of the industry and business location factors, enterprises in the survey sample are divided into two in areas of business activity including manufacturing and non-manufacturing enterprises (commercial and services firms). Enterprises are distributed in 11 districts in Hanoi area and for the convenience of control, we classify operating areas into 2 main groups of areas which are the metropolitan and suburban areas.
Logit Model and Methodology
Based on the aforementioned discussion of the research method, in order to estimate the risk of bankruptcy, we agree to utilize the logit model with the binary variable as the dependent variable. Then, the estimated probability always belongs to the range of {0;1}, and the relation between the probability of bankruptcy with the non-linear relation as independent variables.
Using a binary random variable Y belonging to the range of [0, 1] where the event of bankruptcy with Y=1, the probability of distribution of the residual (ui) is determined by the logistic probability distribution, the logit model is presented as below:

In which: Zi is the linear function to the explained variables of Y, or Zi =estimated with i is firm i; u is the residual and Xi are explaining variables for the bankruptcy probability of firms. pi is the probability that a firm goes bankrupt (Y =1) and (1-pi) is probability of a business not going bankrupt. Then
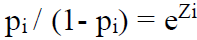 is odds ratio in favor of bankruptcy firm, and if we take the natural log of this ratio.
Using this model, the estimated results for independent variables are defined as mentioned above to identify factors that can help predict default risks for small and medium enterprises in our study sample, in which when Odds ratio > 1, the value of the explanatory variables for bankruptcy cases increases. With the variables proposed in 6 categories, we will conduct with 5 models, respectively including the logit model with 8 variables in 6 categories and 4 logit models with 7 independent variables in each ones ( These logit models respective, not including CFNS, CR, CFOD and SOCI variables in 2 categories representing liquidity and sustainability of firms). Basing on the comparing test results, we choose the model with variables that could best forecast abilities. As a result, we chose the model with 7 variables (not including CFNS variables) to report the results as presented in the following section.
Research Results and Discussion
Descriptive Statistics on Variables Using in Prediction
The descriptive statistics results of the variables used in the prediction are presented in Table 2 of two groups: the bankrupt and non-bankrupt enterprises, with 115 observations in each group. Since the revenue data is missing in some financial reports from bankrupt enterprises, the number of revenue observations in this group are 98. Descriptive statistics results show that, on average, profitability, liquidity and revenue growth have opposite signs between the two groups, ceteris paribus. These results for the group of enterprises that are not bankrupt are respectively 0.1821, 0.1234 and 1.0271, while for the group of enterprises that were bankrupt, these results are (-0.0093), (- 0.0488) and (-2.536). The remaining elements have the same signs.
| Table 2: Descriptive Statistics Variables | |||||||||
| Variables | Non- bankrupt firms | Bankrupt firms | Mean | ||||||
|---|---|---|---|---|---|---|---|---|---|
| N | Mean | Sd | Cv | N | Mean | Sd | Cv | ||
| ROE | 115 | 0.182 | 0.274 | 1.504 | 115 | -0.009 | 0.374 | -40.331 | .0864 |
| CFNS | 115 | 0.123 | 1.701 | 13.776 | 115 | -0.049 | 1.413 | -28.897 | 0.037 |
| CR | 115 | 3.006 | 14.882 | 4.951 | 115 | 4.061 | 10.109 | 2.489 | 3.534 |
| SG | 98 | 1.027 | 4.108 | 3.999 | 115 | -2.054 | 7.654 | -3.727 | -.5133 |
| CFOD | 115 | 4.337 | 8.431 | 1.944 | 115 | 3.719 | 24.294 | 6.533 | 4.028 |
| SOCI | 115 | 1.912 | 1.918 | 1.003 | 115 | 1.008 | 1.180 | 1.170 | 1.460 |
| SIZE | 115 | 23.483 | 1.738 | 0.074 | 98 | 22.496 | 2.203 | 0.0979 | 22.823 |
Therefore, this result initially demonstrates that overall, enterprises in the non-bankrupted group show more positive financial ratios than those belonging to the bankrupted group. On average, these enterprises are greater in size, profitability and sales growth. Although their quick ratio (CR) is lower, it shows flexibility in cash flow. This is indicated in the cash flow to net sales and cash flow to total debt ratios having a higher mean than that of enterprises belonging to the bankrupted group.
Univariate Analysis
Table 3 presents the percentiles at 25%, 50% and 75% for 7 of the 8 variables in the estimated data. At the significance level of 5%, the difference between profitability variables, revenue growth, firm size and liquidity is statistically significant.
| Table 3: Univariate Analysis on Independent Variables | ||||||
| Variables | Non- bankrupt firms | Bankrupt firms | ||||
|---|---|---|---|---|---|---|
| 25% | 50% | 75% | 25% | 50% | 75% | |
| ROE | 0.01386 | 0.11417 | 0.2801 | -0.0406 | 0.0219 | 0.14962 |
| CFNS | 0.00333 | 0.01401 | 0.0458 | -0.0031 | 0.0031 | 0.03101 |
| CR | 0.97405 | 1.2009 | 1.589 | 0.90603 | 1.4057 | 3.2194 |
| SG | -0.8497 | 0.01710 | 0.7478 | -1.3557 | -.6768 | 0.13435 |
| CFOD | 0.36739 | 2.3182 | 7.008 | -1.3702 | 1.5105 | 10.0742 |
| SOCI | 0.50146 | 1.3416 | 2.8941 | 0.0561 | 0.8856 | 1.5689 |
| SIZE | 22.351 | 23.485 | 24.8743 | 21.0134 | 22.9401 | 24.2317 |
In the univariable analysis, there are differences in financial indicators between the two groups of non-bankrupt and bankrupt enterprises in the research sample. Except for the quick ratio variable (CR) and cash flow on debt variable (CFOD) which are quite similar at 50% and 75% percentile levels, the remaining variables including profitability, liquid ability, revenue growth and firm size of bankrupt enterprises present more negative signs than their counterparts.
Noticeably speaking, when examining each percentile, it could be seen that the sales growth ratios show more distinct differences between the groups. If in the non-bankrupted group, the sales growth ratios showing negative only concentrate in the first percentile, those of the bankrupted enterprises reach the second percentile. On average, the sample shows that the bankrupted enterprises have a better current quick ratio. However, taking a closer look at the situation, this high ratio does not concentrate in enterprises but around the third percentile. In other words, some enterprises with very high ratios have raised the mean value of the sample instead of keeping all values representative. These statistical results once again emphasize the differences between the group of bankrupt enterprises and non-bankrupt enterprises, which include the difficulties in obtaining financial revenue (cash flow) and much lower profits compared to nonbankrupt businesses. This suggests that, to survive, small businesses must ensure positive revenue growth and profitability. In contrast, the financial difficulties of bankrupt enterprises seem to stem from weak cash flow due to insufficient revenue to cover costs, leading to bankruptcy.
The Estimated Results in Bankruptcy Prediction Analysis of Small and Medium Enterprises
Using the 7 financial variables (except for the CFNS) tested in the bankruptcy prediction model for SMEs with control over the business location variable, the study shows that four financial indicators in the estimated model (Table 4) are statistically significant at the significance level of 0.05. These indicators are profitability before tax, interest and depreciation to equity – ROE), Sales growth (SG), Firm size and net sales to total capital (SOCI). Odds ratios of these indicators are less than 1, respectively 0.07, 0.84, 0.82 and 0.8, meaning that SMEs have smaller size, lower profitability, net sales to total capital and growth have higher risk of bankruptcy, ceteris paribus. In addition, registered companies doing business in the metropolitan areas seem to be placed at a higher risk of bankruptcy in comparison to the ones located on the outskirts. Meanwhile, the estimated results present a lack of evidence to conclude that the variables representing liquidity (CR) and sustainability (CFOD) have a significant impact on identifying the bankruptcy risk of enterprises in this research sample.
| Table 4: The Logit Model Predicts Bankruptcy Potential | |||||||
| Y | Odds Ratio | Std. Err | Z | P>|z| | [95% Conf. Interval] | ||
|---|---|---|---|---|---|---|---|
| ROE | 0.0794 | 0.0651 | -3.09 | 0.002 | 0.0159 | .3958 | |
| CR | 0.9953 | 0.0116 | -0.40 | 0.686 | 0.9728 | 1.0182 | |
| SG | 0.8434 | 0.0488 | -2.95 | 0.003 | 0.7531 | 0.9445 | |
| CFOD | 1.0145 | 0.0096 | 1.53 | 0.126 | 0.9959 | 1.0335 | |
| SOCI | 0.8022 | 0.0745 | -2.13 | 0.033 | 1.0349 | 1.3301 | |
| SIZE | 0.8249 | 0.0745 | -2.13 | 0.033 | 0.6912 | 0.9846 | |
| LCN | 3.2837 | 1.1341 | 3.44 | 0.001 | 1.6687 | 6.4615 | |
| _cons | 55.6674 | 113.0558 | 1.98 | 0.048 | 1.0396 | 298.0718 | |
| Number of obs | 211 | ||||||
| LR chi2(8)=65.91 | Prob >chi2 =0.0000 | ||||||
| Log likelihood =-108.3038 | McFadden R-squared =0.256770 | ||||||
The findings of this study, although not quite consistent, are in accordance with the results in studies given by Altman (2000); Brigg (1994): Latinien (1998, 2000).
With the results obtained, our bankruptcy prediction model is as follows:

t-value of these variables are respectively 1.8367, -2.644, 1.793, -2.902, -1.850, -2.517, 3.102, 4.051.
Y=1 means default, so lower the log odds ratio  , the higher survival probability of the firm.
The negative and significant signs of ROE, SG and SIZE means the higher profitability, growth and bigger firm size, the lower the probability of default of the firm. More specifically, the profitability, the sale growth and firm size will reduce the default probability likelihood. The positive and significant sign of SOCI (Net sale to total capital) and PLC (Urban company) means the higher these three variables, the higher the default probability likelihood. The current ratio CR and CFOD have no significant impact.
If we look at the odds ratio, the above results are also confirmed. These variables ROE, SG and SIZE have negative impact on the default probability likelihood, obtain the odds ratio significantly lower than 1 and p-value lower than 5%. In the opposite way, the SOCI and PLC have positive impact on the default probability, obtain the odds ratio significantly lower than 1 as well as the p-value lower than 5%. Whereas the variable CR and CFOD both have p-value higher than 5%, not significant impact and the 95% confidence interval both covers the lower than and higher than 1 interval.
The findings in this study are quite interesting as there are 3 indicators of bankruptcy risk identification related to the turnover of the firms. This result suggests that, in the current business context, small and medium enterprise in Vietnam can only survive if they can generate enough revenue to cover cost and make profit. This statement is consistent with suggestions from Berger & Udell (1998) or Matinen & Man (2010). This shows that the difficulties of Vietnamese enterprises leading to the bankruptcy potential do not come from signs that reflect financial distress due to the insolvency to banks or partners, but rather from the lack of effectiveness in business operation and the difficulties in dominating the market to be able to gain enough revenue that can cover the costs for surviving and developing.
Checking Model Fit and The Predictive Power of The Model
Checking Model Fit
The results given in Table 5 show that the model can be explained by independent variables at 25.6% (McFadden R-squared corresponding with McFadden R-squared). The Prob value (LR statistic) = 0.000000, meaning the Ho hypothesis is rejected, shows the statistical significance of the coefficients in the model used in explaining dependent variables.
| Table 5: Assessing the Credibility of the model | |||
| McFadden R-squared | 0.256770 | Mean dependent var | 0.464455 |
| S.D. dependent var | 0.499921 | S.E. of regression | 0.423385 |
| Akaike info criterion | 1.102405 | Sum squared resid | 36.38868 |
| Schwarz criterion | 1.229490 | Log likelihood | -108.3038 |
| LR statistic | 74.83331 | Avg. log likelihood | -0.513288 |
| Prob(LR statistic) | 0.000000 | ||
Testing the Predictive Power of The Model
The results of testing the predictability of the model with 23 bankrupt and 23 non-bankrupt enterprises in the research sample are presented in Table 6. In the case of operating enterprises, meaning they have not yet gone to bankruptcy, the statistical data shows that the correct prediction rate is 80.53%, equivalent to 4 operating businesses that are forecast to be at risk of bankruptcy (19.47%), while they are actually in operation. For bankrupt enterprises, the forecast ability of the model is 68.37%. On average, the forecast ability of the model reaches up to around 75% efficiency. This result is not quite good compared to the reports from the research based on listed data (usually the forecasted performance is over 80%), but it is acceptable for the case of small and medium, and/or unlisted enterprises, because it is not greatly lower than existing claims (Pau & Jan, 2005).
| Table 6: Assessing the Predictive of the model | ||||||
| Estimated Equation | Constant Probability | |||||
|---|---|---|---|---|---|---|
| Dep=0 | Dep=1 | Total | Dep=0 | Dep=1 | Total | |
| % Correct | 80.53 | 68.37 | 74.88 | 100.00 | 0.00 | 53.55 |
| % Incorrect | 19.47 | 31.63 | 25.12 | 0.00 | 100.00 | 46.45 |
Conclusion
This study aims to contribute to identifying the factors affecting the risk of bankruptcy by applying the logit model to predict the health of firms in the case of small and medium enterprises. Study results show that in the case of enterprises in the research sample, the group of solvency and profitability indicators is not many meanings in the distinguish between bankrupt and nonbankrupt businesses, except for the profitability after being adjusted to cash flow (profit before tax, interest and depreciation). However, from the results of statistics and regression, it is shown that enterprises do not use debt and have lower revenue growth, under the condition that other factors are constant, there is a higher risk of bankruptcy. This implies that Vietnamese small and medium enterprises are bankrupt mainly because they are in a business situation without achieving sufficient revenue to offset costs and being more profitable than businesses using leverage. Excessive finance leads to financial exhaustion. In fact, the statistical results show that only less than 20% of businesses in the group of bankruptcy enterprises use loans, while this figure is twice that of non-bankrupt enterprises. In addition, with regard to revenue, the growth rate of revenue of enterprises belonging to bankruptcy groups tends to grow or stabilize. Some implications from the result of the estimation model:
First, the financial ratios are important indicatiors in recognizing bankrupted enterprises. In the case of SMEs within the range of this study, the risk of financial distress can occur given that sales growth ratios, profitability before tax and depreciation and sales on capital show signs of falure risk.
Second, SMEs in Vietnam, in reality, are micro firms. Although these enterprises, in theory, have flexibility in business operation, the small size can be a factor hindering their competitive ability as well as development motivation and capital accumulation. This can contribute to reducing the surviving ability of the enterprise.
Third, the above conclusions have indicated the shortcomings of the SME sector due to their inability to compete and dominate the market, rather than the financial risks from using debt leverage as well as the lack of stability in operating capital. These distinctions require businesses to be considerate in strategy management and to better evaluate the market demands and the capacity to compete and dominate the market, as well as modifying their strategy to adapt to external market shocks.
Finally, although indicators about the coverage ability has not been recognized in this model, when analyzing the bankruptcy risks of SMEs, it’s necessary to be aware of the debt failure risks, because as analyzed above, not using liabilities has increased this mega-ratio, while this can be the signs of ceasing operation showing that transactions involving partners (for instance, suppliers) no longer occurring.
References
- Altman, E. (1968). Financial Ratios, Discriminant Analysis and the Prediction of Corporate Bankruptcy. Journal of Finance.
- Almant (1993). Corporate Financial Distress and Bankruptcy 2nd ed. John Wiley & Sons, New York.
- Altman (2000). Predicting Financial Distress of Companies Revisiting the Z-Score and ZETA. Retrieved from http://pages.stern.nyu.edu/~ealtman/Zscores.pdf
- Almamy J et al (2015). An evaluation of Altman ‘Z- score using cash flow ratio to predict corporate failure amid the recent financial crisis: Evidence from the UK. Journal of Corporate Finance
- Beaver, W. (1967). Financial Ratios as Predictors of Failures. Journal of Accounting Research.
- Berger, A.N., & Udell G.F. (1998). The Economics of Small Business Finance: The Roles of Private Equity and Debt Markets in the Financial Growth Cycle." Journal of Banking & Finance, Elsevier.
- Briggs, D. (1994). The prediction of private company. University of Glasgow, Scotland D. A. MacLennan, 66 -72
- Hall, G. (1994). Factors distinguishing survivors from failures amongst small firms in the UK construction sector. Journal of Managemt Studies, 315
- Keasey, K., & Watson, R. (2012). The prediction of small company failure: Some behavioral evidence for the UK. Accounting and Business Research, 17, 49-57
- Liang, D., Lu, C.C., Tsai, C.F., & Shih, G. (2016). Financial ratio and corporate governance in bankruptcy prediction: A comprehensive study. European Journal of Operational Research, 252, 561 -572.
- Laitinen, K., & Laitinen, T. (2000). Bankruptcy prediction application of the Taylor’s expansion in logistic regression. International Review of Financial Analysis, 9, 327 - 349
- Laitinen, K. (1992). Prediction of failure of newly founded firms. Journal of Business Venturing, 7, 323-340
- Miettinen, M., & Virtanen, M. (2013). Capital structure of start-ups: Evidence on non-accounting characteristics. Journal of Modern Accounting and Auditing, 9(7), 889-907.
- Paul P, Jan B. (2005). The prediction of bankruptcy of small and medium sized industrial firms. Journal of Business Venturing, 20, 847-868
- Scherr, F.C., Sugrue, T.F., & Ward J.B (1993), "Financing the Small Firm Start-Up: Determinants of Debt Use", The Journal of Small Business Finance 3.1, pp. 17-36
- Tian, S., & Yan, Yu. (2017). Financial ratios and bankruptcy predictions: An international evidence. International Review of Economics and Finance, 51, 510- 526.