Research Article: 2024 Vol: 28 Issue: 1
The determinants of CO2 emissions in the context of ESG models at world level
Alberto Costantiello, LUM University Giuseppe Degennaro, Italy
Angelo Leogrande, LUM Enterprise s.r.l., Italy
Citation Information: Costantiello, A. & Leogrande, A.,(2024). The determinants of co2 emissions in the context of esg models at world level. Academy of Accounting and Financial Studies Journal, 28(1), 1-15.
Abstract
We estimate the determinants of CO2 Emissions-COE in the context of Environmental, Social and Governance-ESG model at world level. We use data of the World Bank for 193 countries in the period 2011-2020. We found that the level of COE is positively associated, among others to “Methane Emissions”, “Research and Development Expenditures”, and negatively associated among others to “Renewable Energy Consumption” and “Mean Drought Index”. Furthermore, we have applied a cluster analysis with the k-Means algorithm optimized with the Elbow Method and we find the presence of four cluster. Finally, we apply eight machine-learning algorithms for the prediction of the future value of COE and we find that the Artificial Neural Network-ANN algorithm is the best predictor. The ANN predicts a reduction in the level of COE equal to 5.69% on average for the analysed countries.
Keywords
Analysis of Collective Decision-Making, General, Political Processes: Rent-Seeking, Lobbying, Elections, Legislatures, and Voting Behaviour, Bureaucracy, Administrative Processes in Public Organizations, Corruption, Positive Analysis of Policy Formulation, Implementation.
Introduction
In the following article, we look at the determinants of COE in the context of the ESG model. The affirmation of the ESG model has led to significant innovations from the point of view of the environment, the social dimension and governance (Costantiello & Leogrande, 2023; Leogrande,2023; Laureti et al., 2023). However, the connection between COE and ESG is far from linear and sometimes shows an irrational dimension due to the presence of phenomena such as greenwashing, which distort the attribution of ESG-type rankings. After all, the relationships between COE and economic growth, economic development and industrialization are well known. There is no need to refer to the well-known Pigouvian taxes and the introduction of the idea of negative externality connected to pollution or to the production of COE. The originality of this article therefore consists in identifying the existing connections between COE and ESG variables.
Literature Review
In the following section, we consider a part of the scientific literature relating to the relationship between COE and the application of ESG models. The articles reported, far from being exhaustive, are cited for the sole purpose of the introduction of the topic.
COE and Management
There are doubts about the relationship among the economic-financial performance of the company, the ability to obtain high levels in terms of ESG and the possibility of reducing the COE value. These doubts depend on the fact that complying with ESG-type criteria does not necessarily make the company profitable from an economic-financial point of view. It is therefore necessary for ESG investment funds not only to be able to verify compliance with certain principles relating to sustainability, but also to be able to determine the conditions that allow companies to increase the value of turnover in any case. However, the very strong orientation towards ESG issues and the presence of investors specialized in terms of ESG pushes managers to try to maximize ESG scores. Thus a contradiction arises between maximizing ESG models and maximizing profit which leads companies to operate through the application of principles that are more ethical-moral than economic-financial. However, due to the presence of greenwashing, the free riding behaviour has been revitalized in corporate governance and finance. High ESG ratios are associated to negative returns for stock market companies in the case of low COE (Pedersen et al., 2021). In UK, the reduction of COE has been realized with a decrease in capital expenditure to achieve the goal of complete decarbonisation in 2050 (Karim et al., 2021).
COE and Innovation
Not all types of innovation are compatible with COE reduction. In fact, technological innovation by itself does not guarantee the reduction of COE even in the presence of the application of ESG. Specifically, the COE value could even increase in the presence of technological innovation, or of a type of innovation that does not take into consideration the negative environmental externalities generated by the innovation itself. For this reason, it is necessary to distinguish environmental innovation from other types of innovation, as only environmental innovation is able to offer the type of support that can lead to a reduction in COE. It therefore follows that the ESG model should be modernized into ESG+I type model to take into account the role of innovation in compliance with environmental requirements. Traditional innovation does not reduce COE; to combine innovation and sustainability firms need to invest in environmental innovation (Khalil et al., 2022). The investment in green technology in the context of ESG models is a target of sustainable political economy in China (Lyu et al., 2022)
COE and ESG
The relationship between COE and ESG is controversial. Obtaining high rankings in terms of ESG does not necessarily also generate a reduction in COE. On the contrary, it is possible to identify a positive trend between the growth of ESG scores and the increase of COE. As a result, many companies obtain high ESG scores in the absence of an adequate control of their negative environmental externality. Only recently, the institutions involved in the control of stock exchanges are checking the correspondence between COE and the ESG model, creating the conditions for discrimination against companies that apply greenwashing techniques. The application of ESG models is essential to reduce COE (Baratta et al., 2023). The environmental component of the ESG model i.e. the E in ESG is weak in respect to the other components; a fact that worsen the probabilities of a reduction of COE and the achievement of carbon neutrality (Senadheera et al., 2021). The adoption of ESG models in a set of 2,465 listed companies is positively associated to the reduction of COE intensity (Bauer et al., 2023). ESG funds invest in firms that have higher ESG scores even if ESG scores are not correlate with the firm performance in terms COE (Raghunandan & Rajgopal, 2022) During periods of economic turmoil, companies seem more interested in applying ESG models targeting sustainable goals such as COE (Alandejani & Al-Shaer, 2023). There is a positive relationship between the adoption of ESG models, the environmental-innovation and the reduction of COE for firms listed to the London Stock Exchange-LSE (Albitar et al., 2016). High ESG scores are negatively associated to a reduction in COE in Nordic countries (Grundström & Miedel, 2021). Also theoretically, the optimal strategy of an ESG fund is negatively associated to the reduction of carbon footprint (Landier & Lovo, 2020). Furthermore, mutual funds that operate as ESG fund tend to finance auto loans without discriminating for COE (Kontz, 2023). Big corporations can use greenwashing to have higher ESG scores even without reducing COE (Jiang et al., 2022). The increase in 1% of investment in the E component of the ESG model reduces COE of 0,246% in China (Cong et al., 2022). Universities that reduces the level of COE in the application of the ESG model tend to have more students (Chan & Hsieh, 2022)The disconnection between the reduction of COE and the application of ESG model has offered the opportunity to introduce the new concept of carbonwashing (In & Schumacher, 2021)
The Econometric Model for the Estimation of the Level of CO2 Emissions
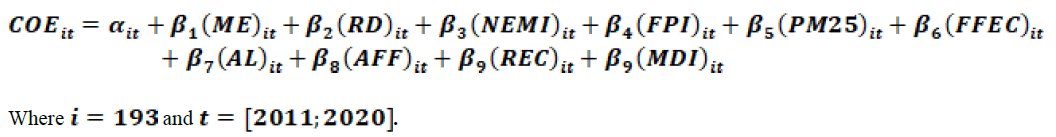
To estimate the determinants of COE we used various econometric tools i.e. Panel Data with Fixed Effects, Panel Data with Random Effects, WLS-Weighted Least Squares. The data was sourced from the World Bank's ESG database. We analyse 193 countries in the period 2011-2020. The choice of panel data models was due by the data structure. In fact, we have used data that have either a time series dimension, in the period 2011 and 2020, either a cross-section dimension, with 193 countries. However, in the analysis conducted we did not take into account cause-effect relationships as we could have done using Granger Causality. In fact, we will refer exclusively to the presence of associations among variables without inferring the presence of a causal nexus. In fact, in the field of social sciences it is dangerous to refer to the presence of a causal-effect relationship among the analysed variables due to the wide endogeneity and the complex systemic structure of the investigated phenomenon. Specifically we have estimated the following formulas:
We have found that the level of COE is positively associated to:
ME: Considers methane emissions deriving from human activities such as agriculture and from the industrial production of methane. There is a positive relationship between countries that have high levels of COE production and countries that have high levels of ME. The top ten countries by ME value are China, Russia, United States, Iran, Iraq, India, Venezuela, Saudi Arabia, Nigeria, and Turkmenistan. As it is possible to see, these are countries that have significant supplies of methane and which will certainly also be the protagonists of the economy of the future, with the exception of Iran, Iraq, Venezuela, and probably Russia. In fact, following the attack on Ukraine, Russia has lost its traditional market for the sale of methane, i.e. Europe. Russia's methane sales are likely to decrease worldwide in the future. However, we must also not ignore the possibility that a significant part of methane emissions is related to agriculture. In fact, the agricultural component is significant in many of the countries that make up the top ten for EM value, among which we find China with a value of agriculture on GDP equal to 7.3%, Iran with 12.4%, Turkmenistan with 10.8%. Certainly, the positive relationship between COE and ME is negative in terms of reducing global temperature and fighting climate change.
RD: It is a variable that considers gross domestic expenditure on research and development expressed as a percentage of GDP. That variable includes both capital and current expenditures in the four main sectors: business, government, higher education and private non-profit. R&D covers basic research, applied research and experimental development. There is a positive relationship between COE and RD. This variable is because many of the countries that are leaders in COE also have high levels in terms of RD. This is particularly the case of western countries that have higher levels of RD and COE. This is the case, for example, of the USA, Canada, Australia, and also Germany, Poland, Belgium, the Netherlands. The positive relationship between COE and RD is due to the presence of a nexus between the research system and the industrial sector especially in the context of manufacturing, which consume high quantity of energy generating COE and pollution.
NEMI: It is the net total of migrants during the period, i.e. the number of immigrants minus the number of emigrants, including both citizens and non-citizens. There is a positive relationship between the NEMI and COE. In fact, the countries that have high levels of COE are also the same that have the largest number of immigrants. If we consider the countries that are in the top 20 by NEMI value, we note the presence of the United States, Russia, Germany, Canada, Australia, the Netherlands and Belgium, i.e. countries that have very high levels of COE. The reason for the positive relationship existing between NEMI and COE is to be connected to the fact that middle-upper income countries, which also have the highest levels of NEMI, are also those, which have the most polluting production and industrial systems. The growth of per capita income is positively associated with the presence of a polluting industrial system and therefore also with the high value of NEMI, as immigrants try to go to countries that offer greater opportunities from an economic and social point of view.
FPI: It consider food crops that are edible and contain nutrients. Coffee and tea are excluded because, although edible, they have no nutritional value. There is a positive relationship between the FPI and COE. In the top thirty countries by FPI, we find some of the most polluting countries in the world such as Qatar in eighth place, Kuwait in twenty-ninth place, and Bahrain in fifteenth place. The positive relationship between FPI and COE is because many of the countries that have an evolved agro-food system are precisely the Western countries that have high values in terms of COE. Furthermore, there are other countries that have a high level of both FPI and COE, namely: Oman with a value of 152.75, and Saudi Arabia with an amount of 151.14.
PM25: It is a variable that calculates the population-weighted exposure to environmental PM2.5 pollution defined as the average level of exposure of a nation's population to concentrations of airborne particles measuring less than 2.5 microns in aerodynamic diameter, which are capable of penetrate deep into the respiratory tract and cause serious harm to health. Exposure is calculated by weighting the average annual concentrations of PM2.5 by population in urban and rural areas. There is a positive relationship between PM2.5 and COE. Among the countries that have a high level of PM2.5 there are also some of the countries with very high levels of COE i.e. Qatar, Saudi Arabia, Kuwait, Bahrain. As is known, these countries have significant natural reserves of oil with a relevant level of pollution.
FFEC: It is a variable that considers the value of fossil fuels and that includes coal, oil, and natural gas-based products. There is a positive relationship between FFC and COE. Obviously, the countries that have higher consumption of energy from fossil sources as a percentage of the total also have a higher COE value. Among the countries that have a high level of FFC there are some that also have high levels of COE such as for example Brunei Darussalam, Qatar, Oman, Saudi Arabia, Bahrain. However, it is necessary to consider that the value of fossil fuel consumption has decreased globally and for individual countries. However, this condition did not lead to a reduction in the COE value (Figure 1).

Figure 1 Average Values of the Variables of the Econometric Model
We also find that the level of COE is negatively associated to:
AL: It refers to the share of arable land, permanent crops and permanent pasture. Arable land includes land defined by the FAO as land under temporary crops, temporary grassland for mowing or grazing, market land or vegetable gardens and land that is temporarily fallow. Land abandoned because of cultivation shifts is excluded. Permanent cropland is land planted with crops that occupy the land for long periods and do not need to be replanted after each harvest, such as cocoa, coffee and rubber. This category includes land under flowering shrubs, fruit trees, nut trees and vines, but excludes land under trees grown for lumber or lumber. Permanent pasture is land used for five or more years for forage, including natural and cultivated crops. There is a negative relationship between the AL and COE. Countries that have a high level of AL also have a low level of COE. Looking at the map of countries that have a high level in terms of AL, there are both low per capita income countries and high per capita income countries within the European context. However, the presence of agricultural land is particularly pronounced in Africa, the Middle East, South Asia and southern European countries i.e. nations that have a low level of COE.
AFF: It considers the value of agriculture, forestry and fishing. Value added is the net output of an industry after adding up all outputs and subtracting intermediate inputs. It is calculated without making deductions for the depreciation of manufactured assets or the depletion and degradation of natural resources. There is a negative relationship between FFA and COE. This negative relationship is because countries that have high levels of FFA are also countries that have low levels of per capita income, which lack an industrial system and substantially have a developing economy. Although it is negative from an environmental point of view, the production of COE is nevertheless decisive for the economic growth at country level. In fact, it is very difficult for a country to grow in income without adequate growth also in terms of energy consumption and therefore also of COE. It follows that if a country has a high FFA component in its GDP it is most likely a country that has a low per capita income, that does not have an advanced industrial system, with a population that miss the opportunity to consume high value added goods and services.
REC: It is the share of renewable energy in the total final energy consumption. There is a negative relationship between the REC and COE. Countries that have a higher level in terms of REC are in fact mainly African countries that have a low level of per capita income. There is a negative relationship between REC and GDP growth. To increase the rate of GDP growth it is necessary to grow in the consumption of either renewable either non-renewable energy. Countries that have a relevant component of renewable energy are also countries that do not have an evolved industrial system, or an economy stably oriented towards the development of the service sector. Western countries, where the COE value is high, have low levels of REC, with some notable exceptions, namely: Norway, Austria, Switzerland and Iceland. It is probable that in the future the relationship between REC and COE will become positive especially in the presence of technological innovations capable of identifying new forms of renewable energy.
MDI: It is an average drought index. There is a negative relationship between MDI and COE. This relationship is because countries that have higher COE values are also countries that have lower drought values. Specifically, the reference is to the USA, Canada, Australia, Germany, Belgium, the Netherlands. Conversely, countries that have a high level of drought have low values in terms of COE and this relationship does not depend on climatic factors, but on the contrary on paths of economic growth and development of economic systems. In fact, countries with high levels of drought are also the most backward countries in the development of the capitalist economy, of the market society, and therefore have lower levels of COE.
Clusterization with k-Means Algorithm Optimized with the Elbow Method
A cluster analysis using the k-Means algorithm is presented below. The k-Means algorithm is an unsupervised machine-learning algorithm that requires the indication of the optimal number of k in order to be efficient in grouping. The observer should set the optimal number of k discretionally. To reduce the discretion in identifying the number of k, it is possible to use a set of tools such as, for example, the Silhouette coefficient and the Elbow method. The Silhouette coefficient is a number that varies between -1 and +1 and that can be attributed either to a cluster either to each of the elements within the cluster. The application of the Silhouette coefficient to the clustering led to the identification of a number of clusters equal to two. Since the number of countries analysed is equal to 193, the clustering with k=2 appeared insufficient to give a correct representation of the heterogeneity present within the dataset. Therefore, it was preferred to use an alternative criterion, namely the Elbow Method. Elbow's method consists of a graphical method for identifying the optimal number of k. In particular, k is chosen corresponding to the point in which an elbow is created. By applying Elbow's method, it was possible to identify a value of k=4 which was judged sufficient with respect to the heterogeneity of the countries analysed. Once the clustering with k=4 was obtained, the calculation of the median of the individual clusters was also carried out to identify an ordering between the clusters or to find those clusters that have a median value of COE greater than the others. The following ordering of the clusters was therefore identified: C4=21.56>C2=14.28>C3=5.24>C1=0.956. In particular:
Cluster 1: Sao Tome and Principe, Senegal, Eswatini, Kiribati, Nigeria, Vanuatu, Ghana, Papua New Guinea, Solomon Islands, Benin, Pakistan, Nicaragua, Mauritania, Cambodia, Sudan, Tajikistan, Bangladesh, Zimbabwe, Djibouti, Timor- Leste, Cote d'Ivoire, Tuvalu, Myanmar, Sri Lanka, Cameroon, Kenya, Guatemala, Angola, Yemen, Zambia, Nepal, Lesotho, Cabo Verde, Comoros, Haiti, Honduras, Togo, Paraguay, Liberia, Guinea, Philippines, Mali , Gambia, Bhutan, El Salvador, Tanzania, Eritrea, Mozambique, Congo Rep., Burkina Faso, Afghanistan, Guinea Bissau, South Sudan, Chad, Samoa, Sierra Leone, Madagascar, Ethiopia, Uganda, Niger, Rwanda, Tonga, Malawi, Somalia, Burundi, Congo Dem. Rep., Central African Republic, Micronesia Fed Sts, Fiji, North Korea, Costa Rica, India, Colombia, Kyrgyz Republic, Albania, Syrian Arab Republic, Peru, Belize, Namibia, Morocco, Lao PDR, Bolivia, Armenia, Indonesia, Uruguay, Republican Dominican, Brazil, Egypt, Georgia, Vietnam, Cuba, Ecuador, St. Vincent and the Grenadines, Tunisia, Grenada, Dominica, Botswana, Panama, Jamaica, Jordan, Gabon, Moldova, Guyana, Mauritius, St. Lucia, Marshall Islands, Azerbaijan, Maldives. C1 is made up of countries that are part of the African continent, Latin America, and South Asia. C1 countries have a low level of COE. The median value of COE is equal to an amount of 4.43% of the median value of C4, equal to an amount of 6.69% of the value of C2 and equal to an amount of 18.24% of the value of C3. C1 countries are essentially countries with a low average per capita income. One of the reasons why C1 countries have low per capita income is that they have a low COE value. In order to access economic growth, it is necessary to grow in energy consumption and therefore in the value of COE. Countries that have low levels of per capita income also have low energy consumption and a low value of emissions in terms of COE. There are likely to be steps in the future that increase COE output. Among these countries are India and Brazil above all. In fact, India and Brazil, countries belonging to the BRICS group, have very high prospects for further growth in GDP. For this reason, in order to access higher levels of per capita income and absolute value added, these countries will most likely increase the value of COE consumption. Especially India, which will be one of the protagonists of the global economy of the future, will have the opportunity to grow in absolute and per capita GDP also thanks to the growth in energy consumption. However, similar considerations apply to the C1 countries, which are also part of the Next Eleven-N11 group, i.e. Egypt, Bangladesh, Indonesia, Nigeria, Pakistan, the Philippines, and Vietnam (Figure 2). In fact, these countries too will be high-growth countries in the future and therefore they will most likely have to grow in energy consumption and therefore in emissions. Furthermore, considering that these are countries that also have significant demographic trends, it is possible to note how certainly in the future the climate problem will worsen more and more in the absence of adequate green-oriented economic policies and in the absence of technologies capable of producing energy in a sustainable and clean.

Figure 2 Countries in C1
Cluster 2: United States, Canada, Australia, Saudi Arabia, Trinidad and Tobago, Oman, Brunei Darussalam, Palau, Kazakhstan, Luxembourg, Turkmenistan, Estonia, South Korea, Russia. This is the second cluster in terms of COE. Specifically, countries that have the highest levels of COE within the same cluster are the USA, Canada, Australia, Saudi Arabia, Oman, Brunei. These nations are among the world's largest oil producers. In fact, if we consider the production of barrels of oil per day in 2021 we can note that the USA is in first place for a value of 11,184,870, Canada is in fourth place with a production of 4,459,455 barrels, Saudi Arabia is in third place with a production of 9,313,145 barrels, Australia in thirtieth place with a value of 334,448 barrels, Oman in nineteenth place with a production of 970,816 barrels and Brunei in 42nd place with a production of 98,178 barrels per day. However, Russia also has an important production of barrels of oil per day with a value of 10,111,830. It is necessary to make some considerations regarding the possible future development of these oil productions. In fact, it is very probable that the production of barrels per day for Western countries, i.e. the USA, Canada and Australia, will tend to decrease following the application of a set of economic policies aimed at favouring the ecological transition. Therefore, oil production and related polluting emissions should decrease in the future. A further motivation that could support the reduction of pollution produced by oil extraction consists in the production of new technologies and new forms of energy that can replace oil and thus create an energy supply compatible with the energy transition. However, while it is highly probable that this energy transition will be applied in Canada and Australia, there are doubts that these rules and economic policies can also be applied in the USA, which has repeatedly shown a reluctance to apply international regulations regarding reduction of pollution emissions. Furthermore, different considerations hold for Saudi Arabia and the Middle East. Saudi Arabia has implemented a long-run strategy aimed at reducing the oil component within the GDP, focusing on new economic sectors such as finance, technology and tourism. This change in the structure of the Saudi economy could favour the reduction of COE in the future and the creation of a more balanced and sustainable economic system for the countries of the Middle East. More difficult is the case of Russia. Russia is certainly one of the world's exporting countries of raw materials, oil and energy. However, the Russo-Ukrainian war changed the country's role as an energy producer especially vis-à-vis Europe. In addition, the international community has ordered sanctions against Russia. It follows that the country's possibility of being a significant international player in the energy market has been reduced and Russia will probably suffer the economic consequences of international sanctions in the future. The set of international economic policies and the search for methodologies to tackle the energy transition could allow C2 countries to reduce COE (Figure 3). Even if we doubts persist about the choices of the USA, which notoriously have, an autonomous and independent international position, that is often in conflict with the international community, which USA try to defend and support.

Figure 3 Countries in C2
Cluster 3: It is a cluster consisting of Andorra, Slovenia, Greece, New Zealand, Serbia, Belarus, United Kingdom, Denmark, Mongolia, Bosnia and Herzegovina, Cyprus, Bulgaria, Slovak Republic, China, Iran, Norway, Austria, Malaysia, the Bahamas, Italy, Antigua and Barbuda, South Africa, Ireland, Spain, Iceland, Poland, Israel, St. Kittis and Nevis, Seychelles, Venezuela, Equatorial Guinea, Barbados, Singapore, Belgium, Switzerland, Ukraine, France, Finland, Nauru, Portugal, Chile, Turkey, Libya, Hungary, Lebanon, Liechtenstein, Germany, Suriname, Netherlands, Malta, Argentina, Japan, Croatia, Sweden, Lithuania, Mexico, North Macedonia, Czech Republic, Romania, Iraq, Montenegro, Algeria, Latvia, Thailand, Uzbekistan. C3 countries have a median COE value of 5.24 or equal to 24% of C4 and equal to 36.69% of C2. The countries that within the C3 have a high value of COE are China, Mongolia, Japan, Libya, Iran, Germany, Poland, Austria, Ireland, Czech Republic, Slovakia, Belgium, Netherlands, Finland, Norway. These countries appear to be able to produce very high COE values within the C3. We can note that the C3 countries are heterogeneous in the sense of oil production. In fact, in the same cluster we found Algeria, which has a significant amount of energy resources, and Italy, which lack energy resources. It is very probable that the value of COE will be reduced within European countries, especially in Germany and Poland, following the implementation of economic policies aimed at the energy transition. However, similar results are also desirable in China and Japan because both countries have economic policy plans aimed at reducing COE. However, the C3 countries should be divided into two different subgroups, namely: countries with upper-middle per capita income and countries with lower-middle per capita income. Countries with medium-high per capita income or European countries will certainly have the possibility of reducing the COE value following the application of regulations aimed at combating climate change which require the achievement of carbon neutrality, the application of circular economy, and also the growth of renewable energy (Figure 4). However, countries that have a low per capita income have less chance of accessing the energy transition due to the difficulty of activating the EKC. Indeed, in order to reach a high value of per capita income, countries with medium-low per capita income need to consume more energy and therefore increase the COE value. In the long-run only the introduction of new technologies can reduce the level of COE for poor countries (Nordhaus, 2013).

Figure 4 Countries in C3
Cluster 4: Kuwait, Qatar, Bahrain, United Arab Emirates. C4 is the first cluster by COE value. These countries are engaged in oil production. If we consider the ranking of the major oil producers, we can see that the United Arab Emirates are in seventh place, Qatar in fifteenth place, Kuwait in tenth place, and Bahrain in thirty-seventh (Eia , 2008). However, if we consider the production of barrels per capita we can see that Kuwait is in first place with a value of 541,020 barrels per day per million inhabitants, followed by Qatar with 465,768, and by the United Arab United with a production of 333,062. Bahrain is in tenth place with a value of 116,433. Indeed, there is a positive relationship between the value of oil production as percentage of GDP and the value of COE. In the following figure, we note that Kuwait, Qatar, Bahrain, and the United Arab Emirates are among the countries that have the highest level of COE value and therefore have the highest value of oil value added as a percentage of GDP. However, it is probable that these values will change in the future due to the green transition that is taking place also in Middle East (Figure 5 & Figure 6).

Figure 5 Countries in C4

Figure 6 Relationship Between oil Rents and COE in 2019 for 193 Countries
We can see that Kuwait, United Arab Emirates, Qatar, and Bahrain have the highest levels of COE and oil rents.
The value of COE tends to grow with the value of per capita income especially in the case of C2. Instead, the COE value of C4 is exceptionally high, as it is made up of a group of countries that are specialized in the production and processing of oil in the Middle East area. Finally, there are doubts about the effectiveness of applying green-oriented economic policies. In fact, some BRICS countries and many Next-11 countries that currently have reduced COE values will increase energy consumption and production with a growth in COE as well, worsening the condition of climate change at a global level. To resolve the issue it is necessary not only to intervene with regulatory and economic policy instruments, but also to operate with the search for new technologies and new energy resources more green oriented. The international community should prevent poor countries from ending up in the “green trap” or in a condition such as having to choose whether to grow and pollute or whether to remain poor with low COE values.
Machine Learning and Predictions
A machine learning analysis for predicting the future value of COE is presented below. Eight different algorithms are analyzed on the basis of their ability to maximize the R-squared value and minimize the value of the statistical errors, i.e. MAE, MSE and RMSE. The algorithms are trained through the use of 70% of the available data, while the remaining 30% is used for the actual prediction. Each algorithm is assigned a ranking in the rankings. The rankings of the individual classifications are added together (Figure 7).

Figure 7 Ranking of Algorithms Based on their Predictive Performance
The best algorithm is the one that has the lowest score because of the sum of the highest rankings in the single rankings. The best performing algorithms in predictive terms are indicated below, namely:
a) ANN-Artificial Neural Network with a payoff value of 8;
b) Random Forest Regression with a payoff value of 9;
c) Simple Regression Tree with a payoff value of 12;
d) Polynomial Regression Tree with a payoff value of 14;
e) Gradient Boosted Tree Regression with a payoff value of 20;
f) Tree Ensemble Regression with a payoff value of 21;
g) PNN-Probabilistic Neural Network with a payoff value of 29;
h) Linear Regression with a payoff value of 31.
Therefore, it appears that the most representative algorithm in terms of predictive performance is the ANN-Artificial Neural Network. By applying the ANN, it is possible to identify countries for which the COE value is expected to grow which can be considered as losers and countries for which the COE value is expected to decrease which can be considered as winners. Among the losing countries there are Madagascar with +101.06%, Haiti +20.63%, Mali +18.31%, Equatorial Guinea with +15.64%, Brazil with +14.82%. Among the countries that can be considered as winners, or countries for which a reduction in the COE value is predicted, there are Moldova with -2.47%, Guyana with -2.13%, Italy with -1.38%, Cote d'Ivoire with - 0.48%, Slovakia with -0.02%. Overall, the COE value is predicted to decrease by a value of - 5.69%.
Conclusion
In conclusion, we can note that at the econometric level, COE tends to be consistent with the ESG model. The COE value decreases for economies that have a greater agricultural value added as component of the GDP, i.e. for countries that have low per capita incomes, which lack an evolved industrial system and which therefore have low levels of emissions. From the point of view of the cluster analysis, it appears that the COE value is high in the clusters of Western countries, especially in USA, Canada, Australia, Central and Northern Europe. Countries with low per capita incomes have low levels of COE. Indeed, one of the reasons countries have low per capita incomes is that they have low levels of COE. In fact, countries that have high levels of per capita income tend to have high levels of COE. Finally, the predictive analysis conducted with the application of machine learning algorithms shows a decreasing trend of the COE in the future.
From a political-economic point of view, the problem of the “green trap” emerges poor countries. In fact poor countries could be prevented from economic growth in order to guarantee the reduction of the COE. To avoid this phenomenon it is necessary to invest in new technologies that are able to keep together the needs of the growth in energy consumption necessary to support economic growth with the reduction of COE. Finally, in the Western world, there is a further problem i.e. greenwashing. The application of the ESG model far for being the light of an ethical maturity of the managers of big corporations, seem, otherwise, to re-propose the old free riding behaviour. In fact, big corporations aim to obtain higher ESG scores without making the necessary production modifications capable of guaranteeing the reduction of COE. An intervention by policy makers at national and international level is therefore needed to prevent greenwashing from nullifying the investments of ESG funds overall, laying the foundations for new scandals or green-based financial crises.
Declarations
Data Availability Statement
The data presented in this study are available on request from the corresponding author.
Funding
The authors received no financial support for the research, authorship, and/or publication of this article.
Declaration of Competing Interest
The authors declare that there is no conflict of interests regarding the publication of this manuscript. In addition, the ethical issues, including plagiarism, informed consent, misconduct, data fabrication and/or falsification, double publication.
Software
The authors have used the following software: Gretl for the econometric models, Orange for clusterization and network analysis, and KNIME for machine learning and predictions. They are all free version without licenses.
Acknowledgements
We are grateful to the teaching staff of the LUM University “Giuseppe Degennaro” and to the management of the LUM Enterprise s.r.l. for the constant inspiration to continue our scientific research work undeterred.
References
Alandejani, M., & Al-Shaer, H. (2023). Macro uncertainty impacts on esg performance and carbon emission reduction targets. Sustainability, 15(5), 4249.
Indexed at, Google Scholar, Cross Ref
Albitar, K., Borgi, H., Khan, M., & Zahra, A. (2023). Business environmental innovation and co2 emissions: The moderating role of environmental governance. Business strategy and the environment, 32(4), 1996-2007.
Baratta, A., Cimino, A., Longo, F., Solina, V., & Verteramo, S. (2023). The impact of ESG practices in industry with a focus on carbon emissions: Insights and future perspectives. Sustainability, 15(8), 6685.
Indexed at, Google Scholar, Cross Ref
Bauer, R., Derwall, J., & Tissen, C. (2023). Private shareholder engagements on material ESG issues. Financial Analysts Journal, Forthcoming.
Indexed at, Google Scholar, Cross Ref
Chan, Y. K., & Hsieh, M. Y. (2022). An empirical study on higher education C-ESG sustainable development strategy in lower-birth-rate era. Sustainability, 14(19), 12629.
Indexed at, Google Scholar, Cross Ref
Cong, Y., Zhu, C., Hou, Y., Tian, S., & Cai, X. (2022). Does ESG investment reduce carbon emissions in China?. Frontiers in Environmental Science, 10, 977049.
Indexed at, Google Scholar, Cross Ref
Costantiello, A., & Leogrande, A. (2023). The impact of research and development expenditures on esg model in the global economy.
Indexed at, Google Scholar, Cross Ref
Costantiello, A., & Leogrande, A. (2023). The regulatory quality and esg model at world level.
Indexed at, Google Scholar, Cross Ref
Costantiello, A., & Leogrande, A. (2023). The role of political stability in the context of esg models at world level.
Indexed at, Google Scholar, Cross Ref
Eia, U. S. (2008). US energy information administration.
Grundström, G., & Miedel, I. (2021). Sustainable Investing: On the relation between sustainability rating and greenhouse gas emissions.
In, S. Y., & Schumacher, K. (2021). Carbonwashing: A new type of carbon data-related ESG greenwashing.
Indexed at, Google Scholar, Cross Ref
Jiang, L., Gu, Y., Yu, W., & Dai, J. (2022). Blockchain-based life cycle assessment system for ESG reporting.
Indexed at, Google Scholar, Cross Ref
Karim, A. E., Albitar, K., & Elmarzouky, M. (2021). A novel measure of corporate carbon emission disclosure, the effect of capital expenditures and corporate governance. Journal of Environmental Management, 290, 112581.
Indexed at, Google Scholar, Cross Ref
Khalil, M. A., Khalil, R., & Khalil, M. K. (2022). Environmental, social and governance (ESG)-augmented investments in innovation and firms' value: A fixed-effects panel regression of Asian economies. China Finance Review International.
Indexed at, Google Scholar, Cross Ref
Kontz, C. (2023). Do ESG investors care about carbon emissions? Evidence from securitized auto loans. Evidence From Securitized Auto Loans.
Indexed at, Google Scholar, Cross Ref
Landier, A., & Lovo, S. (2020). ESG investing: How to optimize impact?. HEC Paris Research Paper No. FIN-2020-1363.
Indexed at, Google Scholar, Cross Ref
Laureti, L., Costantiello, A., & Leogrande, A. (2022). The fight against corruption at global level. A metric approach. A Metric Approach.
Indexed at, Google Scholar, Cross Ref
Laureti, L., Costantiello, A., & Leogrande, A. (2023). The role of government effectiveness in the light of esg data at global level.
Indexed at, Google Scholar, Cross Ref
Leogrande, A. (2023). The rule of law in the esg framework in the world economy.
Indexed at, Google Scholar, Cross Ref
Lyu, B., Ni, W., Ostic, D., Yu, H., & Qureshi, N. A. (2022). Can Carbon Trading Policy Promote China’s Decoupling of Carbon Emission from the Perspective of Technology-Driven Innovation?. Frontiers in Environmental Science, 10, 893947.
Indexed at, Google Scholar, Cross Ref
Nordhaus, W. (2013). The climate casino: Risk, uncertainty, and economics for a warming world. Yale University Press.
Pedersen, L. H., Fitzgibbons, S., & Pomorski, L. (2021). Responsible investing: The ESG-efficient frontier. Journal of Financial Economics, 142(2), 572-597.
Indexed at, Google Scholar, Cross Ref
Raghunandan, A., & Rajgopal, S. (2022). Do ESG funds make stakeholder-friendly investments?. Review of Accounting Studies, 27(3), 822-863.
Indexed at, Google Scholar, Cross Ref
Senadheera, S. S., Withana, P. A., Dissanayake, P. D., Sarkar, B., Chopra, S. S., Rhee, J. H., & Ok, Y. S. (2021). Scoring environment pillar in environmental, social, and governance (ESG) assessment. Sustainable Environment, 7(1), 1960097.
Indexed at, Google Scholar, Cross Ref
Received: 04-Nov-2023 Manuscript No. AAFSJ-23-14156; Editor assigned: 06-Nov-2023, PreQC No AAFSJ-23-14156 (PQ); Reviewed: 16-Nov-2023, QC No. AAFSJ-23-14156; Revised: 20-Nov-2023, Manuscript No. AAFSJ-23-14156(R); Published: 27-Nov- 2023