Research Article: 2021 Vol: 25 Issue: 3S
The Determinants of Individual, Systematic, and Systemic Risks of Indonesian Commercial Banks
Chandra Setiawan, President University
Chong Mi An, President University
Abstract
This study provides an insight to the individual, systematic, and systemic risk levels of large commercial banks in Indonesia and their determinants. Panel data regression is employed using random, fixed, and common effects respectively, following the results of Chow, Hausman, and LM tests. The sample covers 10 largest commercial banks for 13 consecutive years from 2006 to 2018 by both book value of total assets and market capitalization in Indonesia. Banks size, leverage, funding structure, and market-based activities are selected as the common bank-specific factors with findings indicating significant influence of bank’s size on both individual and systematic risks, although in opposite directions. Finally, the results revealed significant negative impacts of both stock volatility (δ) and beta (β) on systemic risk.
Keywords
Systematic Risk, Beta, Systemic Risk, Marginal Expected Shortfall
Introduction
Over a decade has passed since the Global Financial Crisis (GFC) which alarmed the public to re-assess and re-regulate the financial system in an unprecedented manner. This wake-up call called for a more holistic approach in regulating and supervising the financial system. The international regulatory approaches saw a shift of focus from micro-prudential to macro-prudential policies. When the former put more concern on the solvency risk of a single institution, the latter put greater emphasis on determining and minimizing the degree of individual institution’s degree of contribution to crises. The former was more concerned with the underlying market risks such as individual and systematic risk. In contrast, systemic risk, which is the key focus of the latter, arises from severe spill overs of severe distress events in a one-way direction—from institutions to the market (Kubitza & Gründl, 2016).
Empirically, at the center of the GFC were financial institutions of scale, specifically large banks, whose distress directly and indirectly damaged the real economy. Laeven, Ratnovski & Tong (2014) found that the “economies of scale” characteristics of large banks may be beneficial in terms of better diversification and lower fixed costs, which give them comparative advantage on an individual basis. On a systemic basis, however, the “too-big-to-fail” subsidies aspect is another unique characteristic of large banks where a government bail-out is assumed in the event of financial distress (Acharya, 2009; Beck, De Jonghe & Schepens, 2013).
Financial sector plays an essential role in advancing a nation’s economic growth. Its function can be classified into three: 1) mobilizing savings; 2) facilitating various transactions; 3) promoting efficient allocation of resources (Zhuang, Juzhong et al., 2009). Simply put, it provides access to finance which strongly correlates with economic growth. Therefore, questions on how to sequence financial sector development while balancing the innovative financial instruments and financial stability is a tough cookie to crack for majority of the developing countries, including the Indonesian financial sector. Indonesian financial sector is bank-centered where three quarters of the total assets are held by the banks. The stock market capitalization of the financial sector is 43.5%, half of which is held by top 10 financial institutions (BRSS, 2017). The financial assets concentration level is high due to the existence of few large banks, which dominates the larger half of the total banking sector assets.
Both the Asian and Global financial crisis triggered not only a necessity but also a critical need for a more multi-dimensional approach on risk management process of financial institutions. The types of risks have only increased in numbers from market risk to systemic risk. In the Indonesian context, this translates into an increasing importance of assessing the risk level of the banking sector and analyzing the determinants for the purpose of minimizing the risk.
In the aftermath of the crisis, the term Systemically Important Financial Institutions (SIFIs) was introduced. This term became associated with financial institutions whose distress or disorderly failure, due to their size, complexity and systemic interconnectedness, would cause significant disruption to the wider financial system and economic activity (IMF, 2011). In 2018, the Financial Services Authority (OJK) announced that they added 4 more banks to the SIFIs list, bringing a total of 15 domestically systematically important banks in Indonesia which further imply the availability of liquidity injections in the event of systemic crisis. The bail-out of JTrust bank in 2008 highlighted the importance of bank risk resilience.
The researcher then asked the following question: “What is the risk level of some of the largest banks in Indonesia and what their determinants are?” The combination of determinants and the degree of impact of systemic risks are conditional on country-specific factors such as its financial structure (Qin & Zhou, 2019; Benoit et al., 2013). In a concentrated banking sector such as in the case of Indonesia, the failure of a single SIFI can have lasting impact on the whole economy. As empirically proven, the occurrence of systemic risk is not common compared to a whole other range of existing risks. However, the severe consequences that come with it once it occurs are too great to be underestimated (Khan, 2004) and should be mitigated to the full extent.
This study aims to measure the three types of risks: individual, systematic, and systemic as well as their determinants specifically in the Indonesian banking sector context. The risk measures are proxied by Stock Volatility, Beta (β), and Marginal Expected Shortfall (MES), respectively. Panel data analysis of 10 large Indonesian banks that are publicly listed in the Indonesian Stock Exchange over the period of 13 years (2006-2018) provides a deeper insight into their risk levels as well as the identification of its determinants.
Despite the extensive literature on individual and systematic risk determinants, results differ depending on country-specific conditions and other various factors. There are only few studies which measure the systemic risk of Indonesian banks (Lenisatri, 2009; Lestari, 2014; E. Wibowo, 2017; Muharan & Erwin, 2017). Furthermore, as far as the researcher’s knowledge, this is the first study that attempts to establish the relationship between the three types of risks: individual, systematic, and systemic.
The researcher takes four bank-specific characteristics: bank size, leverage, funding structure, and market-based activities, then translates them into determinants of individual risk and systematic risk based on the research variables of Laeven, et al., (2014). However, the researcher employs different framework from both Laeven, et al., (2014); Ihsan & Wibowo (2017). Adopting the MES measure from Aharya, et al., (2010) to proxy for systemic risk, the research analyses the influence of the individual risk and systematic risk toward systemic risk.
Literature Review
Individual and Systematic Risk
A bank acts as a financial intermediary whose primary function is channeling funds from units of surplus capital to deficit ones. In other words, they collect deposits from savers and provide loans to borrowers (Casu et al., 2006). The advantages of the intermediation process can be better understood by observing what banks do and how they do it. The small-size, low-risk, and liquid assets (deposit) are transformed into larger size, higher risk, and less liquid assets (loans). Thus, the deposits undergo size, risk, and maturity transformation by the bank and bridging the financing gap is the role of the banks (Casu et al., 2006). A publicly listed bank faces both unsystematic and systematic risk.
Unsystematic risk is due to firm-specific factors; thus it can be removed/minimized, but systematic risk is faced by all firms as a result of market-based factors and cannot be removed (Husnan, 2001). Assuming that the market is efficient (Efficient Market Hypothesis), the unsystematic risk of a publicly traded firm is reflected by its stock risk (Copeland & Weston, 1983). High stock volatility indicates a higher level of firm risk and vice versa and is to be denoted as the proxy for Individual risk. This study employs widely accepted measure of stock volatility and standard deviation.
Systematic risk is mainly concerned with the general correlation between an institution’s assets and the overall market. This study employs Beta (β) as the proxy measure of systematic risk. Expressed as the sensitivity of a stock’s returns to the returns of the market as a whole, Beta (β) has an extensive number of literatures as the most widely accepted systematic risk measure. There are several terms that refer to the same concept such as market risk, stock beta, and equity beta. The literature on Beta (β) of a stock is commonly referred to as Stocks-β. This can be classified into 3 types of Beta (β) which vary depending on their source of raw data as well as the calculation approaches (Hartono, 2000). This study employs market beta using Capital Asset Pricing Model (Sharpe, 1964) as the regression model, which is based on market data such as historical returns of a stock and the market during a specified period. The CAPM suggests there is a positive linear relationship between the stock return and its beta (Sharpe, 1964). It assumes two types of risks for a stock: systematic and unsystematic. The systematic risk arises from market’s volatility due to the covariance of the stock’s return with that of the market.
The Determinants of Individual and Systematic Risk
Systematic risk tends to be lower for large banks because they have the ability to mitigate the worst outcomes resulting from changes of a political, social and economic nature (Sullivan, 1978). Market power of large firms enables larger banks to diversify, which lowers their systematic risk level (Titman & Wessels, 1988). Economics of scale is another reason why large firm is likely to have lower systematic risk, ceteris paribus (Olib et al., 2008). Aside from the “economics of scale” and “diversification” hypothesis, systematic risk can be negatively impacted by size (Gu & Kim, 2002; Lee & Jang, 2007; Al Qaisi, 2011; Biase & Apolito, 2012; Iqbal & Shah, 2012; Puspitaningtyas, 2017). This can be explained by the “too-big-to-fail” characteristics of large banks (Acharya, 2009; Beck, De Jonghe & Schepens, 2013). Both hypotheses indicate opposing influence of bank size on individual and systematic risk where the former benefits from lower individual risk based on the “economies of scale” characteristics, but the latter experiences higher systematic risk due to “too-big-to-fail” characteristics of large banks (Laeven et al., 2014).
H1 The banks size, leverage, funding structure, and market-based activities have a significant influence toward individual risk.
Hamada (1972) analyses that systematic risk is significantly influenced by financial leverage. Based on debt-to-equity ratio, it expresses how much of the firm’s operations are financed with debt or funded from creditors (Artikis & Nifora, 2013; Shahzad et al., 2015) and commonly accepted as the proxy for financial leverage (Bowman, 1979; Moyer & Chatfield, 1983; Kim et al., 2007). Financial theory proposes that financial leverage results in higher exposure to systematic risk for the shareholders (Amit & Livnat, 1988; Chu, 1986). Considering a bank’s capital structure, when the debt portion is much bigger than the equity portion, it results in higher individual risk (Modigliani & Miller, 1958) and systematic risk (Bowman, 1979; Tandelilin, 1997; Puspitaningtyas, 2010; Shahzad et al., 2015).
Traditionally for banks, deposit has been the basic source of funding as they are relatively cheap and stable source of funding compared to others. Deposit-to-total asset ratio is employed as proxy for the bank’s funding structure. A higher deposit ratio for banks indicates stable funding and consequently lower systematic risk than competing banks with more volatile source of funding. Vennet, Baele & Jonghe (2005) found that the systematic risk is negatively impacted by deposit ratio in their study of 143 European banks. Same negative influence is found for individual risk, since non-depository funding has been found to increase the stock volatility (Laeven, Ratnovski & Tong, 2014). This indicates that the funding structure negatively impacts both systematic and individual risk of banks.
Another traditional activity of banks is loan lending. High loan ratio indicates less participation in market-based activities and vice versa. Agusman, et al., (2008) found significant influence of loan ratio on beta of a sample selection of 46 Asian banks. A number of studies have also found that loan ratios have a negative impact on systematic risk (Vennet, Baele & Jonghe, 2005; Biase & Apolito, 2012). This indicates that higher proportion of loans, or in other words low degree of participation in the market-based activities, decreases systematic risk.
H2 a) The banks size, b) funding structure and c) market-based activities have negative influence toward systematic risk; d) leverage has significant positive influence toward systematic risk.
Systemic Risk
In contrast to the systematic risk, systemic risks arise from spill overs of particularly severe stress events which consequently will result in systemic crisis. In such systemic events, the direction of the spill over is one-way—from institutions to markets (Kubitza & Gründl, 2016). Acharya (2009) contributed to the strengthening of the concept of systemic risk by defining it as an event in which the risk generated by one financial institution will cause the collapse of other financial institutions. Benoit et al., (2017) describes it as a macroeconomic event which can be the cause of simultaneous severe losses for the market participants diffused through the financial system.
Over the past decade, the literature on systemic risk measure has grown although still considered to be limited in its value for policy decision making. The first approach, also known as the supervisory approach, utilizes variables of size, leverage, and complexity to measure the systemic risk of a financial institution (Basel Committee on Banking Supervision, 2013; Greenwood, Landier & Thesmar, 2015). The second approach, which only relies on publicly available market data, utilizes variables such as stock returns. This is based on the assumption that the data reflect information about the publicly traded firm.
VaR is the most commonly used measure at firm level. It measures the maximum monetary loss within a q-confidence interval (Jorion, 2007; Kupiec, 2002). The lack of coherent risk measure is its limitation. It does not take into account the worst-case scenario, the remaining 1% (Artzner et al., 1999). As an upgraded formula to VaR measure, the concept of CoVaR formulated by Adrian & Brunnermeier (2009) measures the VaR of the conditional financial system on institutions under distress. It critically depends on the size of the Institution, leverage, and maturity mismatch. A financial institution’s marginal contribution to systemic risk is defined as the difference between CoVaR and the VaR of the financial system. Major limitation of this measure is that it is not additive (Tarashev et al., 2010).
One more extension of VaR is the Marginal Expected Shortfall (MES) which measures the expected equity decline in case the market falls under a specified threshold within a given time horizon. It is the marginal contribution of an institution j to systemic risks measured by the Expected Shortfall (ES) of the system. Proposed by Acharya, et al., (2010), this measure naturally extends the VaR (Jorion, 2007) to a coherent risk measure. MES measures the financial system’s sensitivity in relation to a unit variation in the financial firm’s ES, assessing the degree of the firm’s systemic risk contribution to the financial system as a whole. Acharya, et al., (2010) argue that MES and leverage have strong explanatory power in case of systemic risk compared to alternative measures such as VaR (Value-at-risk), expected loss, volatility, and covariance (i.e., beta).

Figure 1: Proposed Conceptual Model
Research Method
The Measurement of Bank Risks
As the proxy of individual risk, stock volatility is achieved from the historical data on daily stock prices of the selected sample banks. The stock volatility is measured through the actual historical volatility method where the variance of the daily stock prices for the observed period are achieved and taken square root to achieve the standard deviation. The calculation is formulated as follows:
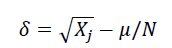
Where δ is Standard deviation of the stock-j, Xj is each return value of stock-j for N number of days, μ is the mean return of stock-j for N days, and N is the number of observed stock returns.
As the proxy of systematic risk, market beta is achieved by calculating the covariance from CAPM. The expected return on a risky asset is a composition of risk-free rate and the risk premium, in which the risk premium is expressed as the excess market return over the risk-free rate times the level of systematic risk for the selected stock (Litner, 1965; Sharpe, 1963, 1964). The CAPM captures only the systematic risk of the required return of a stock. The calculation is formulated as follows:
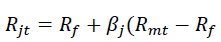
Where, Rjt is the Return of stock-j at moment-t, Rf is risk-free rate, βj is estimated beta of stock-j, and Rmt is return of market portfolio at moment-t.
As the proxy of systemic risk, the researchers adopt Acharya, et al., (2010) Marginal Expected Shortfall (MES) by taking into account the simplicity of the calculation as well as better explanatory power compared to alternative firm-level measures as previously discussed. Systemic risk arises in the event of an extreme case scenario. For generalization purposes, the MES measure in this study focuses on “Normal” tail an event, that is the worst 5% outcome of the market in a year on a daily basis. Therefore, the MES in this study reflects the average return of the stock-j during the 5% worst days for the market return. This can be formulated as follows:
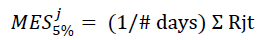
t: system is in its 5% tail
Where, MESj5% stands for marginal expected shortfall of stock-j dependent on the 5% left tail of the market (^JKSE), # days is 5% number of trading days per annum in capital market and Rjt is returns of stock-j during the 5% worst day for market.
The Influence of Banks Size, Leverage, Funding Structure, and Market-based Activities
In this study, the panel data regression models adopted to analyze the determinants of individual and systematic risk are formulated as:
Risk δ=α+β1Size+β2DER+ β3DepositTA+ β4LoanTA+ e
Risk β=α+β1Size+β2DER+ β3DepositTA+ β4LoanTA+ e
Where, independent variables are denoted as Size (Log_TA), DER (Debt_Equity), DepositTA (Deposit_TA), and LoanTA (Loan_TA).
The Influence of Individual and Systematic Risk toward Systemic Risk
In this study, the panel data regression model adopted to analyze the determinants of systemic risk is formulated as:
Risk MES=α+β1Volatility+β2Beta+ e
Where independent variables are denoted β1Volatility (Individual risk) and β2Beta (systematic risk).
Data
The data frequency is annual with research period set for 13 consecutive years from 2006 to 2018. Researchers employ panel data as it gives the researchers a large number of data points which increase the degree of freedom and reduce the collinearity among the independent variables. Panel Data provides the possibility of learning an individual’s behavior by observing the behavior of others (Hsiao, 2006). Through selective sampling process concerning book value and market capitalization, 10 Indonesian commercial banks were chosen. The cumulative asset size of 10 selected sample banks is approximately IDR 2,033 Trillion, which take up roughly 30% of the total Indonesian market capitalization and over 90% of the total market capitalization of Indonesian banking sector. The financial data were collected from Bankscope, IDX’s website (www.idx.co.id) and YahooFinance website (www.finance.yahoo.com).
Robustness
In addition to the classical assumption tests of normal distribution (Jarque-Bera test), multicollinearity (P-value), heteroscedasticity (White period, period weights, LR test), and Autocorrelation (Durbin-Watson test), for the descriptive statistics, the panel data was tested for the appropriate type regression model: Common, Fixed, and Random using Chow-test, Hausman, and Lagrange Multiplier test.
Results and Discussion
Indonesian Banks Risk Level Trend
Employing the measures stock volatility (δ), beta (β), and mesi5% as the proxies, Table 4.1 presents the three measures of risk for the 10 selected banks in Indonesia. Note that each measure has been averaged from 13 years of time series data.
| Table 1 Average Risk Level of Commercial Banks in Indonesia (2006-2018) |
|||
|---|---|---|---|
| Bank | δ | β | mesi5% |
| BBCA | 1.89% | 1.02 | -2.70% |
| BBNI | 2.41% | 1.23 | -3.41% |
| BBRI | 2.60% | 1.43 | -3.61% |
| BDMN | 2.69% | 1.19 | -3.13% |
| BMRI | 2.40% | 1.43 | -3.82% |
| BNGA | 2.52% | 0.89 | -2.78% |
| BNII | 2.47% | 0.63 | -1.74% |
| MAYA | 4.08% | 0.18 | -0.25% |
| MEGA | 2.76% | 0.16 | -0.49% |
| PNBN | 2.62% | 0.86 | -3.00% |
Source: Bankscope, YahooFinance (Adjusted by researchers, 2020)
The highest measure of individual risk (δ) is from MAYA. This indicates that their stock returns have been the most volatile during 2006-2018. BBCA is the least volatile that indicates lowest individual risk followed by BMRI and BBNI. The systematic risk (β) is all in positive numbers, which indicates that these stocks move in the same direction with the market. Both BBRI and BMRI display the highest measures of β, which implies that these stocks are 1.43 times more volatile than the market (^JKSE).
As mesi5%measures the expected shortfall dependent upon the market’s 5% worst days of return, the measures are of negative value. The systemic risk measures (mesi5%are highest for BMRI, BBRI, BBNI, and BDMN below the -3% margin. This means that the average capital shortfall of these four banks on the 5% days of worst outcome for the market during 2006-2018 is more than 3% per day. The least systemically risky banks are MAYA and MEGA with average expected shortfall at less than -0.5% margin.
The individual risk of large banks showed a declining trend over the years. The individual risk is observed to be the highest in 2008, with the volatility measure of more than 4%. The time aligns with the GFC in which the ^JKSE declined more than 40% during the first half of 2008. The average beta (β) measure of large Indonesian banks is approximately 0.9. This implies that the systematic risk in the Indonesian banking sector is low as it is less volatile than the market. The large banks’ sensitivity to the market seems to show a slightly declining trend, but the scale is not significant. The trend seems to display a time cycle of 5 years. The overall systemic risk of large banks in Indonesia is showing a declining trend. The highest measure of mesi5% is achieved in 2008 where the average expected shortfall per days was almost -5%. This indicates that a bank was at the risk of losing more than 5% of their stock value in a single day. This is in line with the GFC in 2008 where the ^JKSE lost more than 40% of its value in the first half of 2008.
Determinants of Individual and Systematic Risks
The dependent variable volatility (δ) has a value range of 1% to 5.8%, with a mean of 2.64% and standard deviation of 1%. The panel data is a balanced panel with 130 observations for each variable. The data frequency is annual. The independent variable Log_TA is logged from total assets because they are large in number. Debt_Equity, Deposit_TA and Loan_TA are ratios. The regression is conducted with 6-decimal accuracy, but has been rounded up to 3 decimal places in Tables 2 and 3.
| Table 2 Multiple Regression Test of Individual Risk |
|||
|---|---|---|---|
| Variable | Coefficient | t-statistic | Prob. |
| C | 0.0667 | 5.030451 | 0 |
| Log_TA | -0.004 | -7.892031 | 0.0000*** |
| Debt_Equity | 0.0001 | 1.522242 | 0.1305 |
| Deposit_TA | 0.0283 | 1.507691 | 0.1341 |
| Loans_TA | 0.0104 | 1.586726 | 0.1151 |
| Adjusted R2 | 0.311809 | ||
| F-Statistic | 15.612 | ||
| Probability F- Statistic | 0 | ||
Log_TA is the only variable which has a significant negative partial influence toward individual risk. However, the coefficient value of -0.004 indicates that the influence is not strong. The F-static reveals that all 4 variables have a significant simultaneous influence toward the individual risk of around 31%.
| Table 3 Multiple Regression Test of Systematic Risk |
|||
|---|---|---|---|
| Variable | Coefficient | t-statistic | Prob. |
| C | -6.1146 | -12.03142 | 0 |
| Log_TA | 0.3916 | 15.7348 | 0.0000*** |
| Debt_Equity | -0.0315 | -2.510036 | 0.0135* |
| Deposit_TA | -1.1001 | -2.730264 | 0.0073*** |
| Loans_TA | 1.1111 | 4.714444 | 0.0000*** |
| Adjusted R2 | 0.749894 | ||
| F-Statistic | 25.17387 | ||
| Probability F-Statistic | 0 | ||
Source: Proceeded by EViews 10, 2020
All 4 variables have a significant partial influence toward the systematic risk. The F-statistic reveals that the simultaneous influence of all 4 variables account for 75% of the changes in the systematic risk.
Relationship Individual, Systematic and Systemic Risk
The measure of mesj5% has a value range of -9.5% to 2.9% with a mean of -2.5% and standard deviation of 2%. The panel data is a balanced panel with 130 observations for each variable. The raw data is collected on a daily basis. After the calculation, the results are averaged to annual frequency. The independent variables’ volatility (δ) and beta (β) use the same data set from previous regressions.
Both the Individual risk and the systematic risk negatively influence the systemic risk. As revealed on Table 4, the variation of independent variables can explain the variation of the dependent variable accounting for 52%.
| Table 4 Multiple Regression Test of Systemic Risk |
|||
|---|---|---|---|
| Variable | Coefficient | t-statistic | Prob. |
| C | 0.0149 | 3.225187 | 0 |
| Volatility | -0.5292 | -3.92357 | 0.0001*** |
| Beta | -0.0287 | -11.65884 | 0.0000*** |
| Adjusted R2 | 0.51917 | ||
| F-Statistic | 70.64293 | ||
| Probability F-Statistic | 0 | ||
Source: Proceeded by EViews 10, 2020
Discussion of Determinants
Only Size out of four independent variables has a significant impact on the individual risk (stock volatility) of the bank. The coefficient is -0.004, which implies negative but small impact. Keeping in mind that the samples in this study are large commercial banks with total book value of above 50 trillion, the result shows that large banks are individually less risky compared to smaller banks. This is theoretically plausible as the larger banks are more stable, which contributes to higher investor confidence. The too-big-to-fail hypothesis may also be another viewpoint as larger bank is less likely to fail especially in time of crisis due to expected government bail-out, which contributes to higher investor confidence in their stock performance. The results are supported by the existing literature in that size is one of the most significant factors in determining the individual risk of a bank. Nisafat & Irfan (2004) find that the influence of size on the stock volatility goes both ways corresponding to the period. Before the capital market reform in Pakistan, the results were negative, while after the reform, the results turned positive. This implies that structural breaks may be one of the controlling variables in the direction of influence. Overall, this study reinforces the theory that size is a determinant of stock volatility—and in the case of large banks, the influence is negative.
Firm size positively influences beta. This goes against the financial theory that the larger the firms, the lower their systematic risk (Sullivan, 1978). However, such opposing result is existent in the previous literature (Gu & Kim, 2004; Lee & Jang, 2007; Al Qaisi, 2011). Biase & Apolito (2012) found bank size positively influences systematic risk of Italian banks. Iqbal & Shah (2012) also come to same conclusion in case of Pakistani firms. In the Indonesian context, Puspitaningtyas (2017) concludes that only firm size has positive impact on beta of manufacturing firms. A positive and highly significant correlation between bank size and systematic risk indicates that despite the individual stability of large banks in general periods, they tend to be exposed to higher market risk in times of crisis. Too-big-to-fail hypothesis and existing literature on the characteristics of large banks supports that diversification is a strong pro-point for large banks, but also serves as a double-edged sword. Diversification of activities results in more involvement in other (especially market-based) activities and complex transactions. This aligns with the too-big-to-fail hypothesis, which states that large banks tend to take higher risks as the public safety net acts as an incentive rather than a deterrent. Diversification of activities also means higher involvement in the market as a whole, thus allowing for higher propensity to common shocks as shown in the last two financial crises.
Debt ratio negatively influences beta. This is in opposition to the financial theory by Hamada (1972) and also the findings of Tandelilin (1997). The Hypothesis (H2:b) is thus rejected. However, the result is supported by existing literature (Chun & Ramasamy, 1989; Al Qaisi, 2011; Aruna &Warokka, 2013). For banks whose role is that of financial intermediary, being highly leveraged may have completely different implications compared to other sectors. Meanwhile, having high leverage ratio usually means higher risk to the firm due to heavy interest expense. It can also provide access to larger and quick capital in case of stable interest rate. There is no better situation than when a bank is fueled by endless capital of funding regardless whether they come from equity or debt. Higher capitalization translates into more loans and thus higher profit margin in the hands of capable banks. Banks themselves charge substantially higher interest rate on the loans they offer to their customers and with the spread between the borrowing rate and lending rate set to constant, larger quantity means larger gain. In the study of Boyd & De Nicolo (2005); Wibowo & Wibowo (2016), large banks with strong market power have the ability to set the market price and therefore tend to charge higher interest rate to their debtors, increasing the spread. In the Indonesian context, large banks are highly leveraged with the market power to set the market price and thus highly profitable. This results in negative correlation between leverage and systematic risk.
Deposit ratio negatively influences beta. This is in line with the findings of Vennet, Baele & Jonghe (2004) where the larger share of deposit decreases systematic risk of a bank. High proportion of deposit in the funding is a stable source of capital for banks. Therefore, this contributes to a lower systematic risk. In other words, lower deposit ratio means higher non depository funding by the banks. The result implies that higher non depository funding increases systematic risk of banks. The fact that the funding is dependent upon sources other than deposit in case of banks implies that there is uncertainty and instability in the funding sources itself. As deposit is the major source of funding for banks in the traditional context, any other types of sources would be non-traditional and therefore riskier. This will result in an increased systematic risk for banks as investors are likely to perceive the funding operations as riskier.
Loan ratio positively influences beta, thus rejecting the hypothesis (H2:d). The finding is supported by Biase & Apolito (2012) who found significant positive influence of loan ratio on beta of Italian banks. The rationale to this finding is that higher loan ratio indicates lower proportion of market-based activities in the banks. In the traditional context, giving out loans is the bank’s primary activity. However, in modern context, banks participate more and more in market-based activities aside from loan lending. Large loan and deposit share is the characteristics of small-medium retail banks. Large banks are more likely to participate in market-based activities as they diversify, and this serves as a diversification of risks. Another explanation could be when large banks participate in market-based activities, the risk is much lower than those faced by small-medium banks and may be lower than Non-Performing Loan (NPL) risk. Overall, low degree of market-based activities results in increased systematic risk of banks.
Stock volatility negatively influences systemic risk level of large banks. Large banks which actively participate in market-based activities have high systemic risk, but they display low individual risk (Laeven, Ratnovski & Tong, 2014). This implies that just because a bank possesses significantly high systemic risk, it does not necessarily mean that they also have high individual risk. The negative relationship between volatility (δ) and systemic risk measure (mesi 5%) implies the more volatile the stock price is, the lower the systemic risk of the bank. In other words, banks whose stock price is stable poses greater systemic risk compared to banks with fluctuating stock prices.
Beta is also found to negatively influence systemic risk level of large banks. The direction of the systemic spill-over effect is from the institutions to the market as a whole. The negative correlation between beta and mesi 5% indicates the higher the correlation with the market, the lower the systemic risk the bank poses. In other words, systematic risk level decreases the systemic risk level, although slightly.
Conclusions and Implications
The beta measurement close to a value of 1 (one) indicates that the stock movement of large Indonesian banks almost coincides with the market as a whole. The trend analyses indicate that the individual and systemic risk of large Indonesian banks are gradually decreasing overtime, indicating increased stability in the stock movement. The only significant determinant of individual risk (stock volatility) is found to be firm size with negative influence. Large banks have lower individual risk than smaller banks. This may be due to various factors such as better diversification, larger capital cushion for shocks, higher profitability, and so on.
All four variables—size, leverage, funding structure and market-based activities—are found to have significant impact on systematic risk (beta). Large banks that are actively engaged in market-based activities have higher systematic risk compared to smaller banks who are less involved in the market, but rather in traditional ones such as loan lending. On the other hand, highly leveraged banks with high depository funding structure are likely to have lower systematic risk than those with low leverage or low depository funding.
Lastly, both individual and systematic risks have a significant negative impact on the systemic risk of large Indonesian banks. This negative impact implies that despite the low volatility and beta, large banks are still exposed to high systemic risk.
In the Indonesian context, the stability of the financial sector, especially in banking is crucial to maintain an overall stability in the market. Despite having lower individual risk, large banks are more exposed to common shocks. Although the direction of the systemic risk spill-over effect is from institutions to the market, the trigger may come from the market through common shocks. The analyses reveal that active market-based activities, low leverage, non-depository funding all contribute to increasing systemic risk, especially in the case of large banks. Hence, the regulators should take full caution and take further measures in the capital requirement standards for large banks on the basis of Basel III principles on capital surcharges for systemically important banks. Once again, size is the single most decisive factor in determining risk level of a bank. Managers and shareholders of large banks should capitalize on the “economics of scale” while keeping in check the capital buffer in case of shock. Depository funding and loan lending activities may be traditional way of banking but the least risky one.
For future research, a full sample selection of all listed banks in Indonesia with size as control variables would provide a more solid and comprehensive outlook on the topic. In addition, further look into the relationship between individual risk, systematic risk, and systemic risk for the purpose of establishing a theoretical background would contribute significantly to the literature.
References
- Acharya, V. (2009). A theory of systemic risk and design of prudential bank regulation. Journal of Financial Stability, 5(3), 224–255.
- Acharya, V., Pedersen, L., Philippe, T., & Richardson, M. (2010). Measuring systemic risk. Technical report, Department of Finance, NYU.
- Acharya, V., Engle, R., & Richardson, M. (2012). Capital shortfall: A new approach to ranking and regulating systemic risks. The American Economdic Review, 102, 59-63.
- Adrian, T., & Markus, K.B. (2009). CoVaR. Federal Reserve Bank of New York Staff Report, 348.
- Adrian, T., & Brunnermeier, M.K. (2016). CoVaR. American Economic Review, 106(7), 1705-41.
- Agusman, A., Monroe, G.S., Gasbarro, D., & Zumwalt, J.K. (2008). Accounting and capital market measures of risk: Evidence from Asian banks during 1998–2003. Journal of Banking & Finance, 32(4), 480-488.
- Alaghi, K. (2013). Determinants of systematic risk of the listed companies in Tehran stock exchange. Journal of Basic and Applied Scientific Research, 3(1), 596- 600.
- Al-Qaisi, K.M. (2011). The economic determinants of systematic risk in the Jordanian capital market. International Journal of Business and Social Science, 2(20).
- Amit, R., & Livnat, J. (1988). Diversification, capital structure, and systematic risk: An empirical investigation. Journal of Accounting, Auditing & Finance, 3(1), 19-43.
- Anderson, J.O. (2006). Quantitative and qualitative research. Imperial COE,2006.
- Casu, B., Girardone, C., & Molyneux, P. (2006). Introduction to banking. Pearson education.
- Artikis, P.G., & Nifora, G. (2013). Leverage premium in a southern European frame. Journal of Computational Optimization in Economics and Finance, 5(1), 1.
- Artzner, P., Delbaen, F., Eber, J.M., & Heath, D. (1999). Coherent measures of risk. Mathematical finance, 9(3), 203-228.
- Aruna, D.C., & Warokka, A. (2013). Systematic risk and accounting determinants: A new perspective from an emerging market. Journal for Global Business Advancement, 6(1), 24-37.
- Beaver, W., Kettler, P., & Scholes M. (1970). The association between market determined and accounting determined risk measures. Accounting Review, 654-682.
- Beck, T., De Jonghe, O., & Schepens, G. (2013). Bank competition and stability: Cross-country heterogeneity. Journal of financial Intermediation, 22(2), 218-244.
- Benoit, S., Colletaz, G., Hurlin, C., & Pérignon, C. (2013). A theoretical and empirical comparison of systemic risk measures. HEC Paris Research Paper.
- Biase, P.D., & D’Apolito, E. (2012). The determinants of systematic risk in the Italian banking system: Across-sectional time series analysis. International Journal of Economics and Finance, 4(11), 152-164.
- Bowman, R.G. (1979). The theoretical relationship between systematic risk and financial (accounting) variables’. Journal of Finance, 34(3), 617–630.
- Boyd, J.H., & De Nicolo, G. (2005). The theory of bank risk taking and competition revisited. Journal of Finance, 60(3), 1329-1343.
- Brownlees, C.T., & Engle, R.F. (2016). SRISK: A conditional capital shortfall measure of systemic risk.
- Casu, B., Girardone, C., & Molyneux, P. (2006). Introduction to banking. Pearson education.
- Chan, K.C., & Chen, C. (1988). An unconditional assets-pricing test and the role of firm size as an instrumental variable for risk. Journal of finance, 309-325.
- Chu, J. (1986). Toward a flexible capital structure. The Bankers Magazine, 169(2), 48-54.
- Chun, L.S., & Ramasamy, M. (1989). Accounting variables as determinants of systematic risk in Malaysian common stocks. Asia pacific journal of management, 6(2), 339-350.
- Copeland, T.E., & Weston, J.F. (1983). Financial Theory and Corporate Policy. Addison.
- French, K.R., Schwert, G.W., & Stambaugh, R.F. (1987). Expected stock returns and volatility. Journal of Financial Economics, 19(1), 3.
- Gortsos, C. (2017). The basel committee on banking supervision through the lens of its 2013 charter. SSRN Electronic Journal, 10(2), 139.
- Greenwood, R., Landier, A., & Thesmar, D. (2015). Vulnerable banks. Journal of Financial Economics, 115(3), 471-485.
- Gu, Z., & Kim, H. (2002). Determinants of restaurant systematic risk: A reexamination. Journal of Hospitality Financial Management, 10(1), 1–13.
- Hamada, R.S. (1972). The effect of the firm’s capital structure on the systematic risk of common stock. Journal of Finance, 27, 435-452.
- Hartono, J. (2000). Portfolio theory and investment analysis. BPFE, Yogyakarta.
- Haq, M., & Heaney, R. (2012). Factors determining European bank risk. Journal of International Financial Markets, Institutions and Money, 22(4), 696-718.
- Hsiao, C. (2006). Analysis of panel data. Cambridge University Press, New York.
- Husnan, S. (2001). Fundamentals of portfolio theory and securities analysis. UPP AMP YKPN, Yogyakarta.
- Ihsan, M., & Wibowo, S.S. (2017). The impact of bank size, capital, and funding structure to systemic risk: Evidence from ASEAN-5 countries. International Journal of Economics & Management, 11.
- Iqbal, M.J., & Shah, S.Z.A. (2012). Determinants of systematic risk. The Journal of Commerce, 4(1), 47.
- Jorion, P. (2007). Value at risk: The new benchmark for managing financial risk. The McGraw-Hill Companies, Inc.
- Kim, W., Ryan, B., & Ceschini, S. (2007). Factors affecting systematic risk in the US restaurant industry. Tourism Economics, 13(2), 197–208.
- Kleinow, J., & Nell, T. (2015). Determinants of systemically important banks: The case of Europe. Journal of Financial Economic Policy, 7(4), 446-476.
- Kleinow, J., Horsch, A., & Molina, M.G. (2017). Factors driving systemic risk of banks in Latin America. Journal of Economics and Finance, 41, 211–234.
- Kubitza, C., & Gründl, H. (2016). Systemic risk: Time-lags and persistence. Goethe University Frankfurt, International Center for Insurance Regulation (ICIR).
- Kupiec, P. (2002). Stress-testing in a value at risk framework. Risk management: value at risk and beyond, 76-99.
- Laeven, M.L., Ratnovski, M.L., & Tong, M.H. (2014). Bank size and systemic risk. International Monetary Fund.
- Lee, C.F., & Lee, J. (2010). Handbook of quantitative finance and risk management. Springer Science & Business Media
- Lee, J.S., & Jang, S.C.S. (2007). The systematic risk determinants of the US airline industry. Tourism Management, 28, 434-442.
- Lintner, J. (1965). Security prices, risk and maximal gains from diversification. Journal of Finance, 20(4), 587-615.
- Modigliani, F., & Miller, M.H. (1958). The cost of capital, corporation finance and the theory of investment. The American economic review, 48(3), 261-297.
- Moyer, C., & Chatfield, R. (1983). Market power and systematic risk. Journal of Economics and Business, 35(1), 123–130.
- Nishat, M., & Irfan, C.M. (2004). Dividend policy and stock price volatility in Pakistan. In Pide-19th annual general meeting and conference, 13-15.
- Olib, O.K., Michello, A.F., & Thorne, J. (2008). Systematic risk and international diversification: An empirical perspective. International Review of Financial Analysis, 17, 681-698.
- Puspitaningtyas, Z. (2017). Estimating systematic risk for the best investment decisions on manufacturing company in Indonesia. Investment management and financial innovations, 14(1), 46-54.
- Qin, X., & Zhou, C. (2019). Financial structure and determinants of systemic risk contribution. Pacific-Basin Finance Journal, 57, 101083.
- Robert, G.B. (1979). The theoretical relationship between systematic risk and financial (Accounting) variables. The Journal of Finance, 34(3), 617-630.
- Shahzad, S.J.H., Ali, P., Ahmad, T., & Ali, S. (2015). Financial leverage and corporate performance: Does financial crisis owe an explanation? Pakistan Journal of Statistics and operation Research, 67-90.
- Sharpe, W.F. (1963). A simplified model of portfolio analysis. Management Science, 9(2), 425-442.
- Sharpe, W.F. (1964). Capital asset prices: A theory of market equilibrium under conditions of risk. The journal of finance, 19(3), 425-442.
- Sullivan, T.G. (1978). The cost of capital and the market power of firms. The Review of Economics and Statistics, 209-217.
- Tarashev, N.A., Borio, C.E., &Tsatsaronis, K. (2010). Attributing systemic risk to individual institutions.
- Tandelilin, E. (1997). Determinants of systematic risk: The experience of some Indonesian common stock. Kelola.
- Titman, S., & Wessels, R. (1988). The determinants of capital structure choice. The Journal of finance, 43(1), 1-19.
- Vander Vennet, R., Baele, L., & De Jonghe, O. (2005). Determinants of systematic and idiosyncratic banking risk in Europe. Working paper, Ghent University.
- Wibowo, B. (2017). Systemic risk, bank’s capital buffer, and leverage. Economic Journal of Emerging Markets, 9(2), 150-158.
- Wibowo, I.G., & Wibowo, B. (2016). The effect of competition level and banking concentration to systemic risks: Indonesia Case.
- Zhuang, J. (2009). Financial sector development, economic growth, and poverty reduction: A literature review. ADB Economics Working Paper Series, Asian Development Bank (ADB), Manila.